Select units of measurement for the temperature and rainfall tables (metric or imperial).
Average weather, temperature, rainfall, sunshine
If we consider also the Himalayas, it is said a bit emphatically that India has all the climates of the world, but in most of the country, the climate is
subtropical in the north (more or less up to the Tropic of Cancer) and
tropical in the center-south (south of the Tropic).
Also, the climate in India is affected by the
monsoon regime, with a dry and a rainy season. The wettest period goes generally
from July to September, except in the southeast, where the monsoon is more intense
at the end of the year (retreating monsoon).
In the following map, we can see the climate zones of India.
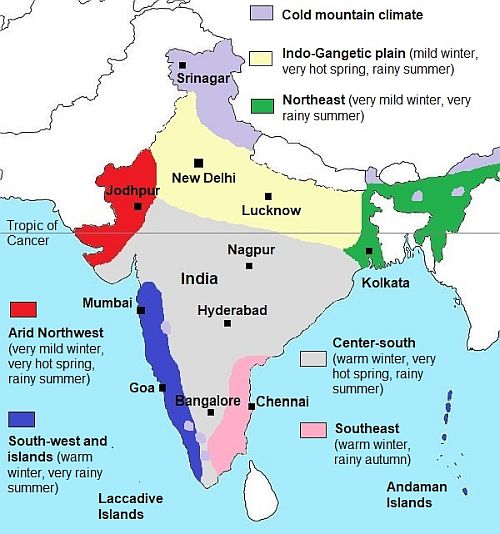
The
rains are more abundant on the south-west coast (see Mumbai, Goa, Mangalore), where they exceed 2,000 millimeters (80 inches) per year, and in the north-east (see Calcutta and the states bordering Bangladesh), where they exceed 1,500 mm (60 in), but at the foot of the Himalayas, some areas are among the rainiest in the world. In contrast, the northwest is arid, and in western Rajasthan, rainfall is below 300 mm (12 in) per year. In the central-southern inland areas (see Hyderabad, Bangalore), rainfall is generally around 800/1,000 mm (32/40 in) per year.
The
hottest period generally runs from April to mid-June, i.e. before the arrival of the monsoon, when the temperature can reach 45 °C (113 °F) in inland areas.
Winter lasts from December to February. January and February are dry months in almost all of India, except in the far north, where it can also snow in the mountains. In winter, it can get cold at night in the northern lowlands, where the temperature can approach 0 °C (32 °F).
India can be affected by
tropical cyclones. They are more common in the Bay of Bengal than in the Arabian Sea, but they are also possible in the latter. Cyclones generally occur from
April to December, with two intensity peaks before and after the monsoon (in May and October-November). The area most at risk is the northern part of the Bay of Bengal
Index
Himalaya
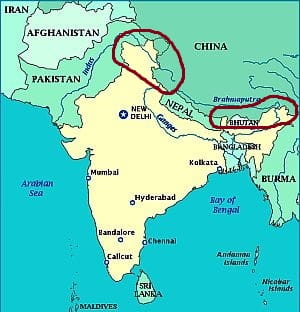
At the highest altitudes of the Himalayas, there is a
mountainous climate. The temperature decreases with altitude, in addition, it is higher along the southern slope and lower in inland areas and on the north-facing slopes.
On the slopes of the Himalayas, especially in the western part, in winter sometimes it rains.

In
Srinagar, 1,500 meters (5,000 feet) above sea level, in the state of Jammu and Kashmir, where it is said that the tomb of Jesus is located, the climate is slightly continental, and quite dry and sunny in autumn. The average temperature ranges from 2.5 °C (36.5 °F) in January to 24.5 °C (76 °F) in July.
The monsoon at this latitude is not constant, so the summer is quite sunny. In winter, it can rain, and frosts and snowfalls are possible. Spring is the rainiest season, but without the excesses of the monsoon areas. The rains in winter and spring are due to weather fronts of Mediterranean origin, which can affect this part of the north-western Indian territory.
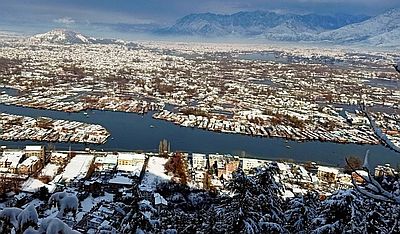
Above 3,000 meters (9,800 feet), winter in
Kashmir gets cold, and it is snowy along the western slopes: in Drass, at 3,000 meters (9,800 ft), it can snow in winter, while summer is dry. On the contrary, in inland areas, the climate is
desert, in particular, in the north-west, where we find the
Ladakh Plateau, which is arid because it's closed between the Karakoram and the Himalayas (see
Leh). Here in winter the temperature can drop to -25 °C (-13 °F).
While Jammu and Kashmir is quite sheltered from the summer monsoon, this does not apply to the mountains that lie to the east, ie west of Nepal (see the states of Himachal Pradesh and Uttarakhand), and even less to those that lie in the north-east (which at high altitudes are almost all situated in Sikkim and Arunachal Pradesh).
In
Gangtok, Sikkim, at 1,600 meters (5,200 feet) of altitude, the average temperature ranges from 9 °C (48 °F) in January to 20 °C (68 °F) in July and August. The winter is milder than in Srinagar, which is located further to the north, but in summer it is cooler because the monsoon rains occur almost daily, and the amount of sunshine in this season is poor. Already in May, 525 mm (20.7 in) of rain fall, and in July, up to 630 mm (24.8 in). Total annual rainfall is up to 3,535 mm (139 in). The only period when there is little rain goes from November to January.
In
Darjeeling, West Bengal, 2,100 meters (6,900 ft) above sea level, where the British colonists used to spend the summer in order to escape the heat, the average ranges from 6.5 °C (44 °F) in January to 16.5 °C (62 °F) in August. Hence, the British found a cool summer like in England, though much rainy; in fact, more than 400 mm (16 in) fall per month from June to September, and the rains occur almost daily. On the contrary, winter is quite cold, but it's also dry and sunny.
Eternal snows in India start around at 4,500 meters (14,800 ft) on average, though they are found a bit lower in Karakorum, which lies more to the north, and a bit higher in the Himalayas.
Indo-Gangetic plain
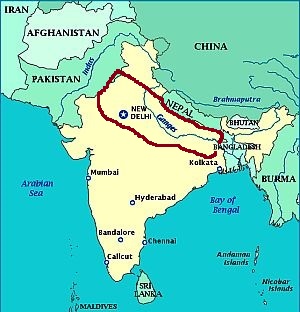
In the Indo-Gangetic plain, the vast plain south of the Himalayas, excluding the eastern area on the Bay of Bengal, the climate is
subtropical. Winter is cool enough, given that the average temperatures of January is between 11 °C (52 °F) in the northernmost part (see
Amritsar) and 15 °C (59 °F) in the south-eastern part (see Lucknow, Patna). From November to February,
fog can form at night and in the early morning. Also, sometimes at night it can get cold, and the temperature can drop to about 0 °C (32 °F).
This is a very
polluted area, especially from October to February.
From mid-March to June, before the arrival of the monsoon, there is a
very hot and dry period, in which the increasing heat can trigger lightning storms and wind. In the hottest periods, the temperature can reach or exceed 45 °C (113 °F).
During the
summer monsoon, which begins in mid-June in the south-eastern part and in early July in the north-western part, the temperature decreases and the humidity increases. There are rainy periods, in which the rains can be abundant (especially in the south-east and at the foot of the Himalayas), but also dry periods, in which it can be very hot. Annual rainfall ranges from approximately 600 millimeters (23 inches) in the northwest to 1,300 mm (51 in) in the southeast.
The monsoon retreats around September 20 in the north-west and around October 10 in the south-east.
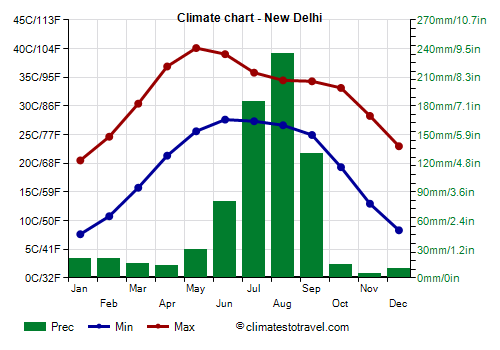
The capital of India,
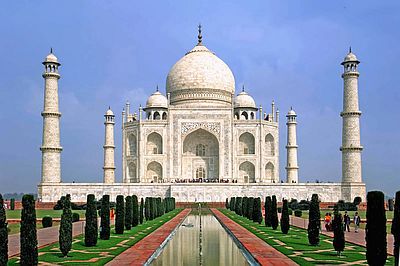
New Delhi, is located in this area. Winter is mild, but sometimes it can get a bit cold and fog can form.
The hottest months are May and June, before the monsoon. New Delhi receives 760 mm (30 in) of rain per year, the majority of which occurs from July to September.
In
Agra, located southeast of New Delhi, temperatures are slightly warmer, while the amount of rain that falls is about the same.
Further to the east, but also in a thin northern swathe located at the foot the Himalayas, the rains are more abundant, ranging between 800 and 1,400 mm (31 and 55 in) per year, in cities like
Lucknow,
Kanpur,
Varanasi, but otherwise the climate is similar to that of New Delhi.
Nevertheless, in the far north, in
Jammu, at the foot of the Himalayas, some disturbances of Mediterranean origin can pass in winter and spring (as we have already seen, they affect also the mountainous area of Srinagar); in fact, 33 mm (1.3 in) of rain fall in December, and as many as 80 mm (3 in) per month in February and March. From December to February, in Jammu, which is one of the northernmost cities at sea level, sometimes the night temperature may hit freezing (0 °C or 32 °F) or even drop a few degrees below.
Arid Northwest
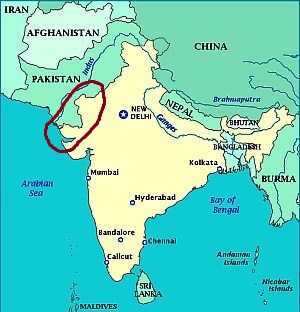
In the
north-west of India, near the border with Pakistan, we find a vast arid area, which covers the western part of the states of
Rajasthan and
Gujarat, to the west of the Aravalli Mountains. This area receives the monsoon rains for a short period, from late June or early July to mid-September, and with moderate rains.
Thar desert
Total annual rainfall is lower than 400 mm (16 in), but it is usually higher than 250 mm (10 in), which is considered as the limit of the desert climate, except in the far west, where we find the
Thar desert. However, the rains are concentrated in such a short period of time that the vegetation survival is difficult, except for some shrubs or xerophile plants.
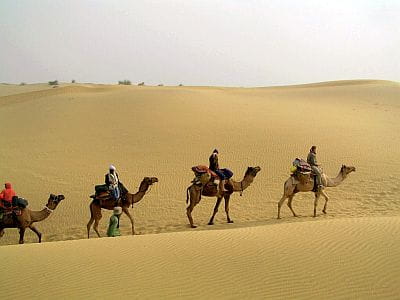
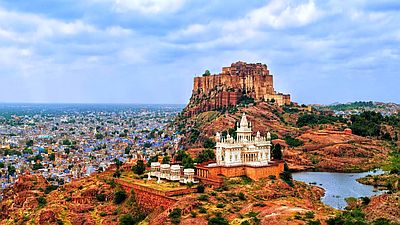
Even in the Thar desert, however, here and there we find a bit of vegetation, albeit in a landscape made of sand dunes. In this area, there are cities such as
Bikaner,
Jaisalmer and
Jodhpur. Sometimes there can be sandstorms, especially from March to June.
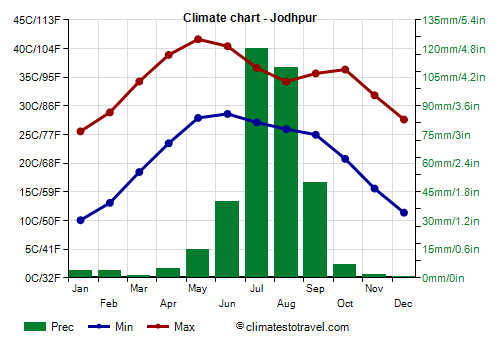
From April to June, before the monsoon, during the hottest days, the temperature can reach as high 47/48 °C (117/118 °F) in the shade. During the heatwave of May 2016, Phalodi recorded India's heat record with 51 °C (124 °F).
The best time to visit this area is from December to February, but if you can only travel in summer and you still want to visit India, you may choose this area, since it is the one where the monsoon has the lowest impact, together with the mountains of Kashmir.
It should be noted, however, that the monsoon is
irregular, and in particular, north-western India (along with Pakistan) is more rainy than normal in the years of
La Niña, when it can experience flooding, while during other years, the whole area can remain almost completely dry (in the years of
El Niño, all of India can experience warmer winters than normal, and weaker summer monsoons, though this does not always happen).
To the east of this northwestern area, we find an area in which the climate is
semi-arid, since the annual rainfall is between 400 and 800 mm (16 to 31.5 in). Under other circumstances, this would not be a low amount, but if we consider both the high temperatures and the fact that the rains are concentrated in a few months, the vegetation that occupies this area is certainly not lush. Nevertheless, in the monsoon season, there may be heavy rains.
The capital of Rajasthan,
Jaipur, is located east of the Aravalli Mountains, where, as we said, it rains more than in the desert area: here, 565 mm (22.2 in) of rain fall per year, with a maximum of 190 mm (7.5 in) in August.
North-east
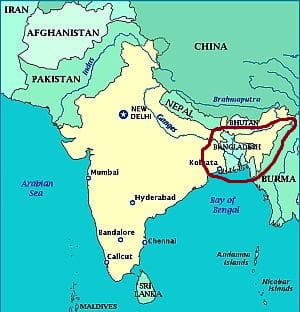
In north-eastern India,
the climate more humid, and not as hot as in the rest of the northern areas analyzed above.
Here too, winter is dry, and it is very mild, with average temperatures in January slightly below 20 °C (68 °F). However, the strong increase in temperature from March to May, is only relatively felt in the area located west of Bangladesh, and is almost absent to the east and the north, which are outside of the Indian landmass.
The
monsoon rains are abundant and sometimes torrential, and in any case, the total annual rainfall exceeds 1,400 mm (55 in). The monsoon period is quite long, in fact it runs from early June to early October, and it's often preceded, in April and sometimes even in March, by some
thunderstorms in the afternoon, especially at the foot of the mountains.
West of Bangladesh, in West Bengal, we find
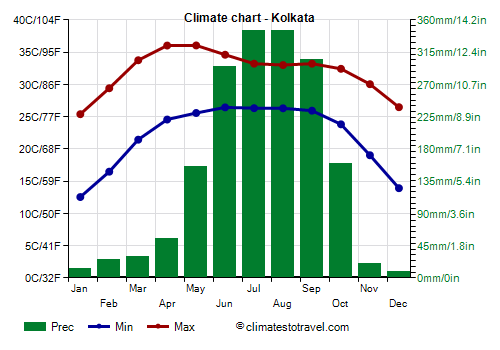
Kolkata (Calcutta), which is at the limit of this area, in fact the average in January is around 19 °C (66 °F). Winter is pleasantly warm, also because of the proximity to the sea. The increase in temperature from March to June is evident, although it's not as strong as in New Delhi, nevertheless, the temperature can exceed 40 °C (104 °F) in the worst moments.
The monsoon goes roughly from June 5 to October 15, but already in May, the first showers in the afternoon may occur. Total annual rainfall is 1,750 mm (69 in). From November to April, the sun shines and it almost never rains.
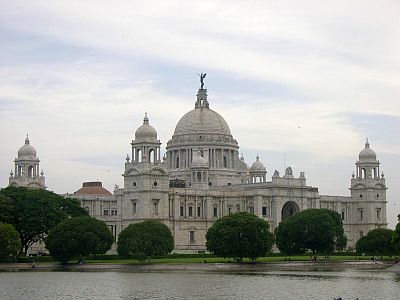
In the rest of the north-east, the rains are generally more abundant, except in some areas a bit more sheltered such as
Guwahati, in the Brahmaputra Valley, where it rains as much as in Kolkata.
In general, however, precipitation exceeds 2,000 mm (79 in) per year, and in some areas, where humid air masses are forced to rise on the mountain slopes, it reaches spectacular amounts.
Cherrapunji, 1,300 meters (4,250 feet) above sea level, in the northeastern state of Meghalaya, is the rainiest place in the world, and receives
11,100 mm (more than 11 meters! or 36 feet) of rain per year. At this altitude, the temperature is pleasant, in fact, highs are around 23/24 °C (73/75 °F) from May to October, while in winter they are around 17/19 °C (63/66 °F).
As already mentioned, in spring, the extreme north-east (Meghalaya, Assam etc.) does not become too hot; in fact, at sea level, the maximum temperatures remain around 30/32 °C (86/90 °F) from April to October.
Center-South
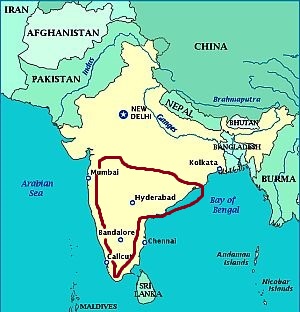
Central-southern India is occupied in the interior by a plateau, the
Deccan, where the altitude tempers the climate. For the lower latitude, however,
winter is warmer than in the Indo-Gangetic plain.
To the west we find the
Western Ghats, a mountain range parallel to the coast, while to the east we find the Eastern Ghats.
In this area, which includes the whole of south-central India except the western coast, the Western Ghats and the southeast, the climate is
tropical, since the average temperature in January exceeds 20 °C (68 °F). The summer monsoon is
partially blocked by the Western Ghats, so from June to September the rains are moderate.
Around mid-October, the
northeast monsoon (or retreating monsoon) begins to blow, which unlike in the rest of India, here brings rainfall between October and December, though than in the southeast (see below).
Also in this area, the hottest period is from March to May, before the monsoon. In general, in the central-southern inland areas, the summer rains are not more abundant than in northern India, but they are more frequent, and in this season the sky is often cloudy. Some cities in the central plateau of India are
Nagpur,
Pune and Hyderabad.
In
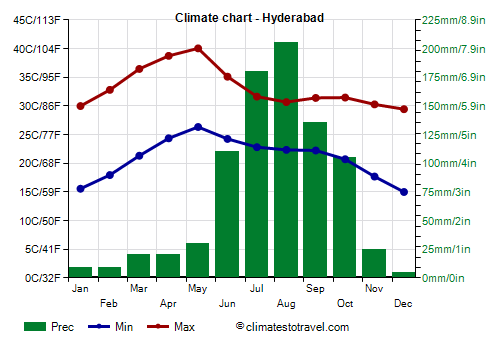
Hyderabad, the state capital of Telangana, located at 550 meters (1,800 ft) above sea level, the average maximum temperature is 29/30 °C (84/86 °F) even in the coolest period, from November to January. Rainfall amounts to 855 mm (33.6 in), including more than 100 mm (4 in) per month from June to October, so we are still in a semi-arid zone.
Going further south, in
Anantapur, in Andhra Pradesh, the temperature starts to rise even earlier, in fact, the maximum temperature rises to 34.5 °C (94 °F) already in February.
In addition, in May, there's some thunderstorm activity that precedes the monsoon itself. However, the monsoon is considerably weak in the early months, although high humidity and cloudy skies make it clear that we are in the monsoon period. The monsoon becomes more intense in September and October, which are the wettest months.
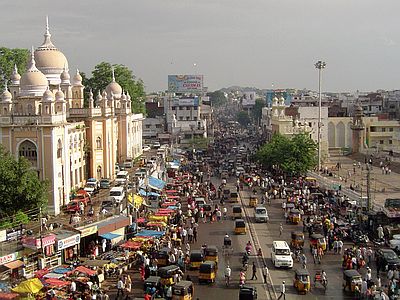
In
Bangalore, in southern Karnataka, it is not as hot as in Hyderabad, also because the altitude is higher, that is, 920 meters (3,000 feet) above sea level. In May, already 115 mm (4.5 in) of rain fall, then the monsoon season is from June to mid-November. The rainfall amounts to 920 mm (36 in) per year.
During the empire, the British who were in this area, in summer took refuge in
Ootacamund (Aka Ooty or Uthagamandalam), located at 2,200 meters (7,200 ft) above sea level.
South-east
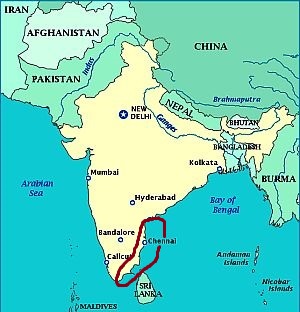
In the south-east, affected by the
north-east monsoon or "retreating monsoon", the rainiest period goes from September to November in inland areas (see
Madurai,
Tiruchirappalli), and from October to December on the coast (see Chennai,
Puducherry).
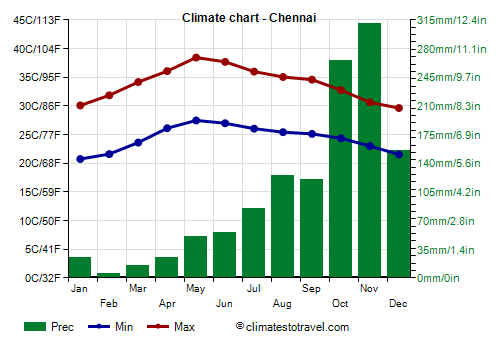
In
Chennai (formerly Madras), the retreating monsoon is pronounced as well, since precipitation is about 265 mm (10.4 in) in October, 310 mm (12.2 in) in November, and still 155 mm (6.1 in) in December.
Even though Chennai is located on the coast, the heat is intense in the months preceding the monsoon.
The Bay of Bengal, at this latitude, is warm all year round.
Further to the south, the southern part of the Coromandel coast, the one facing south-east and beyond which lies Sri Lanka (see Kanyakumari, Rameswaram, Thoothukudi), is quite arid, since it receives 700 to 900 mm (27 to 35 in) of rain per year, and above all it receives little rain from July to September.
It's the case of
Kanyakumari, at the southern tip of the country, in the state of Tamil Nadu, where it's hot throughout the year, since the average maximum never drops below 30 °C (86 °F), while the rains, after an initial period of instability from April to June, with some thunderstorms not too intense, experience a relative break from July to September, while the real monsoon arrives later and is limited to the months of October and November (and during some years also December).
South-west and islands
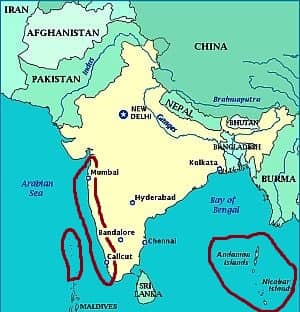
Along the west coast and on the islands (see the Lakshadweep or Laccadive Islands in the Arabian Sea, and the Andaman and Nicobar Islands in the Bay of Bengal), the climate is
hot and humid throughout the year, with heavy rains for a few months, and a dry season in winter and spring, which is longer in the northern part.
West coast
Along the
west coast it's hot throughout the year, while the monsoon period is gradually longer as you proceed from north to south. During winter, temperatures are particularly high for the season because the north-easterly wind that blows in this season (winter monsoon) descends from the Western Ghats and become slightly warmer, with a foehn-like effect.
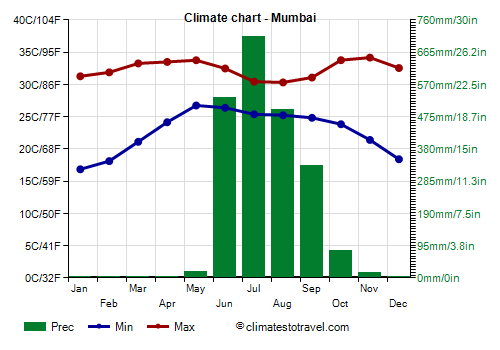
In
Mumbai (formerly Bombay), the temperature exceeds 30 °C (86 °F) during the day even in January; however, at night it drops, albeit slightly, below 20 °C (68 °F). From November to May, the rains are scarce and sunshine is frequent. From March to May, the temperature increases, but not as much as in the interior: the minimum at night goes up to 27 °C (80.5 °F), and the maximum reaches around 34 °C (93 °F), even though it can reach 40 °C (104 °F) in the worst moments.
The monsoon lasts from June to early October and is very intense, especially in July, when 710 mm (28 in) of rain fall, and it rains very often. In July and August, the sky is almost always cloudy and the humidity high. In Mumbai, about 2,200 mm (86 in) of rain fall per year.
The Arabian Sea is warm enough for swimming all year round.
Continuing south along the coast, the climate is even more rainy.
In Dabolim, in the former Portuguese colony of
Goa, precipitation reaches 2,900 mm (114 in) per year, including up to 995 mm (39 in) in July. The temperature is high throughout the year, and it remains about 20 °C (68 °F) at night even in winter. The sea temperature is also steadily high throughout the year, and in winter, it's a bit warmer than in Mumbai.
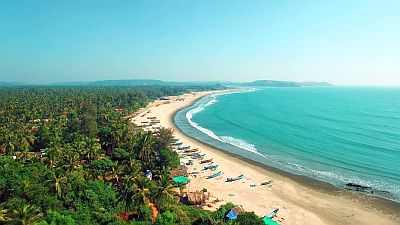
Further south, in
Mangalore, Karnataka, where the Malabar Coast begins, the maximum temperature is 33 °C (91 °F) even in January, and precipitation reaches 3,300 mm (130 in) per year. Here, the first thunderstorms occur in May, while the monsoon runs from June 5 to October 15 or so.
Further south, in
Kozhikode (Calicut), Kerala, the first thunderstorms occur in April, while the monsoon lasts until November, when 120 mm (4.7 in) of rain still fall.
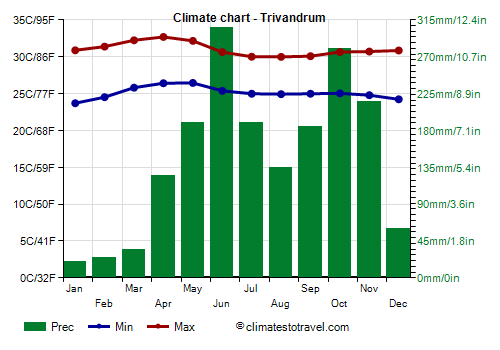
In
Trivandrum, at the southern tip of Kerala, the rains are less abundant, amounting to 1,700 mm (67 in) per year, but the rainy season is very long: as early as in April, 125 mm (4.9 in) of rain fall in the form of showers and thunderstorms, and 215 mm (8.6 in) still in November. Therefore, in this southernmost part of the west coast, the retreating monsoon is partly felt as well.
The west coast is very rainy because of a mountain range parallel to the coast called
Western Ghats, which forces the ascent of moist air coming from the sea. Along the western mountain slopes, rainfall is more abundant, so much so that in some places it even reaches six meters (20 feet) per year! The scenario is very different on the eastern side, where the south-west monsoon penetrates with difficulty, and as we said, the rainfall drops below 1,000 mm (40 in) per year.
Islands
We now turn to the
islands. Here, the climate is hot all year round, with lows around 24/25 °C (75/77 °F) and highs around 30 °C (86 °F). Here too, there is an increase in temperature between March and May, when highs reach an average of 32 °C (89.5 °F), but it's not remarkable.
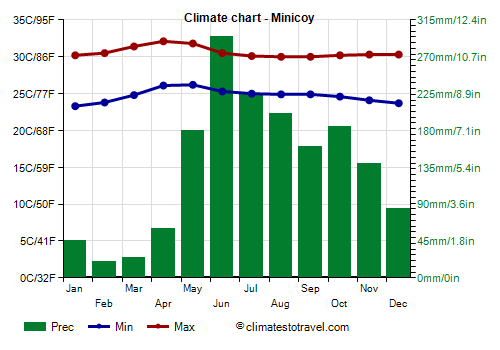
In the
Lakshadweep Islands, located in the Arabian Sea, from 1,500 to 2,000 mm (60 to 79 in) of rain fall per year, and the rains occur from May to mid-December.
Since the temperature slightly increases by March, the best time on these islands is from late December to February.
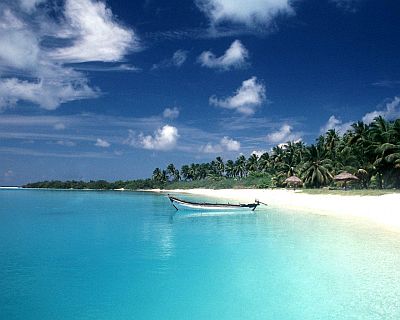
On the
Andaman and Nicobar Islands, located in the Bay of Bengal, the rains are a bit heavier, since they range from 2,500 to 3,000 mm (98 to 118 in) per year. The rains are abundant from May to November. In Car Nicobar and on the southern islands, the rains continue even in December and mid-January, while they end earlier in Port Blair and in the northernmost regions.
So, you can go from late January to March on the southern islands, and from late December to March on the northern ones.
When to go
Since in India there are different types of climate, it is difficult to find a single period that fits for all of the country. Nevertheless, the best time to visit most of India, at least in the lowlands, is winter, from
November to February. It must be said that in the Indo-Gangetic plain (see New Delhi) it can get cold at night, moreover, fog can form, and the air is often very polluted. March is still a dry month, but it begins to be hot, with peaks that during the month can exceed 35 °C (95 °F) in the south.
On the south-east coast and the southern islands, the rains continue until December; moreover, cyclones in this month are still possible, so you can go in January and February.
If you can only travel in
summer, from June to August, you can choose the northwest and the south-east. In Rajasthan, the monsoon is less intense; you will find hot and muggy weather and some downpours, usually not abundant (at least in the western part). In summer, you can also visit Ladakh, because it is located in a "rain shadow" area. A very different situation is found on the eastern part of the Himalayas, which is affected by the summer monsoon in full strength.
Also in the south-east, in Tamil Nadu (see Chennai), and in the interior of Karnataka (see Bangalore), the summer monsoon is not particularly intense, while the rains increase starting from September.
As mentioned, the
sea in India is warm enough for swimming all year round. For a beach holiday, the west coast (see Goa) is good from December to February, and the eastern coast only in January and February.
What to pack
In
winter: in the far north at low altitude (see Jammu, Amritsar) and in the southern mountainous areas (see Ootacamund), bring spring/autumn clothes, and a sweater and a warm jacket for the evening.
In the north (see New Delhi, Jaipur, Varanasi, Patna), bring spring/autumn clothes (light for the day), a jacket and a sweater for the evening, and possibly a hat and a scarf for cooler evenings.
In the center and in inland south-central areas (Calcutta, Hyderabad), bring light clothes for the day, and a sweater and a light jacket for the evening.
On the south-central coast (Mumbai, Goa, Trivandrum, Chennai, Pondicherry), bring light clothing, a scarf for the breeze, and a light sweatshirt for the evening; on the south-east coast (Chennai, Pondicherry), a light raincoat or umbrella still in December.
On the islands (Lakshadweep, Andaman and Nicobar Islands), light clothing, a scarf for the breeze, a light sweatshirt for the evening, and a light raincoat or umbrella until December or mid-January.
When going to the reef, you can bring snorkeling equipment, including water shoes or rubber-soled shoes.
In the Himalayas: around 1,500/2,000 meters (5,000/6,500 feet, see Srinagar, Darjeeling), pack warm clothes, a jacket, a hat, and a scarf. Above 2,000 meters (6,500 feet), warm winter clothes, hiking boots, sunglasses, and sunscreen. At the highest altitudes, cold weather clothing, synthetic, thermal long underwear, gloves, a down jacket, a hat, and a scarf.
In
summer: in all areas at low altitude, bring tropics-friendly, loose-fitting clothing, made of natural fibers, a light raincoat or umbrella, a light sweatshirt and a scarf for air conditioned places; a desert turban in the north-west; a scarf for the breeze on the coast, and a light sweatshirt for the evening at low-mountain elevations (see Bangalore).
In the southern mountains (see Ootacamund), spring/autumn clothes, a raincoat, a sweater, and a jacket.
In the Himalayas: around 2,000 meters (6,500 feet, see Darjeeling), spring/autumn clothes, a raincoat, a jacket, and a sweater. At the highest altitudes, a warm jacket, a down jacket, a hat, gloves, and a scarf.
When visiting temples, it is customary to remove shoes, dress neatly and cover a little.
In rural areas, closed-toe shoes may be useful against snakes.
Climate data - India
| Bangalore (920 meters) |
|---|
Bangalore, location on the map |
|---|
| Jan | Feb | Mar | Apr | May | Jun | Jul | Aug | Sep | Oct | Nov | Dec |
|---|
| Min temp. | 16 | 18 | 20 | 22 | 22 | 20 | 20 | 20 | 20 | 20 | 18 | 16 |
|---|
| Max temp. | 28 | 31 | 33 | 34 | 33 | 30 | 28 | 28 | 29 | 28 | 27 | 26 |
|---|
| Precip. | 0 | 5 | 20 | 40 | 105 | 105 | 115 | 145 | 215 | 170 | 50 | 15 |
|---|
| Prec. days | 0 | 0 | 1 | 3 | 7 | 6 | 7 | 10 | 10 | 8 | 4 | 1 |
|---|
| Humidity | 60% | 52% | 48% | 53% | 62% | 73% | 76% | 78% | 75% | 74% | 70% | 67% |
|---|
| Day length | 12 | 12 | 12 | 12 | 13 | 13 | 13 | 12 | 12 | 12 | 12 | 11 |
|---|
| Sun hours | 8 | 9 | 9 | 9 | 8 | 5 | 4 | 4 | 5 | 6 | 6 | 7 |
|---|
|
| Chennai |
|---|
Chennai, location on the map |
|---|
| Jan | Feb | Mar | Apr | May | Jun | Jul | Aug | Sep | Oct | Nov | Dec |
|---|
| Min temp. | 21 | 22 | 24 | 26 | 27 | 27 | 26 | 25 | 25 | 24 | 23 | 22 |
|---|
| Max temp. | 30 | 32 | 34 | 36 | 38 | 38 | 36 | 35 | 35 | 33 | 31 | 30 |
|---|
| Precip. | 25 | 5 | 15 | 25 | 50 | 55 | 85 | 125 | 120 | 265 | 310 | 155 |
|---|
| Prec. days | 3 | 1 | 1 | 2 | 4 | 11 | 16 | 18 | 15 | 16 | 16 | 10 |
|---|
| Humidity | 74% | 72% | 70% | 71% | 65% | 61% | 65% | 69% | 73% | 79% | 81% | 78% |
|---|
| Day length | 12 | 12 | 12 | 12 | 13 | 13 | 13 | 12 | 12 | 12 | 12 | 11 |
|---|
| Sun hours | 8 | 9 | 9 | 10 | 10 | 8 | 5 | 6 | 6 | 8 | 9 | 7 |
|---|
| Sea temp | 26 | 27 | 28 | 30 | 30 | 30 | 29 | 29 | 29 | 29 | 28 | 27 |
|---|
| Gangtok (1,400 meters) |
|---|
Gangtok, location on the map |
|---|
| Jan | Feb | Mar | Apr | May | Jun | Jul | Aug | Sep | Oct | Nov | Dec |
|---|
| Min temp. | 6 | 8 | 10 | 13 | 15 | 17 | 18 | 18 | 17 | 14 | 11 | 8 |
|---|
| Max temp. | 13 | 14 | 17 | 20 | 21 | 22 | 22 | 22 | 22 | 20 | 18 | 14 |
|---|
| Precip. | 25 | 70 | 125 | 295 | 495 | 610 | 625 | 565 | 440 | 175 | 40 | 20 |
|---|
| Prec. days | 2 | 6 | 8 | 13 | 19 | 22 | 23 | 22 | 18 | 13 | 4 | 2 |
|---|
|
| Day length | 10 | 11 | 12 | 13 | 14 | 14 | 14 | 13 | 12 | 11 | 11 | 10 |
|---|
| Sun hours | 8 | 7 | 8 | 8 | 7 | 6 | 4 | 5 | 5 | 7 | 8 | 7 |
|---|
|
| Hyderabad (550 meters) |
|---|
Hyderabad, location on the map |
|---|
| Jan | Feb | Mar | Apr | May | Jun | Jul | Aug | Sep | Oct | Nov | Dec |
|---|
| Min temp. | 16 | 18 | 21 | 24 | 26 | 24 | 23 | 22 | 22 | 21 | 18 | 15 |
|---|
| Max temp. | 30 | 33 | 36 | 39 | 40 | 35 | 32 | 31 | 31 | 31 | 30 | 29 |
|---|
| Precip. | 10 | 10 | 20 | 20 | 30 | 110 | 180 | 205 | 135 | 105 | 25 | 5 |
|---|
| Prec. days | 1 | 0 | 1 | 2 | 2 | 7 | 10 | 12 | 8 | 6 | 2 | 0 |
|---|
| Humidity | 54% | 46% | 41% | 41% | 39% | 60% | 72% | 76% | 75% | 67% | 61% | 57% |
|---|
| Day length | 11 | 12 | 12 | 13 | 13 | 13 | 13 | 13 | 12 | 12 | 11 | 11 |
|---|
| Sun hours | 9 | 9 | 9 | 9 | 9 | 6 | 4 | 4 | 5 | 7 | 8 | 8 |
|---|
|
| Jodhpur (280 meters) |
|---|
Jodhpur, location on the map |
|---|
| Jan | Feb | Mar | Apr | May | Jun | Jul | Aug | Sep | Oct | Nov | Dec |
|---|
| Min temp. | 10 | 13 | 18 | 23 | 28 | 29 | 27 | 26 | 25 | 21 | 16 | 11 |
|---|
| Max temp. | 26 | 29 | 34 | 39 | 42 | 40 | 37 | 34 | 36 | 36 | 32 | 28 |
|---|
| Precip. | 5 | 5 | 0 | 5 | 15 | 40 | 120 | 110 | 50 | 5 | 0 | 0 |
|---|
| Prec. days | 0 | 1 | 0 | 1 | 1 | 2 | 6 | 6 | 3 | 1 | 0 | 0 |
|---|
| Humidity | 43% | 37% | 30% | 27% | 32% | 46% | 64% | 71% | 60% | 41% | 41% | 43% |
|---|
| Day length | 11 | 11 | 12 | 13 | 14 | 14 | 14 | 13 | 12 | 12 | 11 | 10 |
|---|
| Sun hours | 10 | 10 | 9 | 9 | 9 | 4 | 3 | 4 | 6 | 8 | 9 | 10 |
|---|
|
| Kolkata |
|---|
Kolkata, location on the map |
|---|
| Jan | Feb | Mar | Apr | May | Jun | Jul | Aug | Sep | Oct | Nov | Dec |
|---|
| Min temp. | 13 | 16 | 21 | 25 | 26 | 26 | 26 | 26 | 26 | 24 | 19 | 14 |
|---|
| Max temp. | 25 | 29 | 34 | 36 | 36 | 35 | 33 | 33 | 33 | 32 | 30 | 26 |
|---|
| Precip. | 10 | 25 | 30 | 55 | 155 | 295 | 345 | 345 | 305 | 160 | 20 | 10 |
|---|
| Prec. days | 1 | 2 | 2 | 4 | 7 | 13 | 17 | 17 | 13 | 7 | 1 | 0 |
|---|
| Humidity | 69% | 64% | 61% | 68% | 73% | 80% | 83% | 84% | 83% | 78% | 71% | 71% |
|---|
| Day length | 11 | 11 | 12 | 13 | 13 | 14 | 13 | 13 | 12 | 12 | 11 | 11 |
|---|
| Sun hours | 7 | 8 | 7 | 8 | 8 | 4 | 3 | 4 | 4 | 6 | 7 | 7 |
|---|
| Sea temp | 23 | 24 | 26 | 28 | 29 | 30 | 29 | 29 | 29 | 29 | 27 | 25 |
|---|
| Minicoy |
|---|
Minicoy, location on the map |
|---|
| Jan | Feb | Mar | Apr | May | Jun | Jul | Aug | Sep | Oct | Nov | Dec |
|---|
| Min temp. | 23 | 24 | 25 | 26 | 26 | 25 | 25 | 25 | 25 | 25 | 24 | 24 |
|---|
| Max temp. | 30 | 30 | 31 | 32 | 32 | 30 | 30 | 30 | 30 | 30 | 30 | 30 |
|---|
| Precip. | 45 | 20 | 25 | 60 | 180 | 295 | 225 | 200 | 160 | 185 | 140 | 85 |
|---|
| Prec. days | 4 | 2 | 2 | 5 | 11 | 20 | 17 | 15 | 13 | 13 | 9 | 5 |
|---|
|
| Day length | 12 | 12 | 12 | 12 | 12 | 13 | 12 | 12 | 12 | 12 | 12 | 12 |
|---|
| Sun hours | 7 | 7 | 7 | 7 | 6 | 5 | 5 | 5 | 6 | 6 | 6 | 7 |
|---|
| Sea temp | 28 | 28 | 29 | 30 | 30 | 29 | 28 | 28 | 28 | 29 | 29 | 29 |
|---|
| Mumbai |
|---|
Mumbai, location on the map |
|---|
| Jan | Feb | Mar | Apr | May | Jun | Jul | Aug | Sep | Oct | Nov | Dec |
|---|
| Min temp. | 17 | 18 | 21 | 24 | 27 | 26 | 25 | 25 | 25 | 24 | 21 | 18 |
|---|
| Max temp. | 31 | 32 | 33 | 33 | 34 | 32 | 30 | 30 | 31 | 34 | 34 | 33 |
|---|
| Precip. | 0 | 0 | 0 | 0 | 20 | 530 | 710 | 495 | 330 | 80 | 15 | 5 |
|---|
| Prec. days | 0 | 0 | 0 | 0 | 1 | 14 | 21 | 20 | 13 | 3 | 0 | 0 |
|---|
| Humidity | 55% | 55% | 58% | 66% | 69% | 77% | 83% | 82% | 80% | 67% | 56% | 55% |
|---|
| Day length | 11 | 12 | 12 | 13 | 13 | 13 | 13 | 13 | 12 | 12 | 11 | 11 |
|---|
| Sun hours | 9 | 10 | 9 | 9 | 9 | 5 | 3 | 2 | 5 | 8 | 9 | 9 |
|---|
| Sea temp | 25 | 25 | 26 | 28 | 29 | 30 | 29 | 28 | 28 | 29 | 28 | 26 |
|---|
| New Delhi |
|---|
New Delhi, location on the map |
|---|
| Jan | Feb | Mar | Apr | May | Jun | Jul | Aug | Sep | Oct | Nov | Dec |
|---|
| Min temp. | 8 | 11 | 16 | 21 | 26 | 28 | 27 | 27 | 25 | 19 | 13 | 8 |
|---|
| Max temp. | 20 | 25 | 30 | 37 | 40 | 39 | 36 | 34 | 34 | 33 | 28 | 23 |
|---|
| Precip. | 20 | 20 | 15 | 15 | 30 | 80 | 185 | 235 | 130 | 15 | 5 | 10 |
|---|
| Prec. days | 2 | 3 | 3 | 3 | 4 | 6 | 12 | 13 | 7 | 2 | 1 | 1 |
|---|
| Humidity | 73% | 64% | 54% | 39% | 40% | 54% | 72% | 76% | 71% | 62% | 65% | 70% |
|---|
| Day length | 11 | 11 | 12 | 13 | 14 | 14 | 14 | 13 | 12 | 11 | 11 | 10 |
|---|
| Sun hours | 7 | 8 | 8 | 9 | 9 | 7 | 6 | 6 | 7 | 8 | 8 | 7 |
|---|
|
| Port Blair |
|---|
Port Blair, location on the map |
|---|
| Jan | Feb | Mar | Apr | May | Jun | Jul | Aug | Sep | Oct | Nov | Dec |
|---|
| Min temp. | 23 | 23 | 24 | 25 | 25 | 25 | 24 | 24 | 24 | 24 | 25 | 24 |
|---|
| Max temp. | 30 | 31 | 32 | 32 | 31 | 30 | 30 | 29 | 29 | 30 | 30 | 30 |
|---|
| Precip. | 35 | 20 | 10 | 70 | 345 | 455 | 400 | 425 | 405 | 295 | 255 | 155 |
|---|
| Prec. days | 3 | 2 | 1 | 4 | 19 | 23 | 22 | 23 | 20 | 18 | 15 | 6 |
|---|
| Humidity | 76% | 75% | 76% | 77% | 84% | 87% | 87% | 88% | 89% | 87% | 82% | 77% |
|---|
| Day length | 12 | 12 | 12 | 12 | 13 | 13 | 13 | 12 | 12 | 12 | 12 | 12 |
|---|
| Sun hours | 9 | 9 | 9 | 8 | 5 | 3 | 4 | 3 | 4 | 5 | 6 | 8 |
|---|
| Sea temp | 28 | 28 | 29 | 30 | 30 | 29 | 29 | 28 | 28 | 29 | 29 | 28 |
|---|
| Srinagar (1,600 meters) |
|---|
Srinagar, location on the map |
|---|
| Jan | Feb | Mar | Apr | May | Jun | Jul | Aug | Sep | Oct | Nov | Dec |
|---|
| Min temp. | -2 | 0 | 4 | 8 | 11 | 15 | 18 | 17 | 13 | 6 | 1 | -2 |
|---|
| Max temp. | 8 | 11 | 17 | 21 | 26 | 29 | 30 | 30 | 28 | 23 | 16 | 10 |
|---|
| Precip. | 75 | 70 | 105 | 80 | 65 | 35 | 60 | 65 | 30 | 30 | 20 | 35 |
|---|
| Prec. days | 8 | 7 | 10 | 10 | 7 | 5 | 7 | 7 | 4 | 4 | 2 | 5 |
|---|
| Humidity | 80% | 75% | 67% | 60% | 60% | 57% | 64% | 67% | 64% | 66% | 74% | 80% |
|---|
| Day length | 10 | 11 | 12 | 13 | 14 | 14 | 14 | 13 | 12 | 11 | 10 | 10 |
|---|
| Sun hours | 2 | 4 | 4 | 6 | 8 | 8 | 8 | 7 | 8 | 7 | 6 | 4 |
|---|
|
| Trivandrum |
|---|
Trivandrum, location on the map |
|---|
| Jan | Feb | Mar | Apr | May | Jun | Jul | Aug | Sep | Oct | Nov | Dec |
|---|
| Min temp. | 24 | 25 | 26 | 26 | 26 | 25 | 25 | 25 | 25 | 25 | 25 | 24 |
|---|
| Max temp. | 31 | 31 | 32 | 33 | 32 | 31 | 30 | 30 | 30 | 31 | 31 | 31 |
|---|
| Precip. | 20 | 25 | 35 | 125 | 190 | 305 | 190 | 135 | 185 | 280 | 215 | 60 |
|---|
| Prec. days | 2 | 2 | 4 | 8 | 13 | 17 | 14 | 12 | 12 | 16 | 13 | 6 |
|---|
| Humidity | 69% | 68% | 69% | 72% | 75% | 80% | 81% | 81% | 80% | 79% | 79% | 73% |
|---|
| Day length | 12 | 12 | 12 | 12 | 12 | 13 | 13 | 12 | 12 | 12 | 12 | 12 |
|---|
| Sun hours | 8 | 9 | 8 | 7 | 6 | 4 | 4 | 5 | 6 | 6 | 6 | 7 |
|---|
| Sea temp | 28 | 28 | 29 | 30 | 30 | 28 | 28 | 27 | 28 | 28 | 29 | 28 |
|---|
| Udhagamandalam (2,250 meters) |
|---|
Udhagamandalam, location on the map |
|---|
| Jan | Feb | Mar | Apr | May | Jun | Jul | Aug | Sep | Oct | Nov | Dec |
|---|
| Min temp. | 6 | 7 | 10 | 11 | 12 | 12 | 11 | 11 | 11 | 11 | 10 | 7 |
|---|
| Max temp. | 21 | 22 | 23 | 23 | 23 | 19 | 17 | 18 | 19 | 19 | 19 | 21 |
|---|
| Precip. | 20 | 10 | 25 | 75 | 150 | 135 | 180 | 125 | 135 | 190 | 140 | 55 |
|---|
| Prec. days | 1 | 1 | 2 | 5 | 8 | 8 | 10 | 9 | 9 | 11 | 7 | 4 |
|---|
|
| Day length | 12 | 12 | 12 | 12 | 13 | 13 | 13 | 12 | 12 | 12 | 12 | 12 |
|---|
| Sun hours | 9 | 9 | 9 | 8 | 7 | 4 | 4 | 4 | 5 | 6 | 6 | 7 |
|---|
|
See also the
temperatures month by month