Select units of measurement for the temperature and rainfall tables (metric or imperial).
Average weather, temperature, rainfall, sunshine hours

In Gangtok there is a
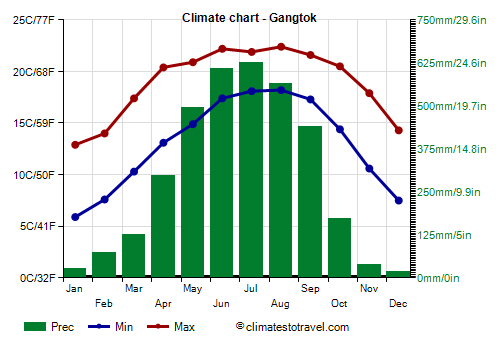
subtropical mountain climate, with a fairly cold winter from December to February, dry in the first part (December-January), and a long rainy season from March to mid-October, within which there is a very rainy period, marked by the monsoon, from May to September.
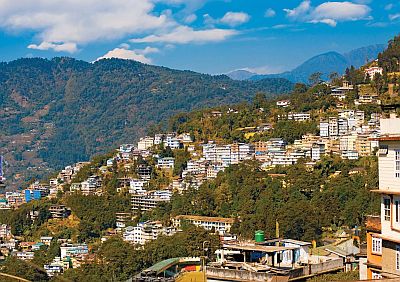
The small city is located in northeast India, at 27 degrees north latitude, and is the capital of the small mountainous state of
Sikkim, which lies between Nepal, China and Bhutan. Gangtok is located on a hill, the altitude of which varies from 1,300 to 1,800 meters (4,200 and 5,900 feet), with the center at 1,650 meters (5,400 ft).
About 55 km (35 mi) to the north-west, on the border with Nepal, is Mount
Kangchenjunga, the third highest mountain in the world with its 8,586 metres (28,169 ft).
 Fog
Fog can form all year round, but especially in the rainy season.
Winter is not too cold, however, sometimes there are cold days, with highs below 10 °C, sometimes just 5/6 degrees. Typically, the coldest period is from late December to early February. On colder nights, the temperature can drop to 1/2 degree, and occasionally lower. The record is -2 °C, recorded in January 1967.
Snow in Gangtok is very rare, both because the winter is dry and because temperatures almost always exceed freezing. Every now and then, light snowfall can be observed in the higher parts of the city. To find snow in Sikkim you need to climb in altitude, generally above 3,000 metres (9,800 feet), from late December to early March. The nearest place is lake Tsomgo, at 3,765 meters (12,350 ft). In the Himalayas, however, above 4,500 metres (14,750 ft), there is perpetual snow.
In
spring, from March to May, temperatures are mild, while
rain and thunderstorms gradually become more frequent. In April, highs reach 20 °C (68 °F). In April and May the rains are already frequent, and sometimes abundant. In May, 500 mm (20 in) of rain already fall, a very high value.
However, the actual
monsoon runs from the beginning of June to the beginning of October, with very frequent, almost daily rains, at times torrential. Sometimes the rains can cause landslides.
Summer is therefore cool and rainy. Since it rains often and the sun rarely shines, it is almost never hot in Gangtok. Typically, in the warmest days of the year, the temperature reach 27/28 °C (81/82 °F). The record is 29.9 °C (85.8 °F), set in August 1990.
In
autumn, the rains stop during the month of October. In October, it generally still rains in the first half, while the second half is dry, although it depends on the year. November is typically a mild and sunny month.
Every now and then, Sikkim and Gangtok can be affected by the remnants of
tropical cyclones, generally those coming from the Bay of Bengal, and more rarely from the Arabian Sea. Since they have to penetrate a long distance inland, they arrive weakened, however, when they encounter the mountains, they can bring heavy rains (and snowfalls in the high mountains).
Typically, cyclones occur from mid-April to early December, with a greater probability in May-June, and a secondary peak in October.
Best Time
The
best time to visit Gangtok is the dry season, from November to February. However, in winter, especially from mid-December to mid-February, it can sometimes be cold, furthermore, in February the rains already start to become more frequent.
November is therefore the best month, since it is mild and dry.
Gangtok - Climate data
In Gangtok, the
average temperature of the coldest month (January) is of
9.4 °C, that of the warmest month (August) is of
20.3 °C. Here are the average temperatures.
Gangtok - Average temperatures (2016-2023) |
| Month | Min | Max | Mean |
|---|
| January | 5.9 | 12.9 | 9.4 |
|---|
| February | 7.6 | 14 | 10.8 |
|---|
| March | 10.3 | 17.4 | 13.8 |
|---|
| April | 13.1 | 20.4 | 16.8 |
|---|
| May | 14.9 | 20.9 | 17.9 |
|---|
| June | 17.4 | 22.2 | 19.8 |
|---|
| July | 18.1 | 21.9 | 20 |
|---|
| August | 18.2 | 22.4 | 20.3 |
|---|
| September | 17.3 | 21.6 | 19.5 |
|---|
| October | 14.4 | 20.5 | 17.4 |
|---|
| November | 10.6 | 17.9 | 14.2 |
|---|
| December | 7.5 | 14.3 | 10.9 |
|---|
| Year | 13 | 18.9 | 15.9 |
|---|
amounts to
3490 millimeters per year: it is therefore very abundant. It ranges from
19.5 millimeters in the driest month (December) to
626.3 millimeters in the wettest one (July). Here is the average precipitation.
Gangtok - Average precipitation| Month | Days |
|---|
| January | 27 | 2 |
|---|
| February | 72 | 6 |
|---|
| March | 126 | 8 |
|---|
| April | 297 | 13 |
|---|
| May | 496 | 19 |
|---|
| June | 610 | 22 |
|---|
| July | 626 | 23 |
|---|
| August | 566 | 22 |
|---|
| September | 439 | 18 |
|---|
| October | 173 | 13 |
|---|
| November | 38 | 4 |
|---|
| December | 20 | 2 |
|---|
| Year | 3490 | 152 |
|---|
There are on average around 2445
sunshine hours per year. Here are the average hours of sunshine per day.
Gangtok - Sunshine hours| Month | Average | Total |
|---|
| January | 7.5 | 235 |
|---|
| February | 7.5 | 210 |
|---|
| March | 8 | 245 |
|---|
| April | 8.5 | 255 |
|---|
| May | 7 | 220 |
|---|
| June | 6 | 175 |
|---|
| July | 4.5 | 135 |
|---|
| August | 4.5 | 145 |
|---|
| September | 5 | 150 |
|---|
| October | 7 | 225 |
|---|
| November | 7.5 | 230 |
|---|
| December | 7.5 | 230 |
|---|
| Year | 6.7 | 2445 |
|---|