Select units of measurement for the temperature and rainfall tables (metric or imperial).
Average weather, temperature, rainfall, sunshine
The climate of Bangladesh is
subtropical in the center-north and tropical in the south. There is a pleasantly warm, sunny winter, slightly cooler in the north and warmer in the south, then there is a short, hot spring between March and May, and a long rainy season from June to October due to the
summer monsoon.
The country is flat and occupied by the huge Ganges-Brahmaputra Delta, and it's therefore exposed to floods as well as to storm surges when cyclones hit the Bay of Bengal.
The
sun in Bangladesh regularly shines in the dry season, while in the monsoon season, from June to September, it is quite rarely seen.
The climate in detail
Seasons
The
dry season runs from November to March. The monsoon has left the country during the month of October, but the rains can sometimes last until November, especially in the south-east, or when a cyclone arrives. In general, however, November is hot but not too much, with highs around 30 °C (86 °F), and sunny.
The actual
winter begins in December and is characterized by warm and sunny days, followed by cool nights, especially in the north.
During winter, especially in December and January,
fog can form in inland areas (therefore also in Dhaka), and there can be quite cool days, with highs below 20 °C (68 °F).
Furthermore, from December to February, the north wind can sometimes bring
cold temperatures at night, around 3/6 °C (37/43 °F) in the north, and around 10 °C (50 °F) in the center-south and in Dhaka.
In
February, the temperature begins to rise, and by March, it begins to get really hot.
Spring, from
March to May, is actually the hottest season: the average maximum temperatures reach 35 °C (95 °F) in April in inland areas, while they don't go above 32/33 °C (90/91 °F) along the coast, where the hottest month, because of the thermal inertia of the sea, is May. The highest peaks are about 42/43 °C (108/109 °F) in the north, 40 °C (104 °F) in Dhaka and in the center, and 37/38 °C (99/100 °F) in the south. Relative humidity gradually increases, and the heat becomes more and more stifling.
In this season, lines of
thunderstorms coming from the Himalayas, called northwesters, bring rainfall accompanied with hail and wind gusts, so much so that in May, more than 250 millimeters (10 inches) of rain fall in the south and 150 mm (6 in) in the north.

The real
monsoon arrives between late May and early June, starting from the south-east. It brings more compact cloudiness, high humidity even during the day, frequent rains, but also a decrease in temperature, which drops to 30/32 °C (86/90 °F) during the day, but remains high at night, about 25 °C (77 °F). The rains are more abundant along the south coast, particularly the south-eastern one (see Chittagong and Cox's Bazar), but also in the north-east, close to the mountains of India (see Sylhet). In July, rainfall amounts to 800 mm (31.5 in) in Sylhet, to 750 mm (29.5 in) in Chittagong, to 985 mm (38.5 in) in Cox's Bazar, and to as high as 1,000 mm (40 in) in Teknaf.
The monsoon is less intense in the west, where the annual rainfall is around 1,500/1,600 mm (60/63 in), with a maximum in July of about 300/350 mm (12/13.5 in), as happens for example in Pabna, Jessore and Rajshahi. More to the south, rainfall reaches 3,500 mm (138 in) per year in Cox's Bazar, and up to 4,000 mm (157 in) in the more southern city of Teknaf. In Sylhet, in the northeast, where, as we said, the other very rainy area is found, it reaches 4,000 mm (157 in) per year.
The monsoon gradually withdraws between October and November.
Cities
Saidpur

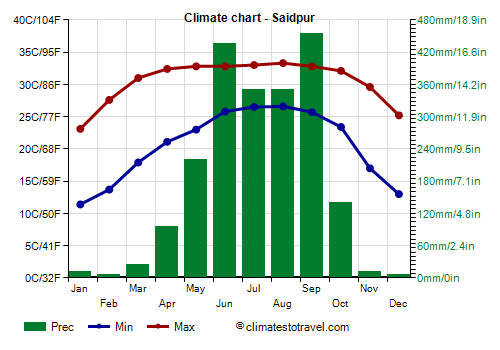
In the far north, in cities like Saidpur and Rangpur, in January, the coldest month, lows are around 11 °C (52 °F) and highs around 23 °C (73 °F).
In Saidpur, 2,100 mm (82.5 in) of rain fall per year, with a maximum from June to September.
Dhaka

In the central area, which includes
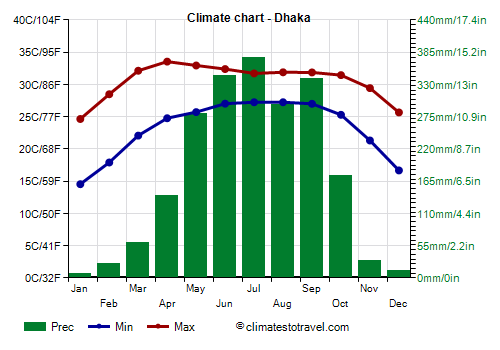
Dhaka, the capital city, the winter temperatures are higher. In Dhaka, the January average is of 19 °C (66 °F).
In Dhaka, precipitation amounts to 1,900 mm (75 in) per year, of which 390 mm (15.3 in) fall in July.
Chittagong

In
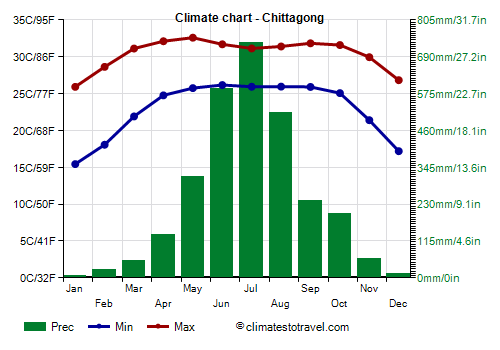
Chittagong (or Chattogram), on the coast, the average winter temperature is even higher, reaching 20 °C (68 °F) even in January.
In Chittagong, rainfall reaches 2,950 mm (116.5 in) per year.
Sea temperature
The
sea is warm enough for swimming all year round, even though, in January and February, its temperature drops to 22.5/23 °C (73/74 °F) in the northernmost part (see Chittagong), and to 23.5/24 °C (74/75 °F) in Cox's Bazar.
Tropical cyclones
Bangladesh is particularly vulnerable to
tropical cyclones, which come from the Bay of Bengal. Typically, cyclones occur from April to December, with two intensity peaks before and after the monsoon (from late April to early June and in October-November). The most intense cyclones on record (which were also among the most destructive in history) occurred in October-November 1876, in November 1970, and in late April 1991.
When to go
The best time to visit Bangladesh is winter, between
mid-December and February. Typically, in November and in the first half of December, the weather is good, and it's hot but not too much, but we cannot exclude that some cloud banks can still form, or that a cyclone, maybe outside of the normal season, can arrive.
In March and April it's hot, and thunderstorms, sometimes intense, can develop in the afternoon or in the evening.
What to pack
In
winter: bring spring/autumn clothes (light for the day), a jacket and a sweater for the evening, and possibly a hat and a scarf for cooler evenings in the north (see Rangpur and Saidpur).
In
summer: bring tropics-friendly, lightweight clothing of natural fibers, and a light raincoat or umbrella (although the latter is not always effective against the monsoon rains).
Climate data - Bangladesh
| Barisal |
|---|
|
| Jan | Feb | Mar | Apr | May | Jun | Jul | Aug | Sep | Oct | Nov | Dec |
|---|
| Min temp. | 12 | 15 | 20 | 24 | 25 | 26 | 26 | 26 | 26 | 24 | 19 | 14 |
|---|
| Max temp. | 25 | 29 | 32 | 34 | 34 | 32 | 31 | 32 | 32 | 32 | 30 | 27 |
|---|
| Precip. | 10 | 20 | 45 | 100 | 210 | 380 | 425 | 335 | 290 | 190 | 45 | 5 |
|---|
| Prec. days | 1 | 2 | 3 | 6 | 11 | 18 | 24 | 23 | 18 | 10 | 2 | 1 |
|---|
|
|
| Sun hours | 7 | 8 | 8 | 8 | 7 | 5 | 4 | 5 | 5 | 7 | 8 | 7 |
|---|
|
| Chittagong |
|---|
|
| Jan | Feb | Mar | Apr | May | Jun | Jul | Aug | Sep | Oct | Nov | Dec |
|---|
| Min temp. | 14 | 17 | 21 | 24 | 25 | 26 | 26 | 26 | 26 | 24 | 20 | 16 |
|---|
| Max temp. | 26 | 29 | 31 | 32 | 32 | 32 | 31 | 31 | 32 | 32 | 30 | 27 |
|---|
| Precip. | 10 | 20 | 50 | 105 | 335 | 625 | 720 | 535 | 280 | 230 | 45 | 10 |
|---|
| Prec. days | 1 | 1 | 3 | 6 | 14 | 19 | 21 | 21 | 17 | 10 | 3 | 1 |
|---|
| Humidity | 67% | 63% | 67% | 74% | 76% | 81% | 84% | 83% | 81% | 78% | 72% | 70% |
|---|
| Day length | 11 | 11 | 12 | 13 | 13 | 14 | 13 | 13 | 12 | 12 | 11 | 11 |
|---|
| Sun hours | 9 | 9 | 9 | 8 | 7 | 4 | 3 | 4 | 6 | 7 | 8 | 8 |
|---|
| Sea temp | 23 | 23 | 26 | 28 | 30 | 30 | 29 | 29 | 29 | 29 | 27 | 24 |
|---|
| Comilla |
|---|
|
| Jan | Feb | Mar | Apr | May | Jun | Jul | Aug | Sep | Oct | Nov | Dec |
|---|
| Min temp. | 12 | 16 | 20 | 23 | 24 | 26 | 26 | 26 | 25 | 24 | 19 | 14 |
|---|
| Max temp. | 26 | 29 | 31 | 32 | 32 | 32 | 31 | 31 | 32 | 32 | 30 | 27 |
|---|
| Precip. | 10 | 25 | 65 | 140 | 315 | 380 | 430 | 290 | 245 | 155 | 35 | 15 |
|---|
| Prec. days | 1 | 2 | 4 | 8 | 15 | 18 | 21 | 20 | 17 | 9 | 2 | 1 |
|---|
|
|
| Sun hours | 7 | 8 | 8 | 8 | 7 | 6 | 5 | 6 | 6 | 7 | 8 | 7 |
|---|
|
| Coxs Bazar |
|---|
|
| Jan | Feb | Mar | Apr | May | Jun | Jul | Aug | Sep | Oct | Nov | Dec |
|---|
| Min temp. | 16 | 18 | 22 | 24 | 26 | 26 | 25 | 25 | 25 | 25 | 21 | 17 |
|---|
| Max temp. | 27 | 30 | 32 | 33 | 33 | 32 | 31 | 31 | 32 | 32 | 31 | 28 |
|---|
| Precip. | 5 | 15 | 40 | 85 | 345 | 825 | 985 | 705 | 420 | 255 | 55 | 10 |
|---|
| Prec. days | 1 | 1 | 2 | 4 | 13 | 22 | 25 | 25 | 20 | 10 | 3 | 1 |
|---|
|
|
| Sun hours | 8 | 9 | 9 | 9 | 8 | 6 | 5 | 5 | 6 | 8 | 8 | 8 |
|---|
| Sea temp | 24 | 24 | 26 | 28 | 29 | 30 | 29 | 29 | 29 | 29 | 28 | 25 |
|---|
| Dhaka |
|---|
|
| Jan | Feb | Mar | Apr | May | Jun | Jul | Aug | Sep | Oct | Nov | Dec |
|---|
| Min temp. | 13 | 17 | 21 | 24 | 25 | 26 | 26 | 26 | 26 | 24 | 20 | 15 |
|---|
| Max temp. | 25 | 28 | 32 | 34 | 34 | 33 | 32 | 32 | 32 | 32 | 30 | 26 |
|---|
| Precip. | 5 | 20 | 50 | 130 | 270 | 315 | 390 | 315 | 285 | 175 | 20 | 10 |
|---|
| Prec. days | 1 | 2 | 4 | 8 | 14 | 17 | 21 | 21 | 17 | 10 | 2 | 1 |
|---|
| Humidity | 69% | 61% | 59% | 66% | 73% | 78% | 80% | 79% | 79% | 75% | 69% | 72% |
|---|
| Day length | 11 | 11 | 12 | 13 | 13 | 14 | 13 | 13 | 12 | 12 | 11 | 11 |
|---|
| Sun hours | 6 | 7 | 8 | 7 | 7 | 5 | 5 | 5 | 5 | 6 | 7 | 6 |
|---|
|
| Khulna |
|---|
|
| Jan | Feb | Mar | Apr | May | Jun | Jul | Aug | Sep | Oct | Nov | Dec |
|---|
| Min temp. | 12 | 16 | 21 | 24 | 26 | 26 | 26 | 26 | 26 | 24 | 20 | 14 |
|---|
| Max temp. | 25 | 29 | 33 | 35 | 35 | 34 | 32 | 32 | 33 | 32 | 30 | 26 |
|---|
| Precip. | 15 | 35 | 40 | 60 | 180 | 310 | 370 | 320 | 285 | 150 | 35 | 5 |
|---|
| Prec. days | 1 | 3 | 3 | 6 | 11 | 17 | 23 | 21 | 17 | 9 | 2 | 1 |
|---|
|
|
| Sun hours | 7 | 8 | 8 | 8 | 8 | 5 | 4 | 5 | 5 | 7 | 8 | 7 |
|---|
|
| Mymensingh |
|---|
|
| Jan | Feb | Mar | Apr | May | Jun | Jul | Aug | Sep | Oct | Nov | Dec |
|---|
| Min temp. | 12 | 15 | 19 | 22 | 24 | 26 | 26 | 26 | 26 | 23 | 18 | 14 |
|---|
| Max temp. | 24 | 27 | 30 | 32 | 32 | 32 | 32 | 32 | 32 | 32 | 30 | 26 |
|---|
| Precip. | 10 | 15 | 40 | 140 | 310 | 410 | 425 | 330 | 305 | 190 | 15 | 5 |
|---|
| Prec. days | 1 | 2 | 4 | 9 | 15 | 20 | 23 | 21 | 18 | 8 | 1 | 1 |
|---|
|
|
| Sun hours | 6 | 7 | 7 | 7 | 6 | 4 | 4 | 5 | 5 | 7 | 7 | 6 |
|---|
|
| Rajshahi |
|---|
|
| Jan | Feb | Mar | Apr | May | Jun | Jul | Aug | Sep | Oct | Nov | Dec |
|---|
| Min temp. | 11 | 13 | 18 | 23 | 24 | 26 | 26 | 26 | 26 | 23 | 18 | 13 |
|---|
| Max temp. | 24 | 28 | 33 | 36 | 35 | 34 | 32 | 33 | 32 | 32 | 29 | 26 |
|---|
| Precip. | 10 | 15 | 25 | 55 | 135 | 245 | 305 | 240 | 270 | 115 | 15 | 10 |
|---|
| Prec. days | 2 | 3 | 3 | 6 | 10 | 12 | 15 | 14 | 13 | 5 | 2 | 1 |
|---|
|
|
|
|
| Rangpur |
|---|
|
| Jan | Feb | Mar | Apr | May | Jun | Jul | Aug | Sep | Oct | Nov | Dec |
|---|
| Min temp. | 11 | 14 | 18 | 21 | 23 | 25 | 26 | 26 | 26 | 23 | 18 | 13 |
|---|
| Max temp. | 23 | 26 | 30 | 32 | 32 | 32 | 32 | 32 | 32 | 31 | 29 | 25 |
|---|
| Precip. | 10 | 10 | 25 | 120 | 275 | 425 | 415 | 345 | 380 | 170 | 5 | 5 |
|---|
| Prec. days | 1 | 2 | 3 | 8 | 15 | 19 | 19 | 17 | 15 | 7 | 1 | 1 |
|---|
|
|
| Sun hours | 6 | 7 | 8 | 7 | 6 | 5 | 5 | 6 | 6 | 7 | 8 | 7 |
|---|
|
| Saidpur |
|---|
|
| Jan | Feb | Mar | Apr | May | Jun | Jul | Aug | Sep | Oct | Nov | Dec |
|---|
| Min temp. | 11 | 14 | 17 | 21 | 23 | 25 | 26 | 26 | 26 | 23 | 17 | 13 |
|---|
| Max temp. | 23 | 27 | 31 | 32 | 32 | 33 | 32 | 33 | 32 | 31 | 29 | 25 |
|---|
| Precip. | 10 | 10 | 25 | 90 | 245 | 410 | 410 | 345 | 385 | 150 | 5 | 5 |
|---|
| Prec. days | 1 | 1 | 2 | 6 | 13 | 18 | 18 | 16 | 15 | 6 | 1 | 1 |
|---|
|
|
| Sun hours | 6 | 7 | 8 | 7 | 7 | 5 | 5 | 5 | 6 | 7 | 8 | 6 |
|---|
|
| Sylhet |
|---|
|
| Jan | Feb | Mar | Apr | May | Jun | Jul | Aug | Sep | Oct | Nov | Dec |
|---|
| Min temp. | 10 | 12 | 17 | 21 | 23 | 25 | 25 | 25 | 25 | 22 | 17 | 12 |
|---|
| Max temp. | 26 | 28 | 31 | 32 | 31 | 32 | 32 | 32 | 32 | 32 | 30 | 27 |
|---|
| Precip. | 5 | 40 | 125 | 380 | 590 | 795 | 725 | 610 | 495 | 200 | 25 | 10 |
|---|
| Prec. days | 1 | 3 | 7 | 15 | 22 | 26 | 28 | 26 | 20 | 10 | 2 | 1 |
|---|
|
|
| Sun hours | 7 | 8 | 7 | 7 | 6 | 4 | 4 | 5 | 5 | 7 | 8 | 8 |
|---|
|
See also the
temperatures month by month