Select units of measurement for the temperature and rainfall tables (metric or imperial).
Average weather, temperature, rainfall, sunshine
In the People's Republic of China, a huge country in East Asia, there are different types of climate. In short, we have the following
climate zones:
- continental, with very cold winters and hot, rainy summers in the north-east (Manchuria), and in Beijing (although here the winters are a little less cold).
- continental desert in the northwest (Xinjiang, Inner Mongolia).
- cold desert or semi-desert in the plateau of Tibet.
-temperate in the center (see Shanghai), with mild winters and hot, rainy summers.
- subtropical in the south (see Canton, Hong Kong), with very mild winters and hot, rainy summers, and tropical in the extreme south (see Hainan).
In the following map, we can see the
climate zones in China.

Winter is freezing cold in the north, in the mountains and the plateaus, where the average January temperature is below -10 °C (14 °F), and is mild in the south, where it reaches or exceeds 15 °C (59 °F).
Summer is hot everywhere, except in highlands and high mountains. If we exclude the vast western desert areas, where rainfall is scarce and irregular, summer is the rainiest season due to the
Asian monsoon, which brings humid currents from the sea. The rainiest part of the country is the south-east, where rainfall is equal to or higher than 1,500 millimeters (60 inches) per year, while the least rainy is the north-west, where it is below 100 mm (4 in).
Index
North-east

The north-eastern part of China, called Manchuria, has a
markedly continental climate, with frigid, dry winters and hot, rainy summers. The winter
monsoon brings cold air masses from nearby Siberia, but also several sunny days, while the summer monsoon brings warm and moist air masses from the south. In fact, the summer, from June to August, is the only season when there are significant rains. The rains are quite frequent also in May and September, though not abundant. Rainfall, or rather snowfall given the temperatures, is definitely scarce in the long cold season.
Winter in this area is very cold, since the average January temperature is below -10 °C (14 °F), and even below -20 °C (-4 °F) in the northern part. Cold records are around -40 °C (-40 °F).
In
Harbin, a metropolis of ten million inhabitants, the average January temperature is -17 °C (1 °F). Owing to the cold, the sculptures of the "Harbin International Ice and Snow Sculpture Festival", which is held every year in January, are preserved for weeks.

Further south, in
Shenyang, a city of eight million inhabitants, the temperature ranges from -11.5 °C (11.5 °F) in January to 25 °C (77 °F) in July. Here too, winter is quite sunny, while summer is humid and rainy.
In the northernmost part of Manchuria, near the border with Siberia, summer is cooler, in fact the average in July drops below 20 °C (68 °F). Winters are even colder, so much so that the average in January is near -25 °C (-13 °F), and the coldest records are almost -50 °C (-58 °F).
The desert

Nearly half of China is arid or desert, including
Tibet, which, however, has a peculiar climate. The desert belt begins north-west of Beijing, at no great distance from the capital (so it's no surprise that at times the same capital is hit by dust storms), and it extends westward, covering almost all of the
Inner Mongolia, where we find the Chinese side of the
Gobi desert, and then further to the west, in the areas at low or middle altitudes of Xinjiang and Gansu, where we find
Taklamakan (or Taklimakan), a huge sand desert.
The climate in this area is strongly continental, with freezing winters and hot summers, sometimes scorching, especially at lower altitudes, although it should be noted that this area is mostly occupied by
plateaus, around 800/1,200 meters (2,600/4,000 feet) above sea level, where the summer heat, though still present, it's tempered by the altitude. Sunshine is frequent throughout the year. The
wind is often strong, and storms can occur in winter and spring.

In
Kashgar, an oasis along the ancient Silk Road, located at 1,300 meters (4,250 feet) above sea level, the temperature ranges from -5 °C (23 °F) in January to 25 °C (77 °F) in July, when days are sometimes scorching despite the altitude, while nights are usually pleasant. In a year, only 60 millimeters (2.4 in) of rain (or snow in winter) fall, with a greater chance in summer.
Below 1,000 meters (3,300 feet), the temperature can reach 40 °C (104 °F) in summer.
The hottest area is the
Turpan (or Turfan) Depression, which is also the hottest place in China. It is small area at sea level (or even below, hence the name depression), where winter is freezing, but summer is hot, since daytime temperatures usually hover around 39/40 °C (102/104 °F) from June to August, with peaks of 45 °C (113 °F).
Ürümqi, a city of three million inhabitants, located at 850 meters (2,800 ft) above sea level, is the large city in the world farthest from the sea, which lies 2,400 kilometers (1,500 miles) away. Here, the average temperature ranges from -14 °C (7 °F) in January to 25 °C (77 °F) in July; in summer, it can sometimes exceed 40 °C (104 °F), while in winter it can plunge to -30 °C (-22 °F).
In the north-west, north of Urumqi and between Mongolia and Kazakhstan, we find
Dzungaria, which has a frigid winter, with averages ranging between -10 °C and -20 °C (14 and -4 °F), while summer becomes progressively cooler as you proceed towards the border with Russia. In Altay, 1,000 meters (3,300 feet) above sea level, the daily average temperature ranges from -16 °C (3 °F) in January to 20 °C (68 °F) in July.
Mountains

In China, there are several mountain ranges. We have not shown those of Tibet in the map because most of them have the same climate of Tibet itself.
Among the mountainous areas, we have to distinguish between two main zones: the chains of the
western part (inside the burgundy area in the left, where the Himalayas are also found), and those of the
south-east (Yunnan, in the black circle at the bottom) which, owing to both the southern latitude and the lower altitude, have a much milder climate, so we can define them as "warm mountains".
Along the western and the southern borders of China, there are several mountain ranges: Tian Shan, Pamir, Karakoram, Himalaya, while north of Tibet we find Kunlun Shan. Clearly, the temperatures vary according to latitude and altitude.
In
Akqi, located at 2,000 meters (6,500 feet) above sea level, in the northwest and near the border with Kyrgyzstan, the average temperature ranges from -8 °C (18 °F) in January to 19 °C (66 °F) in July. This shows how strongly the Asian continent warms up in summer even at high altitudes.
Everest
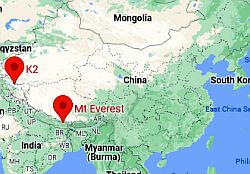 Everest and K2, where they are
The two world's highest mountains are located in China: Mount Everest, on the border with Nepal, and K2, on the border with Pakistan. On the top of Mount
Everest, the average temperature ranges from -36 °C (-33 °F) in January to -19 °C (-2 °F) in July; the cold record is about -60 °C (-76 °F). The temperature never exceeds the melting point. From June to September, the summer monsoon brings clouds and snow showers. In winter, from November to February, the western jet stream moves to a lower latitude and reaches this area, bringing hurricane-intensity winds, of more than 250 kph (155 mph), but strong winds are also possible in spring and autumn.
Yunnan
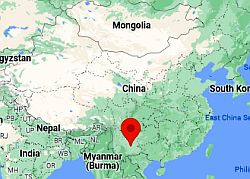 Kunming, where is located
In the province of
Yunnan, the "warm mountains" have a definitely more pleasant climate.
In
Kunming, 1,900 meters (6,200 ft) above sea level, the average ranges from 9.5 °C (49.5 °F) in January to almost 21 °C (69.5 °F) in June and July; therefore, the climate is temperate, even though the winter nights can be cold. Rainfall amounts to 1,000 mm (40 in) per year, the bulk of which occurring in summer.
In the
far south, on the border with Burma, Laos and Vietnam, the climate is sub-tropical even at an altitude between 1,000 and 1,500 meters (3,300 and 4,900 feet): winter is mild, while summer is hot and humid, with heavy rains.
Continental climate

This central-eastern area, which includes cities such as Beijing,
Tianjin,
Lanzhou,
Baotou, and
Hohhot, has a continental climate, although not as extreme as in the north-east. Winters are very cold, the average temperatures in January ranging from -10 °C to 0 °C (14 °F to 32 °F);
dust-laden winds can blow from the desert of Mongolia, while snowfalls are relatively rare.
Summer is hot and muggy, and it's the only rainy season, while in the other seasons, the sun usually shines. Annual precipitation ranges from 300 to 700 millimeters (12 to 27.5 in), and it's more abundant near the sea.
In the capital,
Beijing, winter is cold: the average in January is -3.5 °C (26 °F), while summer is hot and muggy, with an average in July of 26.5 °C (79.5 °F). Precipitation amounts to 545 mm (21.5 in), concentrated in the summer months.
Near Beijing, in Beidaihe, the sea is very cold in winter, while it is warm enough for swimming from July to September.

Every now and then, this area, especially in the part closest to the sea, can be affected by
typhoons or their remains. Typhoons occur in summer and early autumn, and are more common in the southern areas (see below).
On the border between this area and the next and milder area, we find a few cities where the average January temperature is around freezing, such as
Xi'an,
Jinan and
Qingdao
Temperate climate

In the central area of China, the climate is
milder in winter, since the average temperature in January is between 0 and 10 °C (32 and 50 °F), while summer is hotter and longer. In addition to the higher temperature, both cloudiness and rainfall increase throughout the year. Rainfall is quite frequent, though not abundant, even in winter. It hovers between 1,000 and 1,600 mm (40 to 63 in) per year, also because the summer monsoon lasts longer than in the north.
Along the lower reaches of the Yangtze River (or Chang Jiang), we find several large cities with a similar climate, such as
Wuhan,
Nanchang,
Nanjing (Nanking),
Hangzhou, and Shanghai.
In
Shanghai, winter is certainly milder than in Beijing, but it's still pretty cool, since the average temperature in January is 5 °C (41 °F). Summer, from June to September, is hot and muggy, with abundant rainfall. July and August are the hottest months, with a daily averages of 29/29.5 °C (84/85 °F), and despite the proximity to the sea, in a city so large and full of skyscrapers, the urban heat island effect is evident, and the breeze is not so effective in cooling the air.

In
Chongqing, located south of Shanghai and very far from the sea, winter is milder than in Shanghai, since the average in January is 8 °C (46.5 °F). Summer is even more hot and muggy: there is no relief on summer nights, when temperatures do not drop below 24/25 °C (75/77 °F).
In winter, as well as milder, Chongqing is also less rainy than Shanghai. Moreover, here and across southern China, the monsoon rains begin earlier, with a peak in May and June, and last until October.
South-central China is generally not sunny. In Chongqing, the sky is almost always cloudy.
In summer, this area can be reached by
typhoons, the tropical cyclones of South-East Asia, which originate in the Pacific Ocean, and then reach Southeast Asia, penetrating a few hundred kilometers (or miles) inland, although their effects are more remarkable on coastal regions. Typhoons can bring strong winds and torrential rains.
The south

In the southern part of China (Guangxi region,
Guangdong and Fujian provinces, as well as
Hong Kong and
Macau),
winter is very mild, so much so that the average temperature in January is above 10 °C (50 °F), while there's a long, tropical summer.
Annual precipitation is between 1,200 and 2,000 millimeters (47 and 79 inches), with a winter minimum and a summer maximum; during the warm season, rainfall occurs mostly in the form of showers and thunderstorms in the afternoon or evening, while it can occur in the form of long and torrential rains when the area is hit by typhoons. The sun does not shine very often.
In
Fuzhou, the summer, with highs equal to or higher than 28 °C (82 °F), lasts five months, from mid-May to mid-October, while in
Shenzhen, it lasts six months, from May to October.
In
Guangzhou (Canton), the most populous city, the average temperature ranges from 14.5 °C (58 °F) in January to 29.5 °C (85 °F) in July.
The rainiest period in the south is from April to September, while in October the rains decrease sharply, even though it's still warm. At these southern latitudes, the wettest period is not in the May-June period (as was the case of the area located south of Shanghai), but it is prolonged throughout the long summer: in Guangzhou, rainfall exceeds 230 mm (9 mm) per month from May to August.
The sea at the latitude of Guangzhou, and therefore at the Tropic, is never cold, even though it gets a little cool from December to March, while it is definitely warm in summer.

In the far south, the island of
Hainan has a quasi-tropical climate in the northern part, and tropical in the southern part, since in January it is crossed by the 20 °C (68 °F) isotherm.
Typhoons
As mentioned above, the eastern and southern parts of China can be hit by typhoons. The provinces most often affected are those of the
southern coast (Guangdong, Hainan, Fujian, Zhejiang, as well as Hong Kong and Macau). In contrast, the southwestern provinces (Yunnan, Sichuan) may be affected by the remains of cyclones coming from the Bay of Bengal, which can still bring abundant rains, even though this happens more rarely.
The south-east is also the region where the typhoon season is longer. They usually reach this area from
June to early November, but they sometimes affected this area outside of this period, especially in recent years, probably because of global warming. For example, this happened with typhoon Neoguri, which affected Hainan and Guangdong in mid-April 2008, and typhoon Chanchu, which hit Guangdong and southwestern Fujian in May 2006, and then moved to the north-east and reached as far as Shanghai.
In the following image, we can see the areas that have been affected by typhoons in the period 1950-2005 (the points refer to the eye of the cyclone, so the affected area is larger).

The central and northern provinces, still in the eastern part, are generally affected by typhoons moving northwards, towards the East China Sea, the Yellow Sea and the Bohai Sea, from
July to September (and more rarely in the second half of June and in early October). Typically, typhoons weaken as they move north. So, Beijing is affected much more rarely and less intensely than Shanghai, and Shanghai more rarely than Hainan and Guangdong.
Sometimes, typhoons can penetrate inland for a few hundred kilometers (or miles), while they never reach the western part of the country, which is too far from the sea.
When to go
Given the vastness of the country and the wide climatic variety, it's hard to find a single period in which the weather is very good throughout the country. In general, however, the best times are
spring and autumn. In fact, in the north and west the winter is very cold, while in the south and east the summer is hot and rainy. In addition, in summer and early autumn, especially in the southeast, there is a risk of typhoons.
The vast
northern region, both the northeast (Manchuria) and the desert northwest, being cold in winter and hot in summer, can be visited in May and September.
In
Beijing, in April and October, the days are pleasant, while at night it can get a bit cold, in addition, spring is preferable because it has longer days. You can also go in May and September, which are warmer.
In
Shanghai, which has a longer summer, you may prefer April, May and October.
You can visit the warm mountains of
Yunnan in spring, especially in March and April; in summer, even though the temperatures are pleasant, the rains are frequent and abundant and there's not much sun.
In Guangzhou and in the
south, since spring is already rainy, we prefer October and November, with a preference for November because the risk of typhoons is lower.
The plateau of
Tibet, being cold most of the year, can be visited in summer.
What to pack
In
winter: for Harbin and the north-east, the mountains and the desert, especially in the northern part (Urumqi and Dzungaria), bring cold weather clothing, synthetic thermal long underwear, a parka, a Gore-Tex jacket, gloves, a hat, and a scarf.
For the Beijing area, bring very warm clothes, such as a down jacket, gloves, a scarf, and a hat, which can be removed in the warmer days of February.
For the area of Shanghai, warm clothes, such as a sweater, a jacket, and possibly a raincoat or umbrella.
For Yunnan, in Kunming, warm clothes, such as a sweater, a jacket, a hat for colder nights, or heavier garments if you want to rise in altitude and climb mountains.
For the south, Fuzhou and Guangzhou, spring/autumn clothes, a sweater, a jacket, and a raincoat or umbrella. For Hainan, spring/autumn clothes (light for the day), a sweater, and a jacket.
In
summer: for Harbin and the north-east, bring light clothing, a sweatshirt or sweater for the evening, and a raincoat or umbrella.
For the desert, light clothing, a scarf for the wind, a sweatshirt or sweater for the evening at an altitude higher than sea level and in the far north; you can add a jacket, maybe long for the wind, above 1,000 meters (3,300 feet).
For the high mountains (Tian Shan, Pamir, Karakoram, Himalayas), a down jacket, a hat, gloves, and a scarf.
For the Beijing area, light clothes, a light raincoat or umbrella, a scarf for the wind, and a light sweatshirt for air conditioned places.
For the area of Shanghai, the south and Hainan, bring tropics-friendly, lightweight clothes, and a light raincoat or umbrella; a light sweatshirt and a scarf for air conditioned places.
For Yunnan, in Kunming, spring/autumn clothes (light for the day), a sweater, and a raincoat and umbrella; bring heavier clothes if you plan to climb mountains.
If you forgot to pack some clothes, you can easily find them and at low price on the spot.
It's better for women to avoid shorts and miniskirts in rural and non-tourist areas.
Climate data - China
| Baotou (1,050 meters) |
|---|
Baotou, location on the map |
|---|
| Jan | Feb | Mar | Apr | May | Jun | Jul | Aug | Sep | Oct | Nov | Dec |
|---|
| Min temp. | -16 | -12 | -4 | 3 | 10 | 15 | 18 | 16 | 10 | 2 | -6 | -14 |
|---|
| Max temp. | -4 | 2 | 9 | 18 | 24 | 29 | 30 | 28 | 23 | 16 | 6 | -2 |
|---|
| Precip. | 0 | 5 | 5 | 10 | 25 | 35 | 70 | 80 | 50 | 15 | 5 | 0 |
|---|
| Prec. days | 2 | 2 | 3 | 3 | 5 | 7 | 10 | 10 | 8 | 4 | 2 | 2 |
|---|
|
| Day length | 10 | 11 | 12 | 13 | 14 | 15 | 15 | 14 | 12 | 11 | 10 | 9 |
|---|
| Sun hours | 6 | 7 | 8 | 9 | 9 | 9 | 8 | 8 | 8 | 8 | 7 | 6 |
|---|
|
| Beijing |
|---|
Beijing, location on the map |
|---|
| Jan | Feb | Mar | Apr | May | Jun | Jul | Aug | Sep | Oct | Nov | Dec |
|---|
| Min temp. | -9 | -6 | 0 | 8 | 14 | 19 | 22 | 21 | 15 | 7 | -1 | -7 |
|---|
| Max temp. | 2 | 6 | 13 | 21 | 27 | 31 | 32 | 31 | 27 | 19 | 10 | 4 |
|---|
| Precip. | 5 | 5 | 10 | 25 | 40 | 75 | 170 | 120 | 55 | 25 | 15 | 0 |
|---|
| Prec. days | 2 | 2 | 3 | 5 | 6 | 10 | 13 | 11 | 8 | 5 | 3 | 2 |
|---|
| Humidity | 42% | 40% | 38% | 41% | 47% | 59% | 72% | 73% | 65% | 58% | 53% | 46% |
|---|
| Day length | 10 | 11 | 12 | 13 | 14 | 15 | 15 | 14 | 12 | 11 | 10 | 9 |
|---|
| Sun hours | 6 | 7 | 7 | 8 | 9 | 8 | 6 | 7 | 7 | 7 | 6 | 6 |
|---|
|
| Chongqing (250 meters) |
|---|
Chongqing, location on the map |
|---|
| Jan | Feb | Mar | Apr | May | Jun | Jul | Aug | Sep | Oct | Nov | Dec |
|---|
| Min temp. | 5 | 7 | 11 | 15 | 19 | 22 | 25 | 24 | 21 | 16 | 12 | 7 |
|---|
| Max temp. | 10 | 13 | 18 | 23 | 27 | 29 | 33 | 34 | 28 | 22 | 17 | 12 |
|---|
| Precip. | 20 | 25 | 45 | 95 | 145 | 195 | 185 | 135 | 105 | 85 | 50 | 25 |
|---|
| Prec. days | 10 | 10 | 12 | 14 | 16 | 16 | 13 | 11 | 13 | 16 | 12 | 10 |
|---|
| Humidity | 81% | 76% | 73% | 73% | 74% | 79% | 72% | 68% | 76% | 82% | 82% | 83% |
|---|
| Day length | 10 | 11 | 12 | 13 | 14 | 14 | 14 | 13 | 12 | 11 | 11 | 10 |
|---|
| Sun hours | 1 | 1 | 2 | 3 | 4 | 3 | 5 | 5 | 4 | 2 | 1 | 1 |
|---|
|
| Guangzhou |
|---|
Guangzhou, location on the map |
|---|
| Jan | Feb | Mar | Apr | May | Jun | Jul | Aug | Sep | Oct | Nov | Dec |
|---|
| Min temp. | 11 | 12 | 16 | 20 | 23 | 25 | 26 | 26 | 24 | 21 | 17 | 12 |
|---|
| Max temp. | 19 | 20 | 22 | 26 | 30 | 32 | 33 | 33 | 32 | 29 | 25 | 21 |
|---|
| Precip. | 50 | 55 | 100 | 195 | 330 | 365 | 245 | 270 | 205 | 65 | 35 | 35 |
|---|
| Prec. days | 5 | 6 | 9 | 11 | 14 | 16 | 14 | 14 | 10 | 4 | 3 | 4 |
|---|
| Humidity | 65% | 70% | 76% | 77% | 77% | 79% | 75% | 74% | 71% | 62% | 62% | 60% |
|---|
| Day length | 11 | 11 | 12 | 13 | 13 | 14 | 13 | 13 | 12 | 12 | 11 | 11 |
|---|
| Sun hours | 4 | 3 | 2 | 2 | 3 | 4 | 6 | 5 | 6 | 6 | 5 | 5 |
|---|
| Sea temp | 20 | 20 | 22 | 23 | 26 | 28 | 29 | 29 | 28 | 27 | 24 | 21 |
|---|
| Haikou |
|---|
Haikou, location on the map |
|---|
| Jan | Feb | Mar | Apr | May | Jun | Jul | Aug | Sep | Oct | Nov | Dec |
|---|
| Min temp. | 16 | 17 | 20 | 23 | 25 | 26 | 26 | 26 | 25 | 23 | 21 | 17 |
|---|
| Max temp. | 21 | 23 | 26 | 30 | 32 | 33 | 33 | 32 | 31 | 29 | 26 | 22 |
|---|
| Precip. | 20 | 35 | 50 | 105 | 185 | 210 | 210 | 225 | 250 | 200 | 95 | 35 |
|---|
| Prec. days | 9 | 11 | 10 | 12 | 16 | 16 | 14 | 15 | 15 | 13 | 10 | 8 |
|---|
| Humidity | 84% | 85% | 82% | 80% | 80% | 79% | 79% | 81% | 81% | 78% | 78% | 79% |
|---|
| Day length | 11 | 12 | 12 | 13 | 13 | 13 | 13 | 13 | 12 | 12 | 11 | 11 |
|---|
| Sun hours | 4 | 3 | 4 | 6 | 7 | 7 | 8 | 7 | 6 | 6 | 5 | 4 |
|---|
| Sea temp | 21 | 21 | 22 | 24 | 27 | 29 | 29 | 29 | 29 | 28 | 25 | 23 |
|---|
| Harbin |
|---|
Harbin, location on the map |
|---|
| Jan | Feb | Mar | Apr | May | Jun | Jul | Aug | Sep | Oct | Nov | Dec |
|---|
| Min temp. | -22 | -18 | -8 | 2 | 10 | 16 | 20 | 18 | 11 | 2 | -9 | -19 |
|---|
| Max temp. | -12 | -7 | 3 | 14 | 22 | 27 | 28 | 27 | 22 | 13 | 0 | -10 |
|---|
| Precip. | 5 | 5 | 15 | 25 | 45 | 90 | 165 | 120 | 55 | 35 | 15 | 10 |
|---|
| Prec. days | 1 | 1 | 3 | 3 | 7 | 9 | 10 | 11 | 7 | 5 | 2 | 2 |
|---|
| Humidity | 71% | 64% | 58% | 47% | 53% | 66% | 78% | 79% | 70% | 60% | 68% | 73% |
|---|
| Day length | 9 | 10 | 12 | 14 | 15 | 16 | 15 | 14 | 12 | 11 | 10 | 9 |
|---|
| Sun hours | 5 | 6 | 7 | 8 | 9 | 9 | 8 | 8 | 8 | 7 | 6 | 5 |
|---|
|
| Hotan (1,380 meters) |
|---|
Hotan, location on the map |
|---|
| Jan | Feb | Mar | Apr | May | Jun | Jul | Aug | Sep | Oct | Nov | Dec |
|---|
| Min temp. | -8 | -3 | 5 | 11 | 15 | 19 | 21 | 20 | 15 | 8 | 0 | -6 |
|---|
| Max temp. | 1 | 7 | 16 | 23 | 27 | 31 | 32 | 31 | 27 | 21 | 12 | 3 |
|---|
| Precip. | 0 | 0 | 0 | 5 | 5 | 10 | 5 | 5 | 5 | 0 | 0 | 0 |
|---|
| Prec. days | 2 | 2 | 1 | 1 | 2 | 3 | 3 | 2 | 1 | 0 | 0 | 1 |
|---|
| Humidity | 52% | 41% | 28% | 26% | 31% | 35% | 39% | 41% | 39% | 35% | 38% | 51% |
|---|
| Day length | 10 | 11 | 12 | 13 | 14 | 15 | 14 | 14 | 12 | 11 | 10 | 10 |
|---|
| Sun hours | 5 | 6 | 6 | 7 | 8 | 8 | 8 | 7 | 8 | 8 | 7 | 6 |
|---|
|
| Kashgar (1,300 meters) |
|---|
Kashgar, location on the map |
|---|
| Jan | Feb | Mar | Apr | May | Jun | Jul | Aug | Sep | Oct | Nov | Dec |
|---|
| Min temp. | -10 | -5 | 3 | 9 | 14 | 17 | 19 | 18 | 13 | 6 | -1 | -7 |
|---|
| Max temp. | 0 | 6 | 15 | 22 | 27 | 30 | 32 | 30 | 26 | 20 | 11 | 2 |
|---|
| Precip. | 5 | 5 | 5 | 5 | 10 | 10 | 10 | 10 | 5 | 5 | 0 | 0 |
|---|
| Prec. days | 2 | 2 | 2 | 2 | 3 | 4 | 4 | 4 | 2 | 1 | 1 | 2 |
|---|
| Humidity | 65% | 54% | 38% | 30% | 33% | 34% | 36% | 41% | 43% | 43% | 51% | 66% |
|---|
| Day length | 10 | 11 | 12 | 13 | 14 | 15 | 15 | 14 | 12 | 11 | 10 | 9 |
|---|
| Sun hours | 5 | 6 | 6 | 7 | 8 | 10 | 10 | 9 | 9 | 8 | 7 | 5 |
|---|
|
| Kunming (1,900 meters) |
|---|
Kunming, location on the map |
|---|
| Jan | Feb | Mar | Apr | May | Jun | Jul | Aug | Sep | Oct | Nov | Dec |
|---|
| Min temp. | 3 | 5 | 8 | 11 | 14 | 16 | 17 | 16 | 15 | 12 | 7 | 3 |
|---|
| Max temp. | 16 | 18 | 22 | 24 | 25 | 25 | 25 | 25 | 23 | 21 | 19 | 16 |
|---|
| Precip. | 25 | 15 | 20 | 30 | 90 | 175 | 225 | 185 | 120 | 85 | 30 | 15 |
|---|
| Prec. days | 5 | 5 | 7 | 8 | 13 | 18 | 22 | 21 | 16 | 15 | 7 | 5 |
|---|
| Humidity | 61% | 53% | 49% | 51% | 61% | 74% | 79% | 77% | 76% | 76% | 70% | 68% |
|---|
| Day length | 11 | 11 | 12 | 13 | 13 | 14 | 14 | 13 | 12 | 12 | 11 | 11 |
|---|
| Sun hours | 7 | 8 | 8 | 8 | 7 | 4 | 4 | 5 | 4 | 5 | 6 | 6 |
|---|
|
| Lanzhou (1,600 meters) |
|---|
Lanzhou, location on the map |
|---|
| Jan | Feb | Mar | Apr | May | Jun | Jul | Aug | Sep | Oct | Nov | Dec |
|---|
| Min temp. | -8 | -4 | 2 | 7 | 12 | 16 | 18 | 17 | 13 | 6 | -1 | -7 |
|---|
| Max temp. | 2 | 8 | 14 | 21 | 25 | 29 | 30 | 29 | 24 | 18 | 10 | 4 |
|---|
| Precip. | 0 | 5 | 5 | 15 | 40 | 45 | 65 | 65 | 45 | 20 | 5 | 0 |
|---|
| Prec. days | 2 | 2 | 4 | 6 | 8 | 9 | 11 | 10 | 10 | 6 | 2 | 1 |
|---|
| Humidity | 50% | 47% | 46% | 46% | 49% | 53% | 59% | 62% | 67% | 65% | 59% | 56% |
|---|
| Day length | 10 | 11 | 12 | 13 | 14 | 15 | 14 | 14 | 12 | 11 | 10 | 10 |
|---|
| Sun hours | 5 | 6 | 6 | 7 | 8 | 8 | 8 | 8 | 6 | 6 | 6 | 5 |
|---|
|
| Lhasa (3,650 meters) |
|---|
Lhasa, location on the map |
|---|
| Jan | Feb | Mar | Apr | May | Jun | Jul | Aug | Sep | Oct | Nov | Dec |
|---|
| Min temp. | -7 | -5 | -1 | 3 | 7 | 11 | 11 | 11 | 9 | 3 | -3 | -7 |
|---|
| Max temp. | 8 | 10 | 13 | 16 | 20 | 23 | 23 | 22 | 21 | 18 | 13 | 10 |
|---|
| Precip. | 0 | 0 | 5 | 10 | 30 | 75 | 130 | 135 | 65 | 10 | 0 | 0 |
|---|
| Prec. days | 1 | 1 | 2 | 5 | 9 | 14 | 19 | 20 | 15 | 4 | 1 | 0 |
|---|
| Humidity | 22% | 21% | 24% | 31% | 37% | 45% | 56% | 58% | 54% | 38% | 28% | 24% |
|---|
| Day length | 10 | 11 | 12 | 13 | 14 | 14 | 14 | 13 | 12 | 11 | 11 | 10 |
|---|
| Sun hours | 8 | 8 | 8 | 8 | 9 | 9 | 7 | 7 | 8 | 9 | 9 | 8 |
|---|
|
| Nanjing |
|---|
Nanjing, location on the map |
|---|
| Jan | Feb | Mar | Apr | May | Jun | Jul | Aug | Sep | Oct | Nov | Dec |
|---|
| Min temp. | -1 | 1 | 5 | 11 | 16 | 21 | 25 | 24 | 19 | 13 | 6 | 0 |
|---|
| Max temp. | 7 | 10 | 15 | 21 | 27 | 29 | 33 | 32 | 28 | 23 | 16 | 10 |
|---|
| Precip. | 45 | 55 | 80 | 80 | 90 | 165 | 215 | 145 | 75 | 60 | 55 | 30 |
|---|
| Prec. days | 9 | 9 | 12 | 10 | 10 | 11 | 12 | 12 | 8 | 8 | 7 | 6 |
|---|
| Humidity | 72% | 70% | 68% | 67% | 68% | 75% | 77% | 78% | 75% | 72% | 72% | 70% |
|---|
| Day length | 10 | 11 | 12 | 13 | 14 | 14 | 14 | 13 | 12 | 11 | 10 | 10 |
|---|
| Sun hours | 4 | 4 | 5 | 6 | 6 | 5 | 6 | 7 | 5 | 5 | 5 | 4 |
|---|
|
| Shanghai |
|---|
Shanghai, location on the map |
|---|
| Jan | Feb | Mar | Apr | May | Jun | Jul | Aug | Sep | Oct | Nov | Dec |
|---|
| Min temp. | 2 | 3 | 7 | 13 | 18 | 22 | 26 | 26 | 22 | 16 | 10 | 4 |
|---|
| Max temp. | 8 | 10 | 14 | 20 | 26 | 28 | 33 | 32 | 28 | 23 | 17 | 11 |
|---|
| Precip. | 75 | 60 | 95 | 75 | 85 | 180 | 145 | 215 | 85 | 55 | 50 | 45 |
|---|
| Prec. days | 10 | 9 | 12 | 11 | 10 | 13 | 11 | 12 | 9 | 7 | 8 | 8 |
|---|
| Humidity | 71% | 70% | 69% | 68% | 69% | 78% | 76% | 76% | 74% | 70% | 71% | 69% |
|---|
| Day length | 10 | 11 | 12 | 13 | 14 | 14 | 14 | 13 | 12 | 11 | 11 | 10 |
|---|
| Sun hours | 4 | 4 | 4 | 5 | 5 | 4 | 6 | 6 | 6 | 5 | 4 | 4 |
|---|
| Sea temp | 9 | 7 | 8 | 12 | 17 | 22 | 26 | 27 | 25 | 22 | 18 | 13 |
|---|
| Shantou |
|---|
Shantou, location on the map |
|---|
| Jan | Feb | Mar | Apr | May | Jun | Jul | Aug | Sep | Oct | Nov | Dec |
|---|
| Min temp. | 12 | 13 | 15 | 19 | 23 | 26 | 26 | 26 | 25 | 22 | 18 | 14 |
|---|
| Max temp. | 19 | 19 | 22 | 25 | 29 | 31 | 33 | 32 | 32 | 29 | 25 | 21 |
|---|
| Precip. | 40 | 50 | 85 | 145 | 195 | 285 | 225 | 285 | 150 | 35 | 45 | 40 |
|---|
| Prec. days | 4 | 5 | 7 | 9 | 11 | 14 | 11 | 11 | 7 | 3 | 3 | 4 |
|---|
| Humidity | 74% | 77% | 78% | 79% | 82% | 84% | 80% | 81% | 77% | 71% | 72% | 71% |
|---|
| Day length | 11 | 11 | 12 | 13 | 13 | 14 | 13 | 13 | 12 | 12 | 11 | 11 |
|---|
| Sun hours | 5 | 4 | 4 | 4 | 5 | 6 | 8 | 7 | 7 | 7 | 6 | 5 |
|---|
| Sea temp | 20 | 20 | 22 | 23 | 26 | 27 | 28 | 28 | 28 | 26 | 24 | 21 |
|---|
| Shenyang |
|---|
Shenyang, location on the map |
|---|
| Jan | Feb | Mar | Apr | May | Jun | Jul | Aug | Sep | Oct | Nov | Dec |
|---|
| Min temp. | -18 | -12 | -4 | 5 | 12 | 18 | 21 | 19 | 12 | 4 | -5 | -14 |
|---|
| Max temp. | -5 | 0 | 7 | 17 | 23 | 27 | 29 | 28 | 24 | 16 | 5 | -3 |
|---|
| Precip. | 5 | 10 | 20 | 40 | 55 | 95 | 175 | 170 | 65 | 40 | 20 | 10 |
|---|
| Prec. days | 4 | 4 | 5 | 8 | 9 | 12 | 14 | 11 | 8 | 7 | 5 | 4 |
|---|
| Humidity | 60% | 54% | 50% | 46% | 51% | 65% | 77% | 78% | 67% | 59% | 61% | 63% |
|---|
| Day length | 10 | 11 | 12 | 13 | 15 | 15 | 15 | 14 | 12 | 11 | 10 | 9 |
|---|
| Sun hours | 5 | 6 | 7 | 8 | 8 | 8 | 7 | 7 | 8 | 7 | 5 | 5 |
|---|
|
| Tahe (360 meters) |
|---|
Tahe, location on the map |
|---|
| Jan | Feb | Mar | Apr | May | Jun | Jul | Aug | Sep | Oct | Nov | Dec |
|---|
| Min temp. | -32 | -29 | -19 | -6 | 2 | 8 | 13 | 10 | 2 | -8 | -22 | -30 |
|---|
| Max temp. | -16 | -10 | -2 | 9 | 18 | 24 | 26 | 24 | 17 | 7 | -8 | -17 |
|---|
| Precip. | 5 | 5 | 10 | 25 | 40 | 75 | 125 | 105 | 60 | 20 | 10 | 5 |
|---|
| Prec. days | 2 | 1 | 2 | 5 | 5 | 9 | 10 | 9 | 6 | 4 | 3 | 3 |
|---|
|
| Day length | 8 | 10 | 12 | 14 | 16 | 17 | 16 | 15 | 13 | 11 | 9 | 8 |
|---|
| Sun hours | 5 | 7 | 8 | 8 | 7 | 8 | 6 | 6 | 6 | 6 | 5 | 4 |
|---|
|
| Tianjin |
|---|
Tianjin, location on the map |
|---|
| Jan | Feb | Mar | Apr | May | Jun | Jul | Aug | Sep | Oct | Nov | Dec |
|---|
| Min temp. | -8 | -5 | 2 | 10 | 16 | 20 | 23 | 22 | 17 | 9 | 1 | -6 |
|---|
| Max temp. | 2 | 6 | 12 | 20 | 26 | 30 | 31 | 30 | 27 | 20 | 10 | 3 |
|---|
| Precip. | 0 | 5 | 10 | 20 | 35 | 80 | 150 | 125 | 45 | 25 | 10 | 5 |
|---|
| Prec. days | 2 | 2 | 3 | 5 | 6 | 8 | 11 | 9 | 6 | 5 | 3 | 2 |
|---|
| Humidity | 53% | 51% | 46% | 46% | 50% | 63% | 73% | 73% | 65% | 59% | 57% | 55% |
|---|
| Day length | 10 | 11 | 12 | 13 | 14 | 15 | 15 | 14 | 12 | 11 | 10 | 10 |
|---|
| Sun hours | 5 | 6 | 7 | 7 | 8 | 8 | 7 | 7 | 7 | 6 | 5 | 5 |
|---|
| Sea temp | 4 | 3 | 4 | 7 | 12 | 18 | 23 | 25 | 23 | 19 | 14 | 8 |
|---|
| Turpan |
|---|
Turpan, location on the map |
|---|
| Jan | Feb | Mar | Apr | May | Jun | Jul | Aug | Sep | Oct | Nov | Dec |
|---|
| Min temp. | -10 | -4 | 6 | 14 | 20 | 25 | 26 | 25 | 18 | 9 | 0 | -8 |
|---|
| Max temp. | -2 | 7 | 18 | 28 | 34 | 39 | 40 | 39 | 33 | 22 | 10 | 0 |
|---|
| Precip. | 0 | 0 | 0 | 0 | 0 | 5 | 0 | 0 | 0 | 0 | 0 | 0 |
|---|
| Prec. days | 2 | 0 | 0 | 1 | 1 | 2 | 2 | 2 | 1 | 1 | 0 | 1 |
|---|
| Humidity | 52% | 42% | 30% | 23% | 23% | 24% | 29% | 32% | 35% | 42% | 51% | 60% |
|---|
| Day length | 9 | 11 | 12 | 14 | 15 | 15 | 15 | 14 | 12 | 11 | 10 | 9 |
|---|
| Sun hours | 5 | 7 | 8 | 9 | 10 | 10 | 10 | 10 | 9 | 8 | 6 | 4 |
|---|
|
| Urumqi (650 meters) |
|---|
Urumqi, location on the map |
|---|
| Jan | Feb | Mar | Apr | May | Jun | Jul | Aug | Sep | Oct | Nov | Dec |
|---|
| Min temp. | -18 | -14 | -3 | 8 | 14 | 19 | 21 | 19 | 13 | 5 | -4 | -14 |
|---|
| Max temp. | -10 | -6 | 5 | 18 | 24 | 30 | 31 | 30 | 24 | 15 | 3 | -7 |
|---|
| Precip. | 10 | 10 | 20 | 30 | 40 | 35 | 30 | 25 | 25 | 25 | 20 | 15 |
|---|
| Prec. days | 9 | 7 | 7 | 7 | 7 | 8 | 8 | 6 | 5 | 6 | 7 | 10 |
|---|
| Humidity | 84% | 83% | 70% | 43% | 37% | 37% | 39% | 39% | 39% | 53% | 77% | 86% |
|---|
| Day length | 9 | 10 | 12 | 14 | 15 | 15 | 15 | 14 | 12 | 11 | 10 | 9 |
|---|
| Sun hours | 3 | 5 | 6 | 8 | 9 | 9 | 10 | 10 | 9 | 7 | 4 | 3 |
|---|
|
| Wuhan |
|---|
Wuhan, location on the map |
|---|
| Jan | Feb | Mar | Apr | May | Jun | Jul | Aug | Sep | Oct | Nov | Dec |
|---|
| Min temp. | 0 | 3 | 7 | 13 | 18 | 22 | 26 | 25 | 20 | 14 | 8 | 2 |
|---|
| Max temp. | 8 | 11 | 16 | 22 | 27 | 30 | 33 | 33 | 29 | 23 | 17 | 11 |
|---|
| Precip. | 50 | 70 | 90 | 135 | 165 | 220 | 225 | 115 | 75 | 80 | 60 | 30 |
|---|
| Prec. days | 10 | 9 | 13 | 13 | 12 | 12 | 12 | 10 | 8 | 9 | 8 | 7 |
|---|
| Humidity | 73% | 73% | 72% | 72% | 72% | 78% | 77% | 76% | 73% | 72% | 72% | 70% |
|---|
| Day length | 10 | 11 | 12 | 13 | 14 | 14 | 14 | 13 | 12 | 11 | 11 | 10 |
|---|
| Sun hours | 3 | 3 | 4 | 5 | 6 | 6 | 7 | 7 | 6 | 5 | 5 | 4 |
|---|
|
| Xining (2,250 meters) |
|---|
Xining, location on the map |
|---|
| Jan | Feb | Mar | Apr | May | Jun | Jul | Aug | Sep | Oct | Nov | Dec |
|---|
| Min temp. | -15 | -11 | -5 | 1 | 5 | 9 | 11 | 11 | 7 | 0 | -7 | -13 |
|---|
| Max temp. | 2 | 6 | 11 | 16 | 20 | 23 | 25 | 24 | 19 | 14 | 9 | 3 |
|---|
| Precip. | 0 | 0 | 10 | 20 | 50 | 65 | 80 | 80 | 60 | 20 | 5 | 0 |
|---|
| Prec. days | 3 | 3 | 5 | 6 | 11 | 15 | 15 | 14 | 13 | 7 | 2 | 2 |
|---|
| Humidity | 45% | 41% | 40% | 42% | 50% | 58% | 63% | 65% | 68% | 61% | 52% | 48% |
|---|
| Day length | 10 | 11 | 12 | 13 | 14 | 15 | 14 | 14 | 12 | 11 | 10 | 10 |
|---|
| Sun hours | 7 | 7 | 7 | 8 | 8 | 8 | 8 | 8 | 7 | 7 | 7 | 6 |
|---|
|
See also the
temperatures month by month