Select units of measurement for the temperature and rainfall tables (metric or imperial).
Average weather, temperature, rainfall, sunshine
Sri Lanka, formerly Ceylon, is a island country located south-east of India, just north of the Equator, and has a
tropical climate, with hot, humid weather all year round.
Throughout the country there is a
rainy season from October to December, while in the other months, the rains vary greatly depending on the area.
In fact, even though the country is small, there are significant
differences, especially as regards to the distribution of the
rainfall, whose pattern is determined by the monsoon regime, but also by the two zenith passages of the sun (that is, when it shines directly overhead in the sky at mid-day), which occur in early April and early September.
Also the proximity of the extreme south of India, which partly protects the north-west, and the inland elevations, which are higher in the south-central part of the island, influence the intensity and the distribution of rainfall in the different areas.
The
rainiest areas are the south-western mountain slope and the coastal area where Colombo is located. The
driest areas are the north-west coast (see Jaffna, Mannar) and the south-east coast (see Hambantota).
The highest mountain is
Pidurutalagala (or Mount Pedro), 2,524 meters (8,280 feet) high.
The
sea in Sri Lanka is warm all year round.
On average, the amount of
sunshine in Sri Lanka is never low on the coasts, in fact, there are a few hours of sunshine a day even in the rainy months, however, it is better in the dry season, when there are 8/9 hours of sunshine per day. In total, 2,600 hours of sunshine per year are exceeded even in the rainiest part of the coast (see Colombo). On the contrary, in inland mountainous areas, cloudiness is more common, and the sun is rarely seen from May to December.
The climate in detail
The seasons
Here is a summary of the times of the year that determine the climate of Sri Lanka.
- From mid-December to February: it is the period of the
north-east monsoon, which brings rainfall especially on the eastern side (see Trincomalee, Batticaloa, Pottuvil). The rains gradually decrease as the sea becomes slightly cooler. Temperatures are the lowest of the year, and sometimes nights are quite cool (below 20 °C or 68 °F).
- From March to mid-May: this is the first intermonsonic period, usually dry and gradually hotter (especially in the north-central part of the country), in which, however,
rains occur in the form of downpours or thunderstorms in the afternoon or evening, which are frequent and abundant only
on the western side (see Colombo) and in the mountainous interior areas (see Kandy, Nuwara Eliya).
- From mid-May to September: it is the period of the
southwest monsoon, which, however, releases the bulk of the rains in India, while in Sri Lanka, it brings heavy rainfall only on the southwest coast (see Colombo) and in the mountainous area of the interior, especially in the first part (mid-May - mid June) and a little less in the last (September).
In this period, the north-west (see Jaffna, Mannar) is the driest area because it is protected by the south-east of India. However, during this period, the sea is rough on the western side, and there may be dangerous currents, except for the beaches partially sheltered by a coral reef (see the beaches of Unawatuna and Hikkaduwa).
- From October to mid-December: this is the second intermonsonic period, in which, unlike in the first, there are
rains spread throughout the country, since tropical depressions often form.
As a
result, on the eastern side it rains a lot only from October to February, in the north-west it rains a lot only from October to December, on the western side it rains mainly from April to June and from September to November, while in the mountainous areas it rains mainly from April to December.
North-west
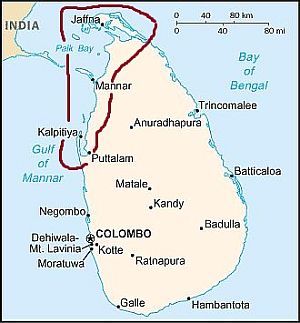
In the
north-west (see Jaffna, Mannar), which as we have mentioned is partially protected by neighbouring India, between 1,000 and 1,300 millimeters (40 to 50 inches) of rain fall per year, and
the rains are only abundant between October and December.
Temperatures are high throughout the year, but compared to the south, there's a greater difference between the winter months and the pre-monsoon period, from March to May, when the temperature rises, also due to the influence of the Indian continental mass.
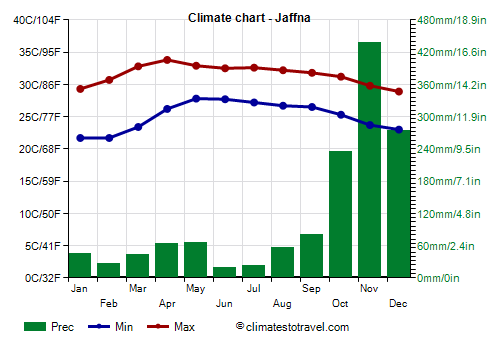
In
Jaffna, located in the north-western tip of the country, the weather is hot all year round.
Being that the summer monsoon is very weak, the heat remains intense even in summer. On average, 1,370 mm (54 inches) of rain fall per year, but the rains are really abundant only from October to December.
In the north-west, the sun often shines from January to May, while in the rest of the year, the hours of sunshine decrease a little, both in the summer (where it rarely rains, but there's still some cloudiness due to the south-west monsoon) and in the rainy period of the end of the year.
In
Mannar, a little further to the south, the climate is similar to that of Jaffna. Rainfall even drops below 1,000 mm (40 in) per year. However, in addition to the rainy season at the end of the year, there is a certain increase in rainfall in April, the hottest month before the southwest monsoon arrives.
Further south, in
Puttalam and Kalpitiya, the climate is similar, but the increase in rainfall in April and May is evident, so much so that in April, 155 mm (6 in) of rain fall.
South-west coast
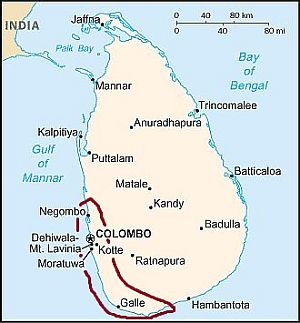
The south-western coast, from
Negombo to Tangalle, being to the west of the mountains and not being protected by India, is
decidedly more rainy than the north-western one, and does not experience a real dry season, even though the rains decrease from January to March, and to a lesser extent from June to August. In this part of the coast, there are beaches like Bentota, Hikkaduwa, Unawatuna and Mirissa.

The legislative capital of Sri Lanka,
Colombo, is located (together with the neighboring administrative capital, Sri Jayawardenepura Kotte) in the rainiest part of the country, namely the south-western side. Here, 2,500 mm (99 in) of rain fall per year, with
two maxima, in April-May and October-November, when precipitation exceeds 250 mm (10 in) per month.
Between the two rainy periods, there is a relative decrease in July and August, with about 120 mm (4.7 in) of rain per month, while the driest months, with less than 100 mm (4 in) per month, are January and February.
In Colombo, the temperature exceeds 30 °C (86 °F) even from December to February, when the northeast monsoon blows, which comes down from the mountains, although the slightly lower humidity makes it more bearable than in the rest of the year.
The sun regularly shines from January to April, while from May to September, it does not shine very often because it is directly exposed to the southwest monsoon.
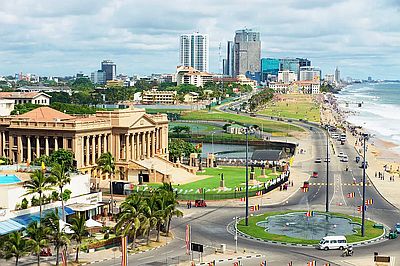
In the extreme south-west, in
Galle, it rains more than in Colombo in July and August; precipitation is around 2,350 mm (92.5 in) per year. However, here too, the rains drop to an acceptable level from January to March.
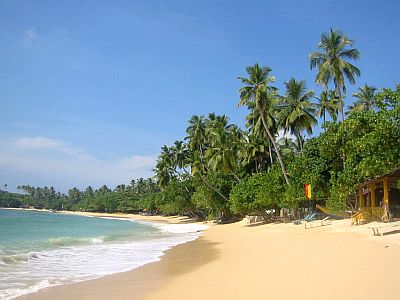
In the part of the coast facing south, in Matara and Tangalle, the rains decrease a little, but remain abundant. In
Matara, at the southern tip of Sri Lanka, 2,000 mm (78 in) of rain fall per year, and in
Tangalle 1,900 mm (75 in).
East coast
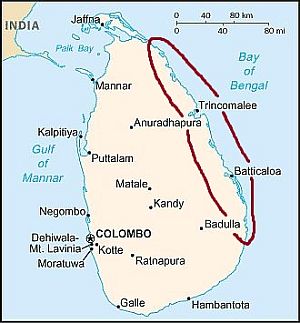
The
east coast is exposed to the humid winds brought by the depressions that form on the Bay of Bengal
by October, and then directly receives the northeast monsoon from December to February, which gradually becomes weaker. In contrast, this coast is sheltered from the south-west monsoon that blows from May to September, so in this period, the sun shines and it is also very hot. Therefore, even though the total rainfall amount is not low,
the landscape is semi-arid.
On average, around 1,600 mm (63 in) of rain fall per year.
In
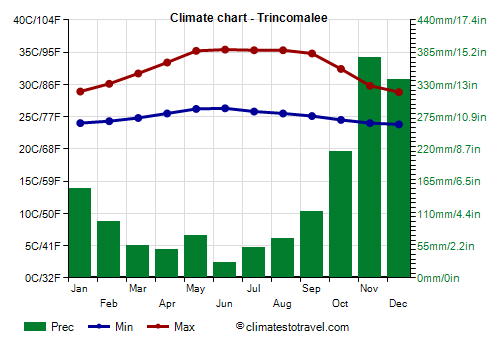
Trincomalee, it is hot all year round. However, in the rainy season, the maximum temperatures drop to around 29/30 °C (84/86 °F), although the humidity increases. On the other hand, the summer period, as well as being quite dry, is also particularly hot, since the prevailing wind blows from the interior.
The rains are abundant from October to January, and very abundant in November and December, at the height of the retreating monsoon.
On the east coast, the sun regularly shines for most of the year, and therefore even in summer, since the area is in a rain shadow from to the southwest monsoon. The least sunny months are the wettest, November and December.
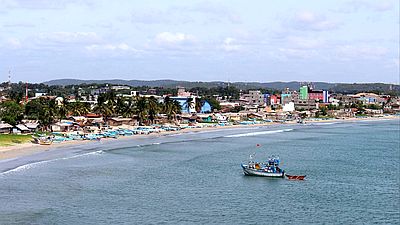
Further south, in
Batticaloa, in
Kalmunai and in Arugam Bay, a famous beach among surfers, the climate is similar to that of Trincomalee.
Southeast coast
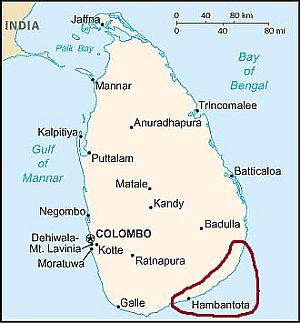
On the southeastern coast (see Hambantota, Kirinda), which is quite protected even from the north-east monsoon, rainfall is again quite contained, as in the north-west, and amounts to 1,000/1,200 mm (40/47 in) per year, with a relative peak in April and May, and a more pronounced one from October to December.
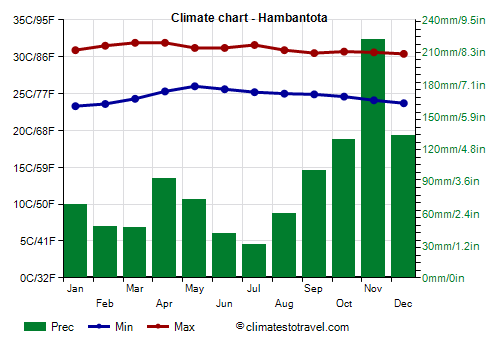
In
Hambantota, the rainfall amounts to 1,000 mm (40 in) per year, and it exceeds 100 mm (4 in) per month only from October to December. However, from June to August, although the rains are rare, there is often wind and the sea is rough.
The interior
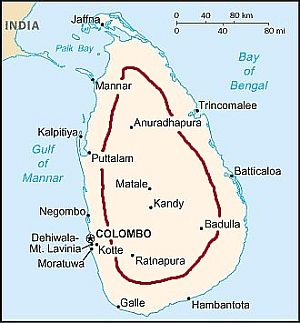
In the
interior, the heat is particularly intense at low altitude.
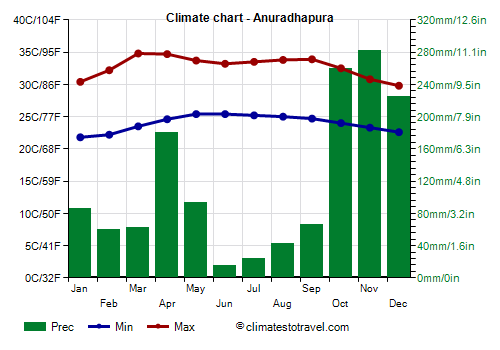
In
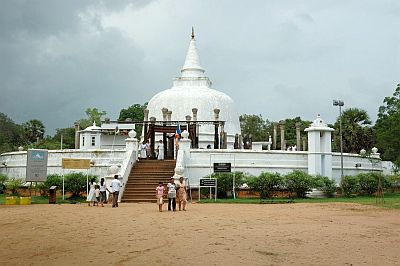
Anuradhapura, in the north-central inland region, the heat is intense throughout the year, but especially between March and September.
The rainfall amounts to 1,400 mm (55 in) per year, with a maximum between October and December and a minimum in summer, between June and August. In April and May, there is an increase in the afternoon showers, but not as intense as in the south-west.
Going up in altitude, the climate becomes milder, but also rainier.
Already in
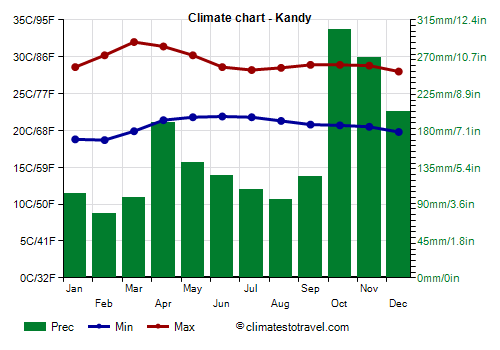
Kandy, at 450 meters (1,450 ft) above sea level, in the center of the island, the heat is slightly less intense than in the plains: the daily average ranges from 23.5 °C (74 °F) in January to 26.5 °C (79.5 °F) in April.
Rainfall in Kandy amounts to 1,850 mm (72 in) per year, with a minimum from January to March and a maximum between October and December.
In summer, after all, it does not rain very much, around 100 mm (4 in) per month, so much so that the Buddhist festival of
Esala Perahera is held for 10 nights in a row in July or August.
In
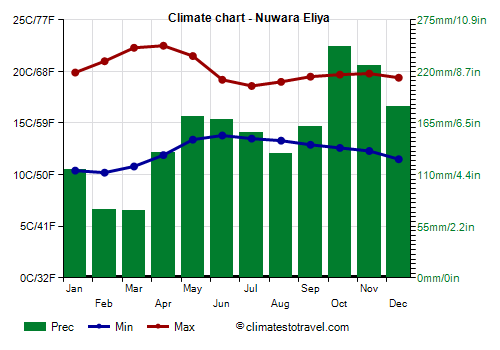
Nuwara Eliya, 1,900 meters (6,200 ft) above sea level, the temperature is spring-like all year round, but at night, it can be a bit cold between December and March.
In Nuwara Eliya, 1,850 mm (73 in) of rain fall per year. The rainfall pattern is similar to that of Kandy. Here too, there is no real dry season, although in January, February and March, the rains are not very abundant and are around 70/100 mm (2.8/4 in) per month.
The sun is rarely seen from May to September, although it does not shine too often even in the least rainy months, February and March.
Tropical cyclones
Sri Lanka lies in the path of
tropical cyclones, even though most of them pass to the north, affecting India and the Bay of Bengal. The period of cyclones, which are able to bring heavy rains and strong winds, goes from April to December.
However, the only months when cyclones typically hit Sri Lanka are
November and December, as well as in mid-May, when cyclones generally do not hit Sri Lanka directly, because they form on the Bay of Bengal and then head towards Bangladesh, but they can still bring heavy rains.
However, to tell the truth, tropical depressions (ie less intense tropical cyclones) can form even from January to March, since at so low a latitude, as previously mentioned, the sea remains warm all year round, so it's always able to provide energy for their formation.
When to go
Notwithstanding the fact that it is an equatorial country, where the rains can be irregular from one year to the next, the best months to visit
Sri Lanka as a whole, and therefore also the cities of the interior, are
February and March.
In fact, in January, it still rains a lot on the east coast, while from April to September, it rains a lot in the south-west and in inland areas, and then from October to December, it rains a lot in the whole country.
On the other hand, for a
beach holiday, in the northwest you can go from mid-January to mid-September, in Puttalam and Kalpitiya and on the south-west coast (from Colombo to Tangalle) you can go from January to March, on the east coast (Trincomalee, Batticaloa, Kalmunai) you can go from February (or for safety from March) to mid-September, and on the south-east coast (Hambantota) you can go from January to March.
The month of
may is generally rainy only on the west coast and in the mountainous areas, but around the middle of the month, a cyclone can form on the Bay of Bengal, bringing abundant rainfall throughout the country, which can trigger landslides and floods. So this period, roughly 10 to 20 May, can be avoided throughout Sri Lanka.
In summer,
from June to August, the east coast is preferable because it is sunnier, and the sea is calm. On the contrary, in this period, on the south-west coast, from Colombo to Tangalle, the weather is rainy, and the sea is rough.
What to pack
All year round, pack
light clothes of natural fibers, a light raincoat or umbrella, comfortable shoes, a scarf for the breeze, and a light sweatshirt for the evening, especially at low-mountain elevations (see Kandy). From November to March, you can bring a light sweatshirt for the evening also at sea level, especially in the north-west. In Nuwara Eliya and at high altitudes, bring spring/autumn clothes, a sweater and a jacket for the evening, and a raincoat or umbrella.
When going to the reef, you can bring snorkeling equipment, including water shoes or rubber-soled shoes.
Before entering temples, it is customary to remove shoes, dress neatly and cover a little.
Climate data - Sri Lanka
| Anuradhapura |
|---|
|
| Jan | Feb | Mar | Apr | May | Jun | Jul | Aug | Sep | Oct | Nov | Dec |
|---|
| Min temp. | 22 | 22 | 24 | 25 | 25 | 25 | 25 | 25 | 25 | 24 | 23 | 23 |
|---|
| Max temp. | 30 | 32 | 35 | 35 | 34 | 33 | 34 | 34 | 34 | 32 | 31 | 30 |
|---|
| Precip. | 85 | 60 | 60 | 180 | 95 | 15 | 25 | 45 | 65 | 260 | 280 | 225 |
|---|
| Prec. days | 6 | 4 | 5 | 11 | 6 | 2 | 2 | 4 | 5 | 14 | 17 | 12 |
|---|
| Humidity | 80% | 77% | 71% | 75% | 77% | 74% | 72% | 73% | 73% | 79% | 85% | 85% |
|---|
| Day length | 12 | 12 | 12 | 12 | 12 | 13 | 12 | 12 | 12 | 12 | 12 | 12 |
|---|
| Sun hours | 8 | 8 | 9 | 8 | 7 | 7 | 6 | 7 | 7 | 7 | 6 | 6 |
|---|
|
| Colombo |
|---|
|
| Jan | Feb | Mar | Apr | May | Jun | Jul | Aug | Sep | Oct | Nov | Dec |
|---|
| Min temp. | 23 | 24 | 24 | 25 | 26 | 26 | 26 | 26 | 25 | 25 | 24 | 23 |
|---|
| Max temp. | 32 | 32 | 33 | 33 | 32 | 32 | 31 | 31 | 31 | 31 | 31 | 31 |
|---|
| Precip. | 85 | 70 | 100 | 265 | 315 | 205 | 135 | 120 | 275 | 395 | 365 | 175 |
|---|
| Prec. days | 6 | 5 | 7 | 13 | 17 | 16 | 11 | 10 | 16 | 19 | 17 | 10 |
|---|
| Humidity | 73% | 73% | 76% | 79% | 81% | 81% | 80% | 78% | 79% | 81% | 81% | 78% |
|---|
| Day length | 12 | 12 | 12 | 12 | 12 | 12 | 12 | 12 | 12 | 12 | 12 | 12 |
|---|
| Sun hours | 8 | 9 | 9 | 8 | 6 | 6 | 6 | 6 | 6 | 6 | 7 | 7 |
|---|
| Sea temp | 28 | 28 | 29 | 30 | 29 | 28 | 27 | 27 | 28 | 28 | 28 | 28 |
|---|
| Galle |
|---|
|
| Jan | Feb | Mar | Apr | May | Jun | Jul | Aug | Sep | Oct | Nov | Dec |
|---|
| Min temp. | 23 | 24 | 25 | 25 | 26 | 26 | 25 | 25 | 25 | 25 | 24 | 24 |
|---|
| Max temp. | 30 | 31 | 32 | 31 | 30 | 29 | 29 | 29 | 29 | 29 | 30 | 30 |
|---|
| Precip. | 85 | 70 | 90 | 200 | 315 | 185 | 175 | 160 | 260 | 345 | 285 | 175 |
|---|
| Prec. days | 7 | 6 | 7 | 12 | 17 | 17 | 15 | 14 | 17 | 18 | 15 | 11 |
|---|
|
| Day length | 12 | 12 | 12 | 12 | 12 | 12 | 12 | 12 | 12 | 12 | 12 | 12 |
|---|
|
| Sea temp | 28 | 28 | 29 | 30 | 29 | 28 | 28 | 28 | 28 | 28 | 29 | 28 |
|---|
| Hambantota |
|---|
|
| Jan | Feb | Mar | Apr | May | Jun | Jul | Aug | Sep | Oct | Nov | Dec |
|---|
| Min temp. | 23 | 24 | 24 | 25 | 26 | 26 | 25 | 25 | 25 | 25 | 24 | 24 |
|---|
| Max temp. | 31 | 32 | 32 | 32 | 31 | 31 | 32 | 31 | 30 | 31 | 31 | 30 |
|---|
| Precip. | 70 | 45 | 45 | 90 | 75 | 40 | 30 | 60 | 100 | 130 | 220 | 130 |
|---|
| Prec. days | 5 | 4 | 4 | 7 | 7 | 6 | 4 | 6 | 8 | 10 | 13 | 9 |
|---|
| Humidity | 71% | 71% | 72% | 75% | 78% | 77% | 75% | 76% | 77% | 76% | 77% | 76% |
|---|
| Day length | 12 | 12 | 12 | 12 | 12 | 12 | 12 | 12 | 12 | 12 | 12 | 12 |
|---|
| Sun hours | 7 | 7 | 8 | 8 | 8 | 7 | 7 | 6 | 7 | 6 | 6 | 7 |
|---|
| Sea temp | 28 | 28 | 29 | 30 | 29 | 28 | 28 | 28 | 28 | 28 | 29 | 28 |
|---|
| Jaffna |
|---|
|
| Jan | Feb | Mar | Apr | May | Jun | Jul | Aug | Sep | Oct | Nov | Dec |
|---|
| Min temp. | 22 | 22 | 23 | 26 | 28 | 28 | 27 | 27 | 26 | 25 | 24 | 23 |
|---|
| Max temp. | 29 | 31 | 33 | 34 | 33 | 32 | 33 | 32 | 32 | 31 | 30 | 29 |
|---|
| Precip. | 45 | 25 | 40 | 65 | 65 | 20 | 25 | 55 | 80 | 235 | 435 | 275 |
|---|
| Prec. days | 4 | 2 | 4 | 6 | 4 | 2 | 2 | 4 | 5 | 12 | 17 | 12 |
|---|
|
|
| Sun hours | 8 | 9 | 9 | 9 | 8 | 6 | 6 | 7 | 7 | 7 | 6 | 7 |
|---|
| Sea temp | 27 | 28 | 29 | 30 | 30 | 29 | 29 | 29 | 29 | 29 | 29 | 28 |
|---|
| Kandy (450 meters) |
|---|
|
| Jan | Feb | Mar | Apr | May | Jun | Jul | Aug | Sep | Oct | Nov | Dec |
|---|
| Min temp. | 19 | 19 | 20 | 21 | 22 | 22 | 22 | 21 | 21 | 21 | 20 | 20 |
|---|
| Max temp. | 29 | 30 | 32 | 31 | 30 | 29 | 28 | 28 | 29 | 29 | 29 | 28 |
|---|
| Precip. | 105 | 80 | 100 | 190 | 140 | 125 | 110 | 95 | 125 | 305 | 270 | 205 |
|---|
| Prec. days | 8 | 6 | 7 | 13 | 10 | 14 | 12 | 11 | 12 | 18 | 16 | 13 |
|---|
|
|
| Sun hours | 7 | 8 | 9 | 8 | 6 | 6 | 6 | 6 | 6 | 6 | 6 | 6 |
|---|
|
| Mannar |
|---|
|
| Jan | Feb | Mar | Apr | May | Jun | Jul | Aug | Sep | Oct | Nov | Dec |
|---|
| Min temp. | 24 | 24 | 25 | 26 | 27 | 27 | 27 | 26 | 26 | 26 | 25 | 24 |
|---|
| Max temp. | 29 | 31 | 33 | 33 | 32 | 32 | 31 | 31 | 31 | 31 | 30 | 29 |
|---|
| Precip. | 55 | 30 | 35 | 90 | 60 | 5 | 10 | 15 | 55 | 165 | 255 | 175 |
|---|
| Prec. days | 5 | 3 | 4 | 7 | 4 | 2 | 2 | 2 | 3 | 10 | 14 | 11 |
|---|
|
|
|
| Sea temp | 27 | 28 | 29 | 30 | 30 | 29 | 29 | 29 | 29 | 29 | 29 | 28 |
|---|
| Nuwara Eliya (1,900 meters) |
|---|
|
| Jan | Feb | Mar | Apr | May | Jun | Jul | Aug | Sep | Oct | Nov | Dec |
|---|
| Min temp. | 10 | 10 | 11 | 12 | 13 | 14 | 14 | 13 | 13 | 13 | 12 | 12 |
|---|
| Max temp. | 20 | 21 | 22 | 22 | 22 | 19 | 19 | 19 | 20 | 20 | 20 | 19 |
|---|
| Precip. | 115 | 75 | 70 | 135 | 170 | 170 | 155 | 130 | 160 | 245 | 225 | 185 |
|---|
| Prec. days | 10 | 7 | 7 | 13 | 13 | 15 | 16 | 14 | 14 | 19 | 18 | 15 |
|---|
| Humidity | 83% | 79% | 78% | 84% | 86% | 87% | 87% | 85% | 86% | 86% | 85% | 85% |
|---|
| Day length | 12 | 12 | 12 | 12 | 12 | 12 | 12 | 12 | 12 | 12 | 12 | 12 |
|---|
| Sun hours | 5 | 6 | 6 | 5 | 3 | 3 | 2 | 2 | 3 | 4 | 4 | 5 |
|---|
|
| Trincomalee |
|---|
|
| Jan | Feb | Mar | Apr | May | Jun | Jul | Aug | Sep | Oct | Nov | Dec |
|---|
| Min temp. | 24 | 24 | 25 | 26 | 26 | 26 | 26 | 26 | 25 | 24 | 24 | 24 |
|---|
| Max temp. | 29 | 30 | 32 | 33 | 35 | 35 | 35 | 35 | 35 | 32 | 30 | 29 |
|---|
| Precip. | 150 | 95 | 55 | 50 | 70 | 25 | 50 | 65 | 115 | 215 | 375 | 340 |
|---|
| Prec. days | 8 | 5 | 4 | 4 | 4 | 2 | 3 | 4 | 6 | 13 | 18 | 15 |
|---|
| Humidity | 80% | 78% | 78% | 77% | 73% | 67% | 68% | 69% | 71% | 79% | 86% | 86% |
|---|
| Day length | 12 | 12 | 12 | 12 | 12 | 13 | 13 | 12 | 12 | 12 | 12 | 12 |
|---|
| Sun hours | 8 | 10 | 10 | 9 | 8 | 8 | 8 | 8 | 7 | 7 | 6 | 5 |
|---|
| Sea temp | 27 | 28 | 29 | 30 | 30 | 29 | 29 | 29 | 29 | 29 | 29 | 28 |
|---|
See also the
temperatures month by month