Select units of measurement for the temperature and rainfall tables (metric or imperial).
Average weather, temperature, rainfall, sunshine
In Brazil, the largest country in South America, the climate is
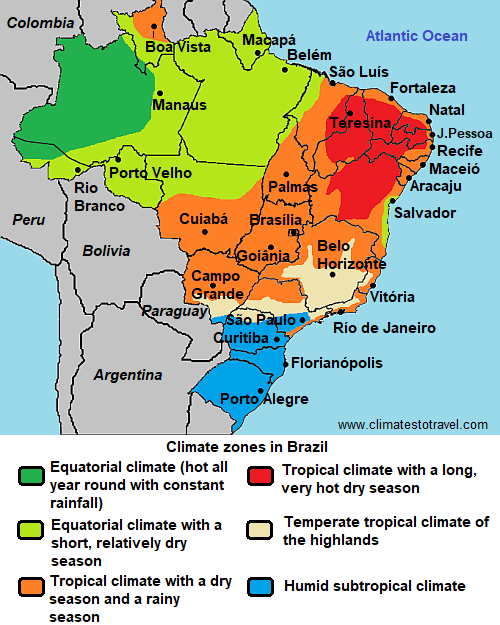
equatorial, hot all year round with constant rain, in the northwest, in the Amazon rainforest, while it is
tropical with a dry season in the centre-south. In the extreme south, on the other hand, the climate is
subtropical, with mild winters (but colder than in the rest of the country) and hot summers.
Northern Brazil is crossed by the
Equator, so in much of the country (which is located south of the Equator), the seasons are reversed in comparison with Europe or North America. In the tropical zone, the peak of the rainy season is typically the austral summer, from December to March.
Precipitation is generally quite abundant, since it exceeds 1,000 millimeters (40 inches) per year in most of the territory, however there is also an arid area, the north-east, where it even drops below 500 mm (20 in) per year. The rainiest area is the Amazon forest, where 2,000 to 2,500 mm (80 to 100 in) of rain typically fall per year.
As regards to the
amount of sunshine, the sunniest area of Brazil is the northeastern coast (see Natal, Fortaleza), where there are almost 3,000 hours of sunshine per year. In the south (see São Paulo), there are generally 1,800 to 2,100 hours of sunshine per year, but in the rainiest areas (see Santos) the amount drops to 1,650 hours. The least sunny area is the western Amazon, where there are generally 1,600 to 1,800 hours of sunshine per year.
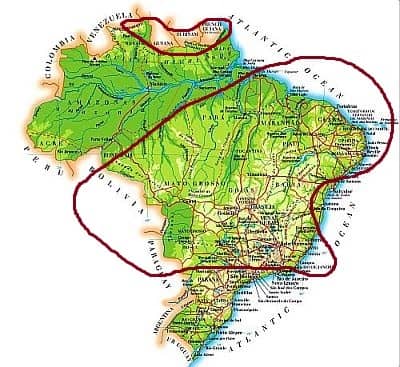
In the following map, we can see the
climate zones in Brazil.
The climate in detail
- Equatorial climate - Amazon rainforest, Manaus, Belém, Salvador de Bahia
- Tropical climate - Boa Vista, Sertão, Fortaleza, Rio de Janeiro, Brasília
- The south - São Paulo, Florianópolis, Porto Alegre, Rio Grande
- Cyclones
- When to go
- What to pack
- Climate data
Equatorial climate
Amazon rainforest
In a large area of northern Brazil, covered by the Amazon rainforest, the climate is equatorial, hot and humid throughout the year, with constant rainfall. The rains fall in the form of heavy showers and thunderstorms, usually in the afternoon or evening. Total annual rainfall is considerable, from 2,000 to 3,000 millimeters (80 to 120 inches). The rains are more abundant from
December to May, when they usually exceed 200 mm (8 in) per month, but they often even exceed 300 mm (12 in).
Within the forest, the temperature remains below 30 °C (86 °F) even during the day, but relative humidity is consistently close to 100%. The cities built in the area, after removing a part of the forest, are a bit warmer because the sun's rays are obviously able to reach the ground.
For example, in
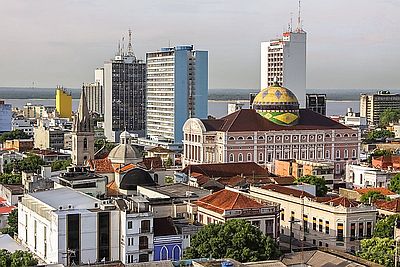
Manaus, capital of the state of Amazonas and located in the middle of the forest, daytime temperatures are around 31/33 °C (88/91 °F) all year round, but they can reach 35/37 °C (95/99 °F) in the hottest days; the air is almost always humid.
Rainfall amounts to 2,300 mm (90 in) per year, including more than 200 mm (8 in) per month from December to May, while from July to September, there's a drier period, with less than 100 mm (4 in) per month.
In
Belém, capital of the state of Pará, it's hot and humid all year round as well, but at least, the city is located near the coast, so it receives a bit of a breeze from the sea.
Here, the rains are more abundant than in Manaus, but the trend is similar, although the least rainy period occurs later, reaching a low from August to November.
If it is true that the
least rainy period is from August to November in the northern part of the Amazon, in the central-southern area it goes from June to September, but, as mentioned, there is no real dry season because heavy rains in the afternoon are always possible, although this happens more rarely in the least rainy season. As a result, the
hours of sunshine in this season increase a bit, even though within the forest their percentage is never so high on average (in Manaus, there is a maximum of 7 hours of sunshine per day from July to September), while on the coast, the amount of sunshine becomes good in the least rainy season.
The city of
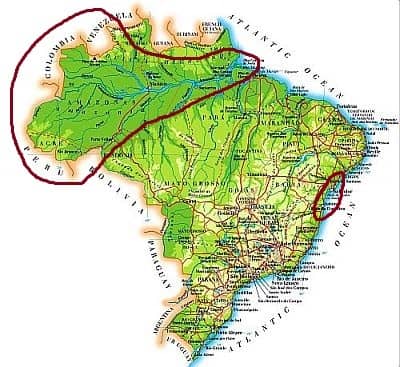
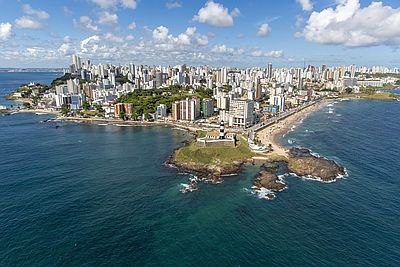
Salvador de Bahia is located in a relatively small area along the eastern coast (see the small circle on the map), where a hot and humid climate, with year-round rains, can also be found. Here, 1,900 mm (75 in) of rain fall per year, and the rains are frequent and abundant especially from April to early August.
Temperatures slightly drop in winter, from June to August, when highs are around 27.5/28 °C (81.5/82.5 °F).
The reason why the rains in this stretch of coast occur throughout the year, is to be found in the trade winds, which pick up moisture over the sea before reaching the coast. However, downpours and thunderstorms don't last long, so the amount of sunshine remains high, especially from September to March, when there are about 7/8 hours of sunshine per day on average.
In Salvador, the sea is warm all year round.
In addition, the sea breeze tempers the heat along the coast even in the warmest months. Therefore, the climate of Salvador de Bahia is better than that of the Amazon forest.
Tropical climate
In this vast area, which includes most of central and southern Brazil, but also a small area north of the Equator, the climate is
tropical, with
a dry season (usually from June to September) and a rainy season (typically in summer, from November to March). In the areas where the dry season is very short, the forest can grow in the same way as in the equatorial zone, otherwise the vegetation will be less dense and savanna-type, with more or less pronounced aridity (presence of shrubs, cacti, etc.).
In the
far north of Brazil, where the
Massif of Guyana is located (see the circled area on the top of the map), we find another area covered by savannah, north of the vast Amazon rainforest. Here we are, albeit slightly,
north of the Equator, so the driest period is reversed, and usually corresponds to the Northern Hemisphere winter.
In the nort of the state of Roraima (see
Boa Vista), on the border with Venezuela and Guyana, the least rainy period is from October to March.
The heat is felt throughout the year; in the dry season, the temperatures are higher, but the humidity is lower.
Further east, in the northern part of the state of Amapá, the least rainy period is shorter and runs from September to November.
Let us now move down to the greater tropical area; we will follow the rainfall pattern along the coast, which in comparison with the interior is more variable, and determines the best time to visit the different areas.
In the Northeast, east of Belém (which, as we said, is still part of the equatorial zone), we find the city of
Sao Luís, where the dry season is from August to November, but after all, the rainfall in December is not heavy and doesn't exceed 75 mm (3 in), and the city of Fortaleza, where the dry season is from August to December, while in both cases the rainfall exceeds 200 millimeters (8 inches) per month from February to April.
In
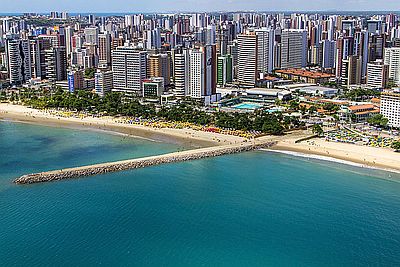
Fortaleza, in the state of Ceará, the year is curiously divided into two, the first part being dry and the second rainy.
The temperature in Fortaleza is high throughout the year, but the heat is tempered by sea breezes. The humidity is higher in the rainy period.
In Fortaleza, the year is curiously divided in two, with the first part rainy and the second dry.
In Fortaleza too, the sea is warm all year round.
Further to the south-east, in
Natal, the dry season is from October to December, but the amount of rainfall is usually acceptable also in September and January. On the contrary, from February to July, more than 200 millimeters (8 inches) of rain fall per month. A similar trend is found in
Recife, where the least rainy period runs from October to January, while in
Maceió and
Aracaju, it goes from October to February.
About 350 kilometers (215 miles) away from the coast, north-east of Natal, lies the
Fernando de Noronha archipelago: here it's hot and muggy throughout the year, with a rainy season from February to July, and a dry season from August to January.
Further south, the coast of the state of Bahia, where Salvador and Ilheus are found, should be excluded because it's part of the equatorial climate zone, of which we have already spoken.
Sertão
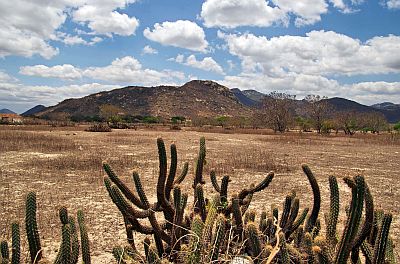
The hottest and driest region of Brazil is located in the northeast, and is called
Sertão, where a dry forest called
caatinga grows. In the inland areas of the states of Tocantins, Maranhão, Piauí, Ceará, Rio Grande do Norte, Parnaíba, Pernambuco, Alagoas, Sergipe and Bahia, at the end of the dry season, from August to October,
temperatures are very high, and there are several locations where the maximum averages in this period reach or exceed 36 °C (97 °F).
In
Teresina, probably the hottest city in Brazil, the maximum temperatures are of 33 °C (91.5 °F) in the least hot period, from February to April, while they reach 37/38 °C (99/100 °F) from September to November.
Rainfall in Teresina amounts to 1,400 mm (55 in) per year, of which more than 100 mm (4 in) per month from December to May.
In the interior of the states of Bahia and Pernambuco (see
Paulo Afonso,
Petrolina), precipitation decreases to 400/500 mm (15/20 in) per year, and there are many days with
intense heat, especially between August and November. However, the rains in the inland areas of the
Nordeste are very irregular, in fact, even though the average is not very high, during some years there may be even torrential rains in the period from November to March.
Anyway, in many areas, the altitude, which ranges between 500 and 1,000 meters (1,600 and 3,300 feet) in many eastern areas, tempers the heat a little.
Further south, we find the area of
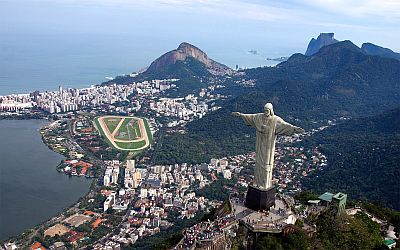
Rio de Janeiro, where the dry season runs from June to August, that is in winter, as happens also in many inland areas of this tropical climate area.
Here, however, we are quite to the south, that is, away enough from the Equator, to experience a
drop in the winter temperatures. In Rio, highs from May to October go down to around 25/27 °C (77/81 °F). The Carnival in Rio de Janeiro takes place in the summer, although the main events take place in the evening.
In Rio de Janeiro, after all you can swim all year round, even though the sea becomes a little cool from July to October, when the water temperature drops to 22 °C (72 °F).
Continuing along the coast, the climate to the south-west of Rio de Janeiro begins to be rainy all year round (see
Santos), however, here we enter the area that has a sub-tropical climate, where winter is cooler (see below).
As regards to the
interior, nearly 900 km (550 mi) away from the sea and about 1,100 meters (3,600 feet) above sea level, we find the federal capital,
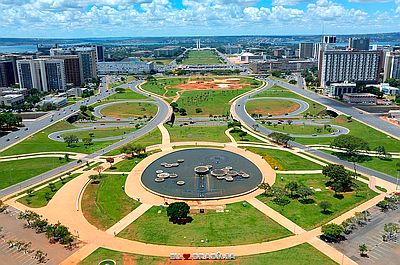
Brasília, which has a pleasantly warm climate all year round due to the altitude. The daytime temperatures range between 27 °C and 30 °C (81 °F and 86 °F) throughout the year. Night temperatures are more variable: they are higher from October to March, while they become quite cool in winter. At times, from May to August, short outbreaks of cold air coming from the south can lower the night temperature to around 8/10 °C (46/50 °F) or even below.
The rainy season runs from October to April, and in particular, the period from November to January is very rainy.
In Brasília, the sunniest period is clearly winter, while in the rainy summer period, the sun shines on average for a few hours a day.
In
Goiânia, located at 750 meters (2,450 ft) above sea level, and at no great distance from the capital, we find a similar climate, though the temperature is slightly higher, and it can be a little hot from September to April.
Belo Horizonte has also a similar climate, since it is located at 850 meters (2,800 ft) above sea level, but its southern location makes it a bit cooler in winter, in fact the daily average in June and July is around 20 °C (68 °F) .
At lower elevations, the heat is felt in inland areas: for example, in
Cuiabá, Mato Grosso, the temperatures can reach 40 °C (104 °F) from August to October, ie in spring, before the rainy season.
South of Cuiabá, we find the
Pantanal, a vast wetland area, with a large biodiversity.
The south
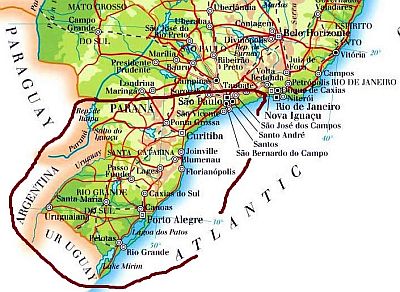
The southernmost part of Brazil (known as "South Region", composed by the states of Paraná, Santa Catarina and Rio Grande do Sul) has a
subtropical climate, and the winter temperatures remind of the Mediterranean climate. During the austral winter, from May to August, southern Brazil can be affected by
cold air masses, which can lower the temperature by several degrees. Instead, in the southern summer, from December to March, it can get very hot, with highs that can reach 38-40 °C (100-104 °F).
Rainfall is well distributed throughout the year: in winter, it is more common and abundant than in regions having a tropical climate, though they are typically not too heavy, but it rains even in summer, so we cannot properly speak of Mediterranean climate.
The megalopolis of
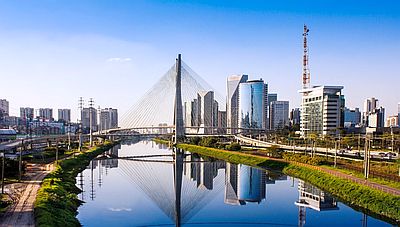
São Paulo, which is located a bit to the north of this area, at 800 meters (2,600 feet) above sea level, is in the boundary between the tropical and the subtropical climate zones: its average temperature ranges from 24.5 °C (76 °F) in January and February to 18 °C (64.5 °F) in June and July. From May to September, sometimes at night the temperature can approach freezing (0 °C or 32 °F), while from September to March, it can sometimes be hot, around 33/35 °C (91/95 °F). Apart from that, temperatures in São Paulo are generally pleasant, but it is a polluted city, and it's often trapped in a pall of smog that can veil or obscure the sun.
The rainy season runs from October to March. The period from June to August, as well as being the coolest, is the least rainy of the year.
In São Paulo, the sun shines on average for a few hours a day throughout the year, but there isn't a very sunny month.
Further south, in
Curitiba, in the state of Paraná, 900 meters (3,000 feet) above sea level, winter is cooler, in fact the average in June and July is 15 °C (59 °F). From May to September, sometimes at night the temperature can drop to the freezing point. In addition, from time to time it can even snow.
In
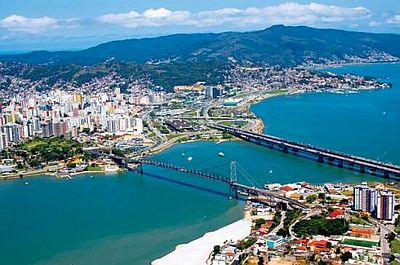
Florianópolis, in the state of Santa Catarina, further south (at a latitude of 27 degrees south) but on the coast, the average temperature ranges from 17.5 °C (63.5 °F) in July to 26 °C (79 °F) in February.
As mentioned, precipitation in the south is quite common even in winter. In Florianópolis, 1,750 mm (69 in) of rain fall per year, with a maximum in summer, from December to March, but with 7/9 days with rain and no less than 75 mm (3 in) per month even in winter. In Florianópolis, the sea is a bit cold in winter, while it is warm enough for swimming from November to April, and particularly warm from January to March.
At the
Iguaçu Falls, on the border with Argentina and Paraguay, the average in July is 17.5 °C (63.5 °F), but sometimes in winter the temperature can drop to 0 °C (32 °F). The rains are frequent throughout the year, with a relative minimum in July and August. Summer, from December to March, is hot and muggy, with sunshine, but also thunderstorms.
Further south, at the thirtieth parallel, we find
Porto Alegre, the capital of Rio Grande do Sul, where the daily average temperature ranges from 15 °C (59 °F) in June and July to 26 °C (79 °F) in February; therefore, summer is still hot (actually, it is a bit warmer than in Florianópolis because of the distance from the sea), but winter is a bit cooler.
At this latitude, thunderstorms in summer are a bit less frequent, and the sun often shines. In winter, disturbances pass more often over the region, so this is even the wettest season, though not by much.
Near Porto Alegre, the sea is warm enough for swimming (though it's not very warm) from December to April, while it becomes quite cold in winter.
In
Rio Grande, at a latitude of 32 ° S, the average temperature in July is 13 °C (55.5 °F). However, summer is still quite hot.
In Rio Grande, the sea temperature is also similar to that of the Mediterranean and is warm enough for swimming only in summer, while in winter, it is cold.
In these cities of the southernmost part of Brazil, the nighttime temperature in winter can drop to 0 °C (32 °F) even at sea level.
In the southern tip of the Rio Grande do Sul (see Santa Vitória do Palmar), the winter averages are around 12 °C (53.5 °F).
In some cities in Brazil, it is not excluded that it may
snow from June to August. They are found in the three southernmost states (Paraná, Santa Catarina and Rio Grande do Sul) and at an altitude above 600 meters (1,900 feet). In addition to the aforementioned city of Curitiba, we can mention Lages (950 meters or 3,115 feet), Sao Joaquim (1,300 meters or 4,250 feet),
Passo Fundo, Bento Gonçalves, Farroupilha and Caxias do Sul.
Hurricanes
Typically, Brazil is not affected by tropical cyclones. In fact, Northern Brazil is not affected by the hurricanes of the North Atlantic (which pass much further to the north), while hurricanes do not normally form in the South Atlantic because the sea is not warm enough.
However, from November to March, tropical storms may occasionally form, usually not intense, in the coastal area around the Tropic of Capricorn (see Vitória, Rio de Janeiro, São Paulo, Santos, Curitiba, Florianópolis, Porto Alegre).
In the last few decades, only once a true tropical cyclone has formed, that is, Hurricane Catarina, which affected the area of Porto Alegre in late March 2004.
When to go
It is difficult to find a suitable period for
all of Brazil, however, you can choose the austral winter, ie from
June to August, in fact, it is usually the coolest, the least rainy and the sunniest time of the year. It must be said that in the inland areas of the north-east this period is very hot, while in the south there may be cold periods; furthermore, in the far south, the winter is rainy. For São Paulo and the south, you can then choose the period from mid-April to mid-May.
Rainfall-wise, there are exceptions even in the north-central, mainly in the coastal areas, so for the
individual zones you can refer to the the climate page. For instance, if you want to explore Salvador de Bahia and hang out at the beaches, you may prefer the period from October to February.
The
sea is warm enough for swimming all year round in north-central Brazil, while it becomes relatively cool from June to October near Rio de Janeiro, and even cold along the coast of Rio Grande do Sul, where it drops to 14 °C (57 °F) in August. Here, the sea temperature becomes acceptable from January to March, around 23/24 °C (73/75 °F).
What to pack
In
winter (June to August): in the Amazon, bring tropics-friendly, loose-fitting clothing, maybe with long sleeves for mosquitoes, and a sweatshirt for the evening. In the north-east, from Natal to the south, bring light clothing, a sweatshirt for the evening, a light scarf for the breeze, and a light sweatshirt and a light raincoat for thunderstorms; you can bring a light scarf and a light sweatshirt for the evening also in Sao Luís and Fortaleza, on for windy evenings. In Rio de Janeiro, bring light clothes for the day, a sweatshirt or sweater and a jacket for the evening, and a raincoat and umbrella. In Brasilia, Sao Paulo, Florianopolis, and the extreme south: clothes for spring and autumn, a sweater, a jacket, and a raincoat or umbrella.
In
summer (December to February): in the forest and the tropical region, down to Rio de Janeiro, bring tropics-friendly, lightweight clothing, possibly a light sweatshirt and a light raincoat for thunderstorms, a sun hat, and possibly a sweater and a scarf for air-conditioned places. In Brasilia, Sao Paulo and the south, bring light clothes, a sweatshirt and a light jacket for the evening, and a raincoat or umbrella.
Climate data - Brazil
| Belém |
|---|
Belém, location on the map |
|---|
| Jan | Feb | Mar | Apr | May | Jun | Jul | Aug | Sep | Oct | Nov | Dec |
|---|
| Min temp. | 24 | 24 | 24 | 24 | 24 | 24 | 24 | 24 | 24 | 24 | 24 | 24 |
|---|
| Max temp. | 31 | 31 | 31 | 31 | 32 | 32 | 32 | 32 | 32 | 32 | 32 | 32 |
|---|
| Precip. | 385 | 400 | 450 | 425 | 300 | 185 | 155 | 135 | 130 | 130 | 125 | 270 |
|---|
| Prec. days | 24 | 24 | 25 | 25 | 23 | 16 | 15 | 12 | 13 | 13 | 13 | 19 |
|---|
| Humidity | 86% | 88% | 88% | 88% | 85% | 82% | 80% | 81% | 81% | 81% | 80% | 83% |
|---|
| Day length | 12 | 12 | 12 | 12 | 12 | 12 | 12 | 12 | 12 | 12 | 12 | 12 |
|---|
| Sun hours | 4 | 4 | 4 | 4 | 6 | 8 | 8 | 9 | 8 | 7 | 6 | 5 |
|---|
| Sea temp | 28 | 28 | 28 | 29 | 28 | 28 | 27 | 27 | 26 | 27 | 27 | 28 |
|---|
| Boa Vista |
|---|
Boa Vista, location on the map |
|---|
| Jan | Feb | Mar | Apr | May | Jun | Jul | Aug | Sep | Oct | Nov | Dec |
|---|
| Min temp. | 24 | 24 | 25 | 25 | 24 | 24 | 24 | 24 | 25 | 25 | 25 | 25 |
|---|
| Max temp. | 33 | 34 | 34 | 34 | 32 | 32 | 31 | 33 | 34 | 35 | 34 | 33 |
|---|
| Precip. | 20 | 20 | 50 | 130 | 270 | 360 | 330 | 220 | 100 | 60 | 60 | 30 |
|---|
| Prec. days | 5 | 3 | 4 | 9 | 19 | 19 | 20 | 14 | 7 | 5 | 5 | 5 |
|---|
| Humidity | 62% | 61% | 59% | 67% | 76% | 79% | 79% | 75% | 68% | 65% | 66% | 65% |
|---|
| Day length | 12 | 12 | 12 | 12 | 12 | 12 | 12 | 12 | 12 | 12 | 12 | 12 |
|---|
| Sun hours | 6 | 5 | 5 | 4 | 4 | 3 | 4 | 5 | 7 | 7 | 7 | 6 |
|---|
|
| Brasília (1,100 meters) |
|---|
Brasília, location on the map |
|---|
| Jan | Feb | Mar | Apr | May | Jun | Jul | Aug | Sep | Oct | Nov | Dec |
|---|
| Min temp. | 19 | 18 | 18 | 18 | 15 | 13 | 12 | 13 | 16 | 18 | 19 | 19 |
|---|
| Max temp. | 28 | 29 | 28 | 28 | 27 | 27 | 27 | 29 | 30 | 30 | 29 | 28 |
|---|
| Precip. | 210 | 185 | 210 | 135 | 30 | 5 | 5 | 25 | 45 | 160 | 225 | 240 |
|---|
| Prec. days | 17 | 14 | 14 | 8 | 3 | 1 | 1 | 2 | 5 | 11 | 17 | 19 |
|---|
| Humidity | 73% | 73% | 75% | 71% | 66% | 61% | 54% | 47% | 48% | 58% | 72% | 74% |
|---|
| Day length | 13 | 13 | 12 | 12 | 11 | 11 | 11 | 12 | 12 | 12 | 13 | 13 |
|---|
| Sun hours | 5 | 6 | 6 | 7 | 8 | 8 | 9 | 8 | 7 | 5 | 5 | 4 |
|---|
|
| Campo Grande (550 meters) |
|---|
Campo Grande, location on the map |
|---|
| Jan | Feb | Mar | Apr | May | Jun | Jul | Aug | Sep | Oct | Nov | Dec |
|---|
| Min temp. | 22 | 22 | 22 | 20 | 17 | 17 | 16 | 18 | 19 | 21 | 21 | 22 |
|---|
| Max temp. | 32 | 32 | 32 | 31 | 29 | 28 | 29 | 31 | 32 | 33 | 32 | 32 |
|---|
| Precip. | 245 | 185 | 145 | 100 | 110 | 45 | 45 | 40 | 80 | 130 | 110 | 230 |
|---|
| Prec. days | 17 | 16 | 14 | 8 | 7 | 5 | 4 | 4 | 6 | 10 | 13 | 17 |
|---|
| Humidity | 74% | 74% | 72% | 68% | 68% | 66% | 58% | 50% | 55% | 64% | 66% | 72% |
|---|
| Day length | 13 | 13 | 12 | 12 | 11 | 11 | 11 | 12 | 12 | 13 | 13 | 13 |
|---|
| Sun hours | 7 | 6 | 7 | 7 | 7 | 7 | 8 | 7 | 6 | 7 | 7 | 6 |
|---|
|
| Cuiabá |
|---|
Cuiabá, location on the map |
|---|
| Jan | Feb | Mar | Apr | May | Jun | Jul | Aug | Sep | Oct | Nov | Dec |
|---|
| Min temp. | 24 | 24 | 24 | 23 | 21 | 19 | 18 | 20 | 23 | 24 | 24 | 24 |
|---|
| Max temp. | 33 | 33 | 33 | 33 | 32 | 32 | 32 | 35 | 36 | 35 | 34 | 33 |
|---|
| Precip. | 250 | 220 | 220 | 120 | 50 | 20 | 15 | 20 | 50 | 115 | 175 | 205 |
|---|
| Prec. days | 17 | 14 | 15 | 10 | 4 | 1 | 1 | 2 | 4 | 8 | 11 | 15 |
|---|
| Humidity | 75% | 75% | 74% | 73% | 70% | 63% | 56% | 46% | 49% | 61% | 67% | 72% |
|---|
| Day length | 13 | 13 | 12 | 12 | 11 | 11 | 11 | 12 | 12 | 12 | 13 | 13 |
|---|
| Sun hours | 5 | 5 | 6 | 7 | 7 | 7 | 8 | 7 | 5 | 6 | 6 | 5 |
|---|
|
| Curitiba (900 meters) |
|---|
Curitiba, location on the map |
|---|
| Jan | Feb | Mar | Apr | May | Jun | Jul | Aug | Sep | Oct | Nov | Dec |
|---|
| Min temp. | 17 | 18 | 16 | 14 | 11 | 10 | 9 | 10 | 12 | 14 | 15 | 16 |
|---|
| Max temp. | 27 | 27 | 26 | 25 | 21 | 21 | 21 | 22 | 23 | 24 | 25 | 27 |
|---|
| Precip. | 220 | 165 | 145 | 95 | 115 | 95 | 110 | 75 | 140 | 140 | 125 | 155 |
|---|
| Prec. days | 15 | 13 | 11 | 8 | 8 | 7 | 7 | 6 | 9 | 11 | 10 | 12 |
|---|
| Humidity | 83% | 83% | 84% | 83% | 83% | 83% | 80% | 77% | 81% | 83% | 80% | 81% |
|---|
| Day length | 14 | 13 | 12 | 12 | 11 | 11 | 11 | 11 | 12 | 13 | 13 | 14 |
|---|
| Sun hours | 5 | 5 | 5 | 5 | 5 | 5 | 5 | 6 | 4 | 4 | 5 | 5 |
|---|
|
| Florianópolis |
|---|
Florianópolis, location on the map |
|---|
| Jan | Feb | Mar | Apr | May | Jun | Jul | Aug | Sep | Oct | Nov | Dec |
|---|
| Min temp. | 22 | 22 | 21 | 19 | 16 | 14 | 13 | 14 | 16 | 18 | 19 | 21 |
|---|
| Max temp. | 30 | 30 | 29 | 27 | 24 | 23 | 22 | 23 | 23 | 25 | 26 | 29 |
|---|
| Precip. | 250 | 200 | 180 | 125 | 135 | 75 | 120 | 75 | 140 | 150 | 150 | 175 |
|---|
| Prec. days | 16 | 15 | 14 | 9 | 9 | 7 | 9 | 7 | 11 | 13 | 13 | 12 |
|---|
| Humidity | 81% | 81% | 81% | 80% | 81% | 82% | 82% | 80% | 81% | 81% | 79% | 79% |
|---|
| Day length | 14 | 13 | 12 | 11 | 11 | 10 | 11 | 11 | 12 | 13 | 14 | 14 |
|---|
| Sun hours | 6 | 6 | 6 | 6 | 6 | 5 | 5 | 5 | 4 | 5 | 6 | 6 |
|---|
| Sea temp | 26 | 26 | 26 | 25 | 22 | 20 | 19 | 19 | 20 | 21 | 23 | 24 |
|---|
| Fortaleza |
|---|
Fortaleza, location on the map |
|---|
| Jan | Feb | Mar | Apr | May | Jun | Jul | Aug | Sep | Oct | Nov | Dec |
|---|
| Min temp. | 25 | 25 | 25 | 24 | 25 | 24 | 24 | 24 | 24 | 25 | 25 | 26 |
|---|
| Max temp. | 31 | 31 | 31 | 31 | 31 | 30 | 30 | 30 | 31 | 31 | 31 | 31 |
|---|
| Precip. | 120 | 205 | 325 | 355 | 255 | 140 | 95 | 20 | 25 | 15 | 10 | 45 |
|---|
| Prec. days | 11 | 15 | 22 | 21 | 19 | 14 | 10 | 5 | 5 | 4 | 3 | 6 |
|---|
| Humidity | 76% | 79% | 81% | 82% | 79% | 77% | 74% | 71% | 70% | 70% | 71% | 72% |
|---|
| Day length | 12 | 12 | 12 | 12 | 12 | 12 | 12 | 12 | 12 | 12 | 12 | 12 |
|---|
| Sun hours | 7 | 7 | 5 | 5 | 7 | 8 | 9 | 10 | 9 | 9 | 9 | 8 |
|---|
| Sea temp | 28 | 28 | 28 | 29 | 28 | 28 | 27 | 27 | 27 | 27 | 27 | 28 |
|---|
| Goiania (800 meters) |
|---|
Goiania, location on the map |
|---|
| Jan | Feb | Mar | Apr | May | Jun | Jul | Aug | Sep | Oct | Nov | Dec |
|---|
| Min temp. | 21 | 21 | 21 | 20 | 17 | 15 | 15 | 17 | 19 | 21 | 21 | 21 |
|---|
| Max temp. | 30 | 31 | 31 | 31 | 30 | 29 | 30 | 32 | 33 | 33 | 31 | 30 |
|---|
| Precip. | 265 | 215 | 205 | 120 | 35 | 10 | 5 | 15 | 45 | 165 | 220 | 270 |
|---|
| Prec. days | 18 | 15 | 15 | 8 | 4 | 1 | 1 | 2 | 5 | 12 | 16 | 19 |
|---|
| Humidity | 74% | 74% | 75% | 71% | 66% | 60% | 51% | 43% | 45% | 58% | 71% | 75% |
|---|
| Day length | 13 | 13 | 12 | 12 | 11 | 11 | 11 | 12 | 12 | 12 | 13 | 13 |
|---|
| Sun hours | 6 | 6 | 7 | 8 | 8 | 9 | 9 | 9 | 7 | 6 | 6 | 6 |
|---|
|
| Macapá |
|---|
Macapá, location on the map |
|---|
| Jan | Feb | Mar | Apr | May | Jun | Jul | Aug | Sep | Oct | Nov | Dec |
|---|
| Min temp. | 24 | 24 | 24 | 24 | 24 | 24 | 24 | 24 | 24 | 24 | 25 | 24 |
|---|
| Max temp. | 32 | 31 | 31 | 32 | 32 | 33 | 33 | 34 | 34 | 34 | 34 | 33 |
|---|
| Precip. | 295 | 345 | 395 | 385 | 320 | 245 | 190 | 90 | 30 | 35 | 70 | 155 |
|---|
| Prec. days | 18 | 19 | 21 | 21 | 21 | 19 | 16 | 9 | 3 | 3 | 4 | 10 |
|---|
| Humidity | 84% | 87% | 87% | 87% | 86% | 83% | 81% | 77% | 74% | 72% | 73% | 78% |
|---|
| Day length | 13 | 13 | 12 | 12 | 11 | 11 | 11 | 11 | 12 | 13 | 13 | 14 |
|---|
| Sun hours | 5 | 4 | 4 | 4 | 5 | 7 | 8 | 9 | 9 | 9 | 8 | 7 |
|---|
| Sea temp | 28 | 28 | 28 | 28 | 28 | 29 | 29 | 29 | 29 | 29 | 29 | 29 |
|---|
| Maceió |
|---|
Maceió, location on the map |
|---|
| Jan | Feb | Mar | Apr | May | Jun | Jul | Aug | Sep | Oct | Nov | Dec |
|---|
| Min temp. | 23 | 23 | 23 | 23 | 22 | 21 | 20 | 20 | 20 | 21 | 22 | 22 |
|---|
| Max temp. | 31 | 31 | 32 | 31 | 29 | 28 | 27 | 28 | 29 | 30 | 31 | 31 |
|---|
| Precip. | 85 | 75 | 115 | 210 | 295 | 355 | 265 | 200 | 120 | 60 | 45 | 40 |
|---|
| Prec. days | 9 | 7 | 10 | 16 | 18 | 22 | 23 | 20 | 13 | 7 | 5 | 6 |
|---|
| Humidity | 79% | 79% | 81% | 83% | 86% | 87% | 86% | 85% | 83% | 81% | 79% | 78% |
|---|
| Day length | 13 | 12 | 12 | 12 | 12 | 12 | 12 | 12 | 12 | 12 | 13 | 13 |
|---|
| Sun hours | 8 | 8 | 7 | 7 | 6 | 5 | 5 | 6 | 6 | 7 | 8 | 8 |
|---|
| Sea temp | 28 | 28 | 28 | 28 | 28 | 27 | 27 | 26 | 26 | 27 | 27 | 27 |
|---|
| Manaus |
|---|
Manaus, location on the map |
|---|
| Jan | Feb | Mar | Apr | May | Jun | Jul | Aug | Sep | Oct | Nov | Dec |
|---|
| Min temp. | 23 | 24 | 24 | 23 | 24 | 23 | 23 | 23 | 24 | 24 | 24 | 24 |
|---|
| Max temp. | 31 | 31 | 31 | 31 | 31 | 32 | 32 | 33 | 34 | 33 | 33 | 31 |
|---|
| Precip. | 285 | 295 | 300 | 320 | 245 | 120 | 75 | 65 | 75 | 105 | 170 | 245 |
|---|
| Prec. days | 19 | 18 | 19 | 18 | 16 | 11 | 7 | 7 | 6 | 8 | 11 | 15 |
|---|
| Humidity | 86% | 86% | 86% | 87% | 86% | 83% | 80% | 77% | 77% | 78% | 81% | 84% |
|---|
| Day length | 12 | 12 | 12 | 12 | 12 | 12 | 12 | 12 | 12 | 12 | 12 | 12 |
|---|
| Sun hours | 4 | 3 | 3 | 4 | 5 | 6 | 7 | 7 | 6 | 5 | 5 | 4 |
|---|
|
| Natal |
|---|
Natal, location on the map |
|---|
| Jan | Feb | Mar | Apr | May | Jun | Jul | Aug | Sep | Oct | Nov | Dec |
|---|
| Min temp. | 24 | 24 | 24 | 24 | 24 | 23 | 22 | 22 | 22 | 23 | 24 | 24 |
|---|
| Max temp. | 31 | 31 | 31 | 31 | 31 | 30 | 29 | 29 | 30 | 30 | 31 | 31 |
|---|
| Precip. | 60 | 95 | 205 | 270 | 235 | 355 | 240 | 135 | 50 | 20 | 30 | 25 |
|---|
| Prec. days | 7 | 8 | 14 | 17 | 15 | 19 | 16 | 14 | 8 | 4 | 4 | 5 |
|---|
| Humidity | 75% | 76% | 78% | 81% | 82% | 83% | 81% | 78% | 76% | 73% | 73% | 74% |
|---|
| Day length | 12 | 12 | 12 | 12 | 12 | 12 | 12 | 12 | 12 | 12 | 12 | 12 |
|---|
| Sun hours | 8 | 8 | 8 | 7 | 7 | 7 | 7 | 8 | 9 | 9 | 9 | 9 |
|---|
| Sea temp | 28 | 28 | 28 | 29 | 28 | 28 | 27 | 27 | 26 | 27 | 27 | 27 |
|---|
| Petrolina (380 meters) |
|---|
Petrolina, location on the map |
|---|
| Jan | Feb | Mar | Apr | May | Jun | Jul | Aug | Sep | Oct | Nov | Dec |
|---|
| Min temp. | 24 | 24 | 24 | 23 | 22 | 21 | 20 | 21 | 22 | 23 | 24 | 24 |
|---|
| Max temp. | 34 | 34 | 34 | 33 | 32 | 31 | 30 | 31 | 33 | 34 | 35 | 34 |
|---|
| Precip. | 90 | 90 | 115 | 45 | 15 | 5 | 5 | 0 | 5 | 10 | 50 | 55 |
|---|
| Prec. days | 6 | 6 | 7 | 3 | 2 | 2 | 1 | 0 | 0 | 1 | 4 | 4 |
|---|
| Humidity | 54% | 56% | 58% | 59% | 59% | 59% | 56% | 52% | 47% | 45% | 49% | 52% |
|---|
| Day length | 13 | 12 | 12 | 12 | 12 | 12 | 12 | 12 | 12 | 12 | 13 | 13 |
|---|
| Sun hours | 8 | 8 | 8 | 8 | 7 | 7 | 8 | 9 | 9 | 9 | 9 | 9 |
|---|
|
| Porto Alegre |
|---|
Porto Alegre, location on the map |
|---|
| Jan | Feb | Mar | Apr | May | Jun | Jul | Aug | Sep | Oct | Nov | Dec |
|---|
| Min temp. | 21 | 21 | 19 | 16 | 13 | 11 | 10 | 11 | 13 | 16 | 17 | 19 |
|---|
| Max temp. | 31 | 31 | 30 | 27 | 23 | 21 | 20 | 22 | 23 | 26 | 28 | 30 |
|---|
| Precip. | 110 | 105 | 90 | 105 | 120 | 140 | 140 | 115 | 140 | 140 | 110 | 100 |
|---|
| Prec. days | 9 | 8 | 8 | 9 | 9 | 9 | 9 | 9 | 10 | 10 | 8 | 8 |
|---|
| Humidity | 74% | 76% | 77% | 79% | 83% | 84% | 82% | 79% | 79% | 77% | 73% | 72% |
|---|
| Day length | 14 | 13 | 12 | 11 | 11 | 10 | 10 | 11 | 12 | 13 | 14 | 14 |
|---|
| Sun hours | 7 | 7 | 7 | 6 | 5 | 4 | 4 | 5 | 5 | 6 | 7 | 7 |
|---|
| Sea temp | 24 | 25 | 25 | 23 | 20 | 18 | 16 | 16 | 17 | 18 | 21 | 23 |
|---|
| Porto Velho |
|---|
Porto Velho, location on the map |
|---|
| Jan | Feb | Mar | Apr | May | Jun | Jul | Aug | Sep | Oct | Nov | Dec |
|---|
| Min temp. | 23 | 23 | 24 | 24 | 23 | 22 | 21 | 22 | 23 | 23 | 23 | 23 |
|---|
| Max temp. | 31 | 31 | 31 | 32 | 31 | 32 | 33 | 34 | 34 | 33 | 32 | 31 |
|---|
| Precip. | 320 | 315 | 275 | 250 | 125 | 50 | 25 | 35 | 120 | 195 | 225 | 320 |
|---|
| Prec. days | 19 | 19 | 20 | 17 | 11 | 4 | 3 | 4 | 11 | 13 | 16 | 19 |
|---|
| Humidity | 87% | 87% | 87% | 86% | 84% | 79% | 72% | 69% | 74% | 80% | 84% | 86% |
|---|
| Day length | 13 | 12 | 12 | 12 | 12 | 12 | 12 | 12 | 12 | 12 | 12 | 13 |
|---|
| Sun hours | 3 | 4 | 4 | 5 | 6 | 8 | 8 | 8 | 6 | 5 | 5 | 4 |
|---|
|
| Rio De Janeiro |
|---|
Rio De Janeiro, location on the map |
|---|
| Jan | Feb | Mar | Apr | May | Jun | Jul | Aug | Sep | Oct | Nov | Dec |
|---|
| Min temp. | 24 | 24 | 24 | 23 | 21 | 20 | 19 | 19 | 20 | 21 | 22 | 23 |
|---|
| Max temp. | 31 | 31 | 30 | 29 | 26 | 26 | 25 | 26 | 26 | 27 | 28 | 30 |
|---|
| Precip. | 135 | 130 | 135 | 95 | 70 | 45 | 40 | 45 | 55 | 85 | 100 | 135 |
|---|
| Prec. days | 11 | 7 | 8 | 9 | 6 | 6 | 4 | 5 | 7 | 9 | 10 | 11 |
|---|
| Humidity | 77% | 76% | 79% | 78% | 78% | 78% | 78% | 76% | 77% | 77% | 79% | 78% |
|---|
| Day length | 13 | 13 | 12 | 12 | 11 | 11 | 11 | 11 | 12 | 13 | 13 | 14 |
|---|
| Sun hours | 7 | 7 | 7 | 6 | 6 | 6 | 6 | 6 | 5 | 5 | 6 | 6 |
|---|
| Sea temp | 26 | 26 | 26 | 26 | 24 | 23 | 22 | 22 | 22 | 22 | 24 | 25 |
|---|
| Rio Grande |
|---|
Rio Grande, location on the map |
|---|
| Jan | Feb | Mar | Apr | May | Jun | Jul | Aug | Sep | Oct | Nov | Dec |
|---|
| Min temp. | 20 | 20 | 19 | 16 | 13 | 10 | 9 | 10 | 12 | 15 | 17 | 19 |
|---|
| Max temp. | 28 | 28 | 27 | 24 | 21 | 18 | 17 | 18 | 19 | 22 | 24 | 27 |
|---|
| Precip. | 100 | 130 | 90 | 120 | 115 | 115 | 125 | 120 | 115 | 100 | 95 | 85 |
|---|
| Prec. days | 8 | 8 | 8 | 8 | 8 | 8 | 8 | 8 | 9 | 8 | 7 | 7 |
|---|
| Humidity | 80% | 80% | 81% | 82% | 85% | 86% | 85% | 84% | 83% | 81% | 79% | 78% |
|---|
| Day length | 14 | 13 | 12 | 11 | 10 | 10 | 10 | 11 | 12 | 13 | 14 | 14 |
|---|
| Sun hours | 8 | 7 | 7 | 6 | 5 | 4 | 5 | 5 | 5 | 6 | 7 | 8 |
|---|
| Sea temp | 24 | 24 | 24 | 22 | 18 | 16 | 14 | 14 | 15 | 17 | 19 | 22 |
|---|
| Salvador |
|---|
Salvador, location on the map |
|---|
| Jan | Feb | Mar | Apr | May | Jun | Jul | Aug | Sep | Oct | Nov | Dec |
|---|
| Min temp. | 25 | 25 | 25 | 25 | 24 | 23 | 22 | 22 | 23 | 24 | 24 | 25 |
|---|
| Max temp. | 31 | 31 | 31 | 30 | 29 | 28 | 28 | 28 | 28 | 29 | 30 | 30 |
|---|
| Precip. | 75 | 115 | 165 | 280 | 295 | 225 | 205 | 115 | 95 | 100 | 115 | 125 |
|---|
| Prec. days | 10 | 12 | 15 | 18 | 21 | 20 | 20 | 16 | 13 | 11 | 12 | 11 |
|---|
| Humidity | 76% | 76% | 77% | 78% | 79% | 79% | 78% | 78% | 77% | 77% | 78% | 77% |
|---|
| Day length | 13 | 12 | 12 | 12 | 12 | 11 | 12 | 12 | 12 | 12 | 13 | 13 |
|---|
| Sun hours | 8 | 8 | 7 | 6 | 6 | 6 | 6 | 7 | 7 | 7 | 7 | 7 |
|---|
| Sea temp | 28 | 28 | 28 | 28 | 28 | 27 | 26 | 26 | 26 | 26 | 27 | 27 |
|---|
| Santarém |
|---|
Santarém, location on the map |
|---|
| Jan | Feb | Mar | Apr | May | Jun | Jul | Aug | Sep | Oct | Nov | Dec |
|---|
| Min temp. | 24 | 24 | 24 | 24 | 24 | 24 | 23 | 24 | 25 | 25 | 25 | 25 |
|---|
| Max temp. | 31 | 30 | 30 | 30 | 30 | 31 | 31 | 32 | 33 | 33 | 33 | 32 |
|---|
| Precip. | 195 | 275 | 385 | 345 | 275 | 150 | 130 | 65 | 60 | 55 | 70 | 120 |
|---|
| Prec. days | 16 | 18 | 22 | 21 | 22 | 16 | 12 | 8 | 7 | 5 | 5 | 10 |
|---|
| Humidity | 80% | 82% | 83% | 84% | 84% | 82% | 80% | 76% | 72% | 71% | 73% | 74% |
|---|
| Day length | 12 | 12 | 12 | 12 | 12 | 12 | 12 | 12 | 12 | 12 | 12 | 12 |
|---|
| Sun hours | 5 | 4 | 4 | 4 | 5 | 6 | 7 | 8 | 7 | 7 | 6 | 5 |
|---|
|
| Sao Luís |
|---|
Sao Luís, location on the map |
|---|
| Jan | Feb | Mar | Apr | May | Jun | Jul | Aug | Sep | Oct | Nov | Dec |
|---|
| Min temp. | 25 | 24 | 24 | 24 | 24 | 24 | 24 | 25 | 25 | 26 | 26 | 26 |
|---|
| Max temp. | 31 | 31 | 31 | 31 | 31 | 32 | 32 | 32 | 32 | 33 | 33 | 32 |
|---|
| Precip. | 245 | 375 | 430 | 475 | 315 | 175 | 130 | 30 | 25 | 10 | 10 | 75 |
|---|
| Prec. days | 13 | 17 | 23 | 22 | 20 | 13 | 10 | 4 | 2 | 1 | 1 | 4 |
|---|
| Humidity | 79% | 82% | 84% | 84% | 82% | 80% | 78% | 75% | 72% | 71% | 71% | 73% |
|---|
| Day length | 12 | 12 | 12 | 12 | 12 | 12 | 12 | 12 | 12 | 12 | 12 | 12 |
|---|
| Sun hours | 5 | 4 | 3 | 4 | 5 | 7 | 8 | 8 | 8 | 8 | 8 | 7 |
|---|
| Sea temp | 28 | 28 | 28 | 29 | 29 | 28 | 28 | 28 | 27 | 27 | 28 | 28 |
|---|
| Sao Paulo (800 meters) |
|---|
Sao Paulo, location on the map |
|---|
| Jan | Feb | Mar | Apr | May | Jun | Jul | Aug | Sep | Oct | Nov | Dec |
|---|
| Min temp. | 20 | 20 | 19 | 18 | 15 | 14 | 13 | 14 | 15 | 17 | 17 | 19 |
|---|
| Max temp. | 29 | 29 | 28 | 26 | 24 | 23 | 23 | 25 | 26 | 27 | 27 | 28 |
|---|
| Precip. | 240 | 215 | 160 | 75 | 75 | 55 | 45 | 40 | 80 | 125 | 145 | 200 |
|---|
| Prec. days | 18 | 16 | 13 | 9 | 9 | 6 | 7 | 7 | 9 | 11 | 13 | 16 |
|---|
| Humidity | 75% | 74% | 75% | 74% | 74% | 73% | 70% | 68% | 71% | 74% | 74% | 74% |
|---|
| Day length | 13 | 13 | 12 | 12 | 11 | 11 | 11 | 11 | 12 | 13 | 13 | 14 |
|---|
| Sun hours | 6 | 6 | 5 | 6 | 6 | 6 | 6 | 6 | 5 | 5 | 5 | 5 |
|---|
|
| Teresina |
|---|
Teresina, location on the map |
|---|
| Jan | Feb | Mar | Apr | May | Jun | Jul | Aug | Sep | Oct | Nov | Dec |
|---|
| Min temp. | 24 | 24 | 24 | 24 | 24 | 24 | 23 | 23 | 24 | 25 | 25 | 25 |
|---|
| Max temp. | 34 | 33 | 33 | 33 | 33 | 34 | 35 | 36 | 37 | 38 | 37 | 36 |
|---|
| Precip. | 180 | 270 | 300 | 270 | 115 | 25 | 10 | 10 | 10 | 20 | 75 | 120 |
|---|
| Prec. days | 11 | 15 | 19 | 16 | 10 | 3 | 1 | 1 | 2 | 2 | 4 | 7 |
|---|
| Humidity | 74% | 78% | 81% | 81% | 77% | 69% | 61% | 54% | 51% | 52% | 57% | 63% |
|---|
| Day length | 12 | 12 | 12 | 12 | 12 | 12 | 12 | 12 | 12 | 12 | 12 | 12 |
|---|
| Sun hours | 6 | 5 | 5 | 6 | 8 | 9 | 10 | 10 | 9 | 9 | 8 | 6 |
|---|
|
| Vitória |
|---|
Vitória, location on the map |
|---|
| Jan | Feb | Mar | Apr | May | Jun | Jul | Aug | Sep | Oct | Nov | Dec |
|---|
| Min temp. | 24 | 24 | 24 | 23 | 20 | 19 | 19 | 19 | 20 | 22 | 22 | 24 |
|---|
| Max temp. | 32 | 33 | 32 | 31 | 29 | 28 | 28 | 28 | 28 | 29 | 30 | 31 |
|---|
| Precip. | 130 | 80 | 140 | 125 | 90 | 70 | 70 | 60 | 65 | 125 | 235 | 200 |
|---|
| Prec. days | 9 | 7 | 9 | 8 | 7 | 7 | 7 | 7 | 8 | 9 | 12 | 11 |
|---|
| Humidity | 77% | 77% | 79% | 79% | 78% | 80% | 79% | 77% | 76% | 77% | 80% | 79% |
|---|
| Day length | 13 | 13 | 12 | 12 | 11 | 11 | 11 | 12 | 12 | 13 | 13 | 13 |
|---|
| Sun hours | 7 | 8 | 7 | 6 | 6 | 6 | 6 | 6 | 5 | 5 | 5 | 5 |
|---|
| Sea temp | 26 | 27 | 27 | 27 | 25 | 24 | 24 | 23 | 23 | 24 | 25 | 25 |
|---|
See also the
temperatures month by month