Select units of measurement for the temperature and rainfall tables (metric or imperial).
Average weather, temperature, rainfall, sunshine
In Bolivia, there are
different types of climate depending on area and altitude. In plains and lowlands, the climate is
almost equatorial (i.e. hot all year round and with a short dry season) in the far north and
tropical (i.e. with a longer dry season, which is also cooler) in the center-south. In the plateau and the Andean mountain peaks, the climate is instead
colder and generally quite arid.
Bolivia lies in the Southern Hemisphere, albeit at tropical latitudes, so its seasons are reversed in comparison with the Northern Hemisphere.
The climate in detail
The forest
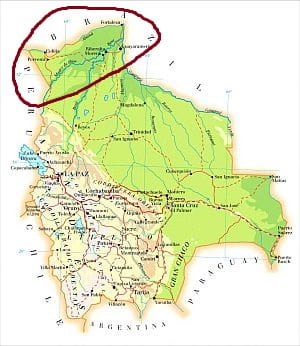
The northernmost area of Bolivia (see the Pando department and the northern parts of Beni and La Paz departments) is covered by rainforests, and has a
nearly equatorial climate. In fact, it is hot and humid all year round, with little variation in temperature, just a few of degrees, from 24 °C (75 °F) in the coldest months to 27 °C (81 °F) in the warmest months. In addition, there is abundant rainfall, higher than 1,500 millimeters (60 inches) per year, and a short dry season from
June to August, when less than 50 mm (2 in) of rain fall per month. The rains are most abundant from November to March.
Cobija
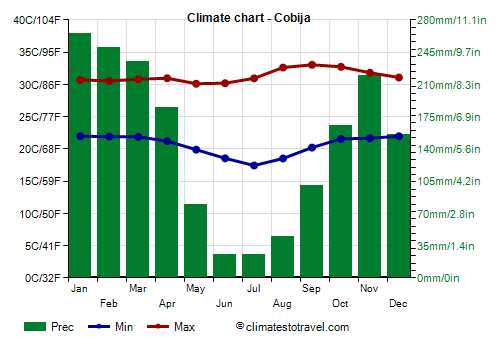
For example, in
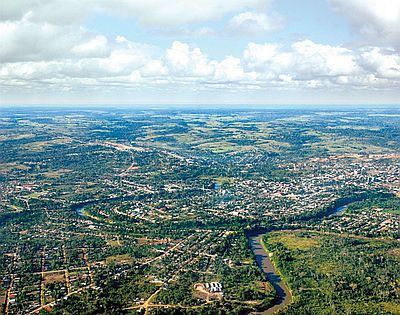
Cobija, in the far north, near the border with Brazil, 1,850 mm (73 in) of rain fall per year, while in
Riberalta, further east, 1,900 mm (75 in) fall.
The best time to visit this area runs from June to mid-August, which is not only the driest, but also the least hot: it's hot in the daytime, around 30/32 °C (86/90 °F), but at night, the temperature usually drops slightly below 20 °C (68 °F), in addition, moisture is a bit lower, so the heat is more bearable.
It must be said that sometimes, from April to September,
cool air masses from the Argentine pampas can lower the night temperature to around 10 °C (50 °F). Instead, from mid-August to mid-October, before the rainy season, the temperature increases and
the hottest time of the year occurs.
The sun frequently shines in the dry season, while it shines a bit less in the rainy season.
The savanna
Gran Chaco
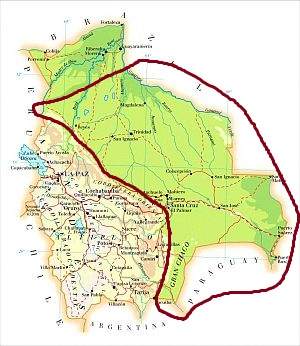
In the rest of the plains and lowlands of Bolivia, we find the
Gran Chaco, a region which also includes southwestern Mato Grosso in Brazil, western Paraguay and northern Argentina. Here, the climate is
tropical, with a dry season in winter and a wet season in summer, and the vegetation is savannah-type.
During
winter, the temperature drops by a few degrees, especially in the center and south: the average temperature in June and July is 23 °C (73 °F) in Trinidad, 22 °C (71.5 °F) in
Puerto Suarez, and it drops to 15/16 °C (59/61 °F) in the extreme south (see
Yacuiba), also because of the altitude, which in this area is higher, around 600/700 meters (2,000/2,300 feet) on average.
As typically happens in the tropics, this area is hottest in
spring, before the rainy season; in fact, heat spikes, from 37 to 40 °C (99 to 104 °F), are recorded from September to November. Summer is sultry, so the heat in this season is still uncomfortable.
Rainfall is more abundant in the western part, near the eastern range (
Cordillera Oriental) of the Andes: along the northeast-facing slopes at the foot of the Andes, there is no real dry season because even in winter some showers are possible (see Rurrenabaque).
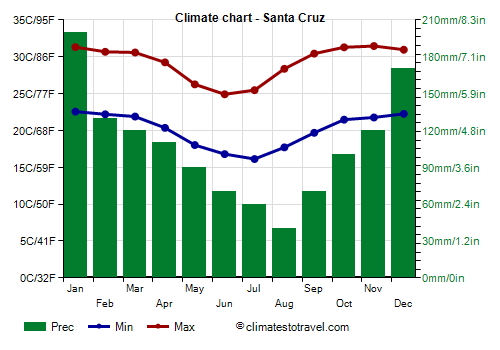
Santa Cruz de la Sierra
In
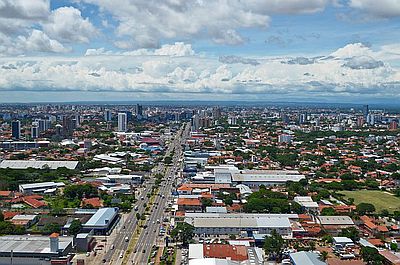
Santa Cruz de la Sierra, located in the central part, at 400 meters (1,300 feet) above sea level, temperatures are high for most of the year, but they drop by a few degrees from May to mid-August.
Rainfall amounts to 1,300 mm (50 in) per year.
In Santa Cruz, the sun frequently shines all year round, with a peak in August, that is, in the driest month and at the end of winter.
In the
southern part, south of Santa Cruz de la Sierra, the climate is
more arid: the annual rainfall is lower than 1,000 mm (40 in) per year, in addition, the dry season is longer, since it goes from May to September (instead of June to August, as happens in the north-central). In this southern area, which is further away from the Equator, thermal variations also increase: from September to November, the temperature can reach 40 °C (104 °F), while between May and August, at night, it can drop to as low as the freezing point (0 °C or 32 °F).
In fact, during winter, from May to August, the central and southern part of the region are affected by
sudden drops in temperature due to cold winds blowing from the Argentinian Pampas, called
Surazos. In Santa Cruz de la Sierra, the night temperature may fall between 5 °C and 10 °C (41 °F and 50 °F), but sometimes even below 5 °C (41 °F), especially in June and July. In the south, night minima can drop at times to as low as a few degrees below freezing. These cold winter outbreaks are short, but they are significant for the latitude (we are still north of the Tropic of Capricorn).
The Andes
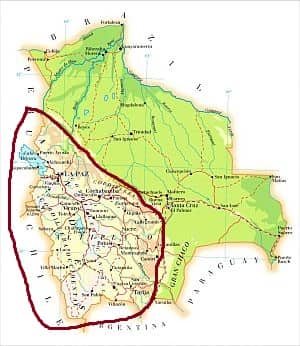
The Andean area is delimited by
two mountain ranges (
cordilleras), between which there is a
plateau where you will find the two capitals and other major cities of Bolivia. The western cordillera is much drier than the eastern one. The plateau is fairly dry, and in the south-west, near the border with Chile, it is even desert.
In the Andean region, there are
high mountains, such as Sajama volcano, 6,542 meters (21,463 feet) high, Janq'u Uma, 6,427 meters (21,086 ft), Nevado Illampu, 6,368 meters (20,892 ft), and Illimani, 6,402 meters (21,004 ft).
Winter in the high mountains is dry, however, in winter and early spring, short snowfalls are possible above 4,000 meters (13,000 ft). Owing to the scarcity of snowfall in the coldest season, the snowline is very high, above 5,000 meters (16,400 ft).
In general, in the plateau, the
diurnal temperature range is high, and after the sunset, the air cools quickly. Being that the air is dry, the cold is more bearable, except when the wind blows.
La Paz
The capital
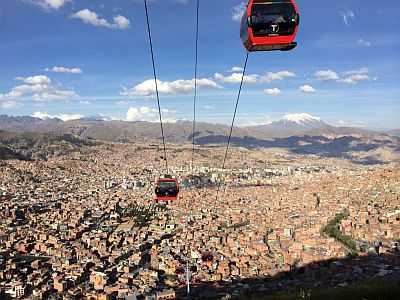
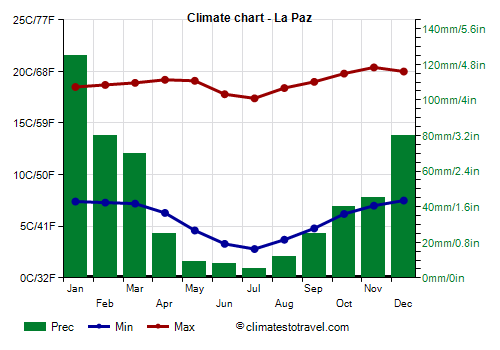
La Paz is the highest capital in the world: it is located at an average altitude of 3,600 meters (11,800 ft), but the various districts are located at an altitude between 3,200 and 4,200 meters (10,500 and 13,800 ft), so there are different temperatures from area to area.
The airport is located in the highest area (
El Alto), at 4,050 meters (13,300 ft) above sea level. In this part of the city, the climate is
cold all year round: the average daily temperature ranges from a low of 5 °C (41 °F) in July to a high of 10 °C (50 °F) in November (which is, albeit slightly, the warmest month because rain and clouds are able to lower the summer temperature a little). At the airport, night temperatures easily drop below freezing in the coldest months, from May to September, with peaks of -10 °C (14 °F), while during the day, the temperature becomes fairly mild, from 14 °C to 16 °C (57 °F to 61 °F). In the summer months, the night temperature rises by several degrees.
Annual rainfall is around 560 mm (22 in), but since the average temperature is never warm enough for trees to grow, the vegetation is
tundra, like in sub-polar areas. The rains mostly fall from September to April, with a peak from December to March, when they are more frequent (up to 20 days per month) and can sometimes be heavy, causing landslides.
The sun frequently shines from May to August, while it shines more rarely in the rainy season, when there can be morning mists as well.
At lower elevations, in the
central part of the city, the temperature is higher by a few degrees, and that's something, since daytime temperatures fluctuate between 17.5 and 20 °C (63 and 68 °F), and winter frosts are quite rare.
The best time to visit La Paz is from
May to August, since it is the driest and sunniest, although it is also the coldest.
Lake Titicaca
West of La Paz, at no great distance from the city, we find
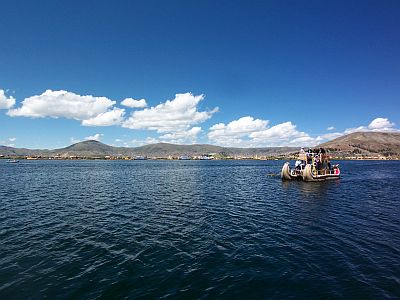
Lake Titicaca, which is located at 3,800 meters (12,500 ft) above sea level and is the highest navigable lake in the world. To the south, we find the archeological site of
Tiwanaku (or Tiahuanaco), located at the same altitude.
In this area, the climate is similar to that of the highest part of La Paz, but there is often a higher temperature range; in fact, while during the day the air is mild, the temperature rapidly falls after sunset, especially in winter, when at night, it drops below freezing.
Sucre
The other capital,
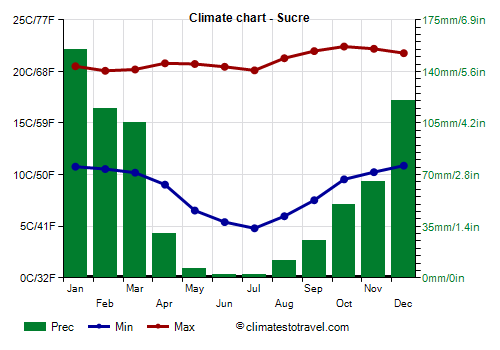
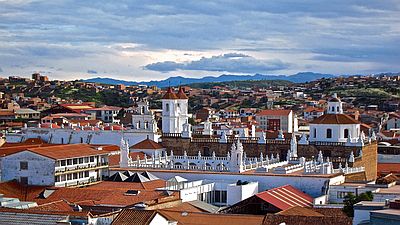
Sucre, is located further south, at an altitude of 2,800 meters (9,200 ft). Here, compared with La Paz, the temperatures are higher, and they are spring-like all year round. However, at night, it is often cold in winter, since lows hover around 5/6 °C (41/43 °F) in the June-August period and around 11 °C (52 °F) from December to March, while the daytime temperatures hover around 20/22 °C (68/72 °F) throughout the year.
In an average year, 680 mm (26.5 in) of rain fall. Summer is the rainiest season here as well; consequently, the best time is winter, from May to August.
In Sucre too, the amount of sunshine is better in the dry winter season than in the rainy summer season.
Cochabamba
In
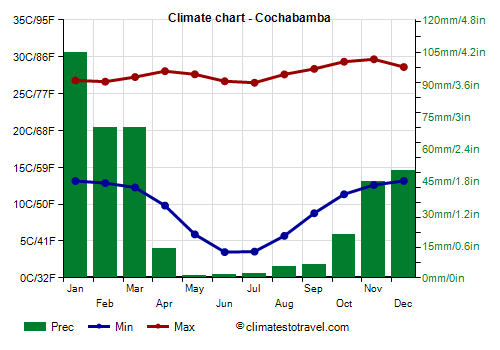
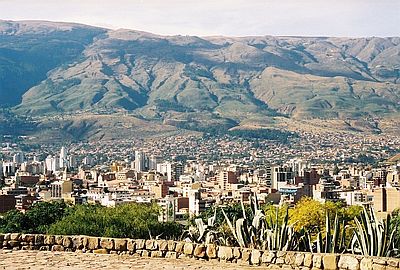
Cochabamba, located at 2,500 meters (8,200 ft) above sea level, the average temperatures are slightly higher. During the day, they are between 26 °C and 30 °C (79 °F and 86 °F) throughout the year, but the diurnal temperature range is high, and nights are cold from May to August.
In Cochabamba, rainfall amounts to only 550 mm (21.5 in) per year, and the dry season is very long; the rains are substantial only from December to March.
In Cochabamba too, the sun shines more often in the dry season than in the rainy season.
Salar de Uyuni
As mentioned, in the
southwest, near the border with Chile, the plateau is definitely
desert. Here, we find
Salar de Uyuni, a huge expanse of salt, located at 3,650 meters (12,000 feet) of altitude, where the tropical mountain sun, already strong, increases its effects because of its reflection on the white surface: it's better to bring sunglasses and sunscreen.
In
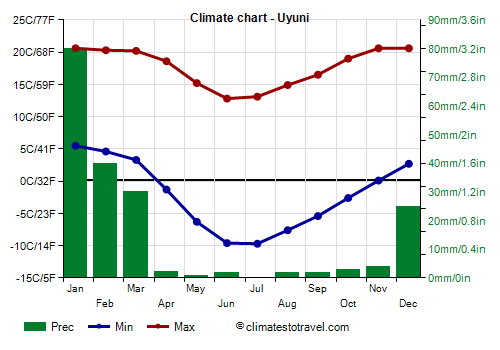
Uyuni, located at 3,650 meters (12,000 feet) above sea level, from May to September, the temperature falls at night, and normally drops below freezing.
Here, just 190 mm (7.5 in) of rain fall per year, concentrated from November to March.
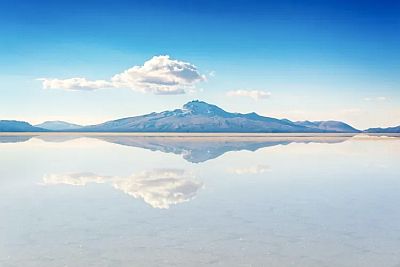
This area can be visited all year round. In winter, however, it gets cold, especially after sunset. In summer, a day of bad weather can happen, but the temperatures are higher, and the light layer of water creates the spectacular mirror effect on the surface.
When to go
The best time to visit Bolivia in its entirety runs from
June to mid-August: even though it's the coldest period at high altitudes, it's also the least hot at low altitudes, and above all, it's the driest and sunniest throughout the country.
What to pack
In
winter (June to August): in the forest, bring lightweight clothing of natural fibers, maybe with long sleeves for mosquitoes, and a sweatshirt for the evening. In the savannah, light clothing, a sweatshirt or sweater and a jacket for the evening, especially in the south. In the Andes (see La Paz, Lake Titicaca), bring clothes for spring and autumn for the day and warm clothes for the evening such as a warm jacket and a warm windproof hat; sunglasses and sunscreen. In high mountains, warm clothes, such as a down jacket, a scarf, gloves, and hiking boots.
In
summer (December to February): in the forest and the savannah, bring lightweight clothing, a sun hat, and possibly a light sweatshirt and a light raincoat for thunderstorms. In the Andes (La Paz, Lake Titicaca), clothes for spring and autumn, a raincoat or umbrella, a jacket, a sweater, sunglasses and sunscreen. In high mountains, warm clothes, such as a down jacket, a scarf, gloves, and hiking boots.
Climate data - Bolivia
| Cobija (200 meters) |
|---|
|
| Jan | Feb | Mar | Apr | May | Jun | Jul | Aug | Sep | Oct | Nov | Dec |
|---|
| Min temp. | 22 | 22 | 22 | 21 | 20 | 19 | 17 | 19 | 20 | 22 | 22 | 22 |
|---|
| Max temp. | 31 | 31 | 31 | 31 | 30 | 30 | 31 | 33 | 33 | 33 | 32 | 31 |
|---|
| Precip. | 265 | 250 | 235 | 185 | 80 | 25 | 25 | 45 | 100 | 165 | 220 | 155 |
|---|
| Prec. days | 19 | 17 | 18 | 13 | 8 | 4 | 3 | 5 | 7 | 12 | 15 | 18 |
|---|
| Humidity | 84% | 85% | 84% | 82% | 80% | 77% | 70% | 66% | 69% | 75% | 79% | 82% |
|---|
| Day length | 13 | 12 | 12 | 12 | 12 | 12 | 12 | 12 | 12 | 12 | 13 | 13 |
|---|
| Sun hours | 6 | 5 | 5 | 6 | 7 | 7 | 8 | 8 | 7 | 6 | 6 | 6 |
|---|
|
| Cochabamba (2,600 meters) |
|---|
|
| Jan | Feb | Mar | Apr | May | Jun | Jul | Aug | Sep | Oct | Nov | Dec |
|---|
| Min temp. | 13 | 13 | 12 | 10 | 6 | 4 | 4 | 6 | 9 | 11 | 13 | 13 |
|---|
| Max temp. | 27 | 27 | 27 | 28 | 28 | 27 | 26 | 28 | 28 | 29 | 30 | 29 |
|---|
| Precip. | 105 | 70 | 70 | 15 | 0 | 0 | 0 | 5 | 5 | 20 | 45 | 50 |
|---|
| Prec. days | 18 | 14 | 11 | 4 | 1 | 1 | 1 | 2 | 3 | 6 | 8 | 13 |
|---|
| Humidity | 62% | 64% | 61% | 53% | 47% | 45% | 43% | 42% | 44% | 45% | 47% | 55% |
|---|
| Day length | 13 | 13 | 12 | 12 | 11 | 11 | 11 | 12 | 12 | 12 | 13 | 13 |
|---|
| Sun hours | 5 | 6 | 6 | 7 | 8 | 8 | 8 | 9 | 8 | 7 | 6 | 6 |
|---|
|
| El Alto (4,050 meters) |
|---|
|
| Jan | Feb | Mar | Apr | May | Jun | Jul | Aug | Sep | Oct | Nov | Dec |
|---|
| Min temp. | 4 | 4 | 3 | 1 | -2 | -4 | -4 | -3 | -1 | 1 | 2 | 4 |
|---|
| Max temp. | 15 | 15 | 15 | 15 | 15 | 14 | 14 | 15 | 16 | 16 | 17 | 16 |
|---|
| Precip. | 120 | 100 | 70 | 30 | 10 | 5 | 5 | 10 | 30 | 40 | 50 | 90 |
|---|
| Prec. days | 22 | 17 | 16 | 10 | 3 | 2 | 2 | 4 | 7 | 11 | 13 | 17 |
|---|
| Humidity | 75% | 76% | 74% | 66% | 48% | 44% | 44% | 47% | 54% | 58% | 58% | 67% |
|---|
| Day length | 13 | 13 | 12 | 12 | 11 | 11 | 11 | 12 | 12 | 12 | 13 | 13 |
|---|
| Sun hours | 6 | 6 | 5 | 6 | 7 | 8 | 8 | 7 | 6 | 6 | 6 | 6 |
|---|
|
| La Paz (3,600 meters) |
|---|
|
| Jan | Feb | Mar | Apr | May | Jun | Jul | Aug | Sep | Oct | Nov | Dec |
|---|
| Min temp. | 7 | 7 | 7 | 6 | 5 | 3 | 3 | 4 | 5 | 6 | 7 | 8 |
|---|
| Max temp. | 18 | 19 | 19 | 19 | 19 | 18 | 17 | 18 | 19 | 20 | 20 | 20 |
|---|
| Precip. | 125 | 80 | 70 | 25 | 10 | 10 | 5 | 10 | 25 | 40 | 45 | 80 |
|---|
| Prec. days | 21 | 17 | 15 | 9 | 4 | 2 | 2 | 4 | 7 | 11 | 11 | 16 |
|---|
|
| Day length | 13 | 13 | 12 | 12 | 11 | 11 | 11 | 12 | 12 | 12 | 13 | 13 |
|---|
| Sun hours | 5 | 6 | 5 | 6 | 8 | 8 | 8 | 8 | 8 | 7 | 6 | 6 |
|---|
|
| Santa Cruz (400 meters) |
|---|
|
| Jan | Feb | Mar | Apr | May | Jun | Jul | Aug | Sep | Oct | Nov | Dec |
|---|
| Min temp. | 23 | 22 | 22 | 20 | 18 | 17 | 16 | 18 | 20 | 21 | 22 | 22 |
|---|
| Max temp. | 31 | 31 | 31 | 29 | 26 | 25 | 25 | 28 | 30 | 31 | 31 | 31 |
|---|
| Precip. | 200 | 130 | 120 | 110 | 90 | 70 | 60 | 40 | 70 | 100 | 120 | 170 |
|---|
| Prec. days | 12 | 9 | 10 | 8 | 7 | 7 | 5 | 3 | 5 | 6 | 7 | 12 |
|---|
| Humidity | 72% | 74% | 73% | 72% | 73% | 72% | 63% | 55% | 54% | 62% | 64% | 72% |
|---|
| Day length | 13 | 13 | 12 | 12 | 11 | 11 | 11 | 12 | 12 | 12 | 13 | 13 |
|---|
| Sun hours | 7 | 7 | 7 | 8 | 7 | 7 | 7 | 9 | 8 | 8 | 8 | 7 |
|---|
|
| Sucre (2,800 meters) |
|---|
|
| Jan | Feb | Mar | Apr | May | Jun | Jul | Aug | Sep | Oct | Nov | Dec |
|---|
| Min temp. | 11 | 11 | 10 | 9 | 7 | 5 | 5 | 6 | 8 | 10 | 10 | 11 |
|---|
| Max temp. | 21 | 20 | 20 | 21 | 21 | 20 | 20 | 21 | 22 | 22 | 22 | 22 |
|---|
| Precip. | 155 | 115 | 105 | 30 | 5 | 0 | 0 | 10 | 25 | 50 | 65 | 120 |
|---|
| Prec. days | 16 | 13 | 11 | 6 | 2 | 1 | 1 | 2 | 4 | 8 | 10 | 14 |
|---|
| Humidity | 70% | 73% | 72% | 65% | 52% | 46% | 46% | 46% | 49% | 54% | 58% | 63% |
|---|
| Day length | 13 | 13 | 12 | 12 | 11 | 11 | 11 | 12 | 12 | 13 | 13 | 13 |
|---|
| Sun hours | 5 | 6 | 7 | 7 | 8 | 8 | 8 | 9 | 8 | 7 | 7 | 6 |
|---|
|
| Tiwanaku (3,800 meters) |
|---|
|
| Jan | Feb | Mar | Apr | May | Jun | Jul | Aug | Sep | Oct | Nov | Dec |
|---|
| Min temp. | 4 | 4 | 4 | 1 | -2 | -5 | -5 | -4 | 0 | 1 | 3 | 4 |
|---|
| Max temp. | 16 | 15 | 15 | 15 | 14 | 14 | 13 | 14 | 15 | 17 | 18 | 16 |
|---|
|
|
|
|
|
| Uyuni (3,650 meters) |
|---|
|
| Jan | Feb | Mar | Apr | May | Jun | Jul | Aug | Sep | Oct | Nov | Dec |
|---|
| Min temp. | 6 | 5 | 3 | -1 | -6 | -10 | -10 | -8 | -5 | -3 | 0 | 3 |
|---|
| Max temp. | 21 | 20 | 20 | 19 | 15 | 13 | 13 | 15 | 16 | 19 | 21 | 21 |
|---|
| Precip. | 80 | 40 | 30 | 0 | 0 | 0 | 0 | 0 | 0 | 5 | 5 | 25 |
|---|
| Prec. days | 11 | 7 | 6 | 1 | 0 | 1 | 0 | 0 | 0 | 0 | 1 | 4 |
|---|
|
| Day length | 13 | 13 | 12 | 12 | 11 | 11 | 11 | 11 | 12 | 13 | 13 | 13 |
|---|
| Sun hours | 7 | 7 | 8 | 9 | 10 | 10 | 10 | 10 | 9 | 9 | 9 | 8 |
|---|
|
See also the
temperatures month by month