Select units of measurement for the temperature and rainfall tables (metric or imperial).
Average weather, temperature, rainfall, sunshine
In Paraguay, the climate is
subtropical, with very mild winters from mid-May to mid-August (which are dry in the north-west and rainy in the south-east) and
long and very hot summers from November to March, with possible showers and thunderstorms in the afternoon throughout the country.
In the center-north, where the average temperature of the coldest month exceeds 18 °C (64.5 °F), we can speak of a
tropical climate.
Paraguay is a country in South America with no access to the sea and crossed by the Tropic of Capricorn. Being in the Southern Hemisphere, the seasons are reversed in comparison with North America or Europe.
Despite the thunderstorms, the amount of
sunshine in Paraguay is good in summer, while in winter, sunny days alternate with cloudy days.
The climate in detail
Temperature and rain
The country is exposed to different air masses, so it can experience rapid changes in temperature.
The
winter, from June to August, is very mild or pleasantly warm. However, the country can be affected by
cold air outbreaks from May to September, especially in the south, which can lead to nighttime temperatures around freezing (0 °C or 32 °F), but sometimes even a little below. The cold wind blowing from Argentina is called
Pampero.
In Paraguay, however, snow is virtually unknown, and daytime temperatures are mild even in these circumstances.
Throughout the year, Paraguay is also exposed to
warm air masses, which can bring warm days even in winter, with peaks above 30 °C (86 °F). During summer, however, the heat is permanent, although it is generally torrid (hot and dry) in the north-west, with peaks above 40 °C (104 °F), and more humid (therefore more uncomfortable) in the eastern and southern regions.
However,
heat waves can occur from mid-August to April. Between the end of September and the beginning of October 2020, the temperature reached 45.5 °C (114 °F) in Pozo Hondo, in the northwest on the border with Argentina (national record), and 42.8 °C (109 °F) in Asunción.
The
rains increase proceeding from the north-west to the south-east: the driest area is the Gran Chaco, where precipitation drops below 1,000 millimeters (40 inches) per year, while the rainiest area is that of the Paraná River, covered by forests, where annual precipitation approaches 2,000 mm (80 in).
The main differences in the rainfall are found in
winter, which is dry in the Chaco and rainy in the south-east of the country. So, the south-east, being rainy even in winter, has no dry season. During winter, in fact, the eastern and southern parts of the country are affected by weather fronts, which usually spare the north.
Spring and autumn are rainy as well.
However, the rains in countries having a tropical or sub-tropical climate are
irregular: weeks may well pass without rain, and then heavy showers or downpours can occur, maybe in a few days, releasing large amounts of water on the ground.
North-west
In the northwestern part of the country, sparsely populated, we find the region called Chaco Boreal, ie the northern part of the
Gran Chaco, a plain occupied by savannah, which extends into the neighbouring countries, i.e. Brazil, Argentina and Bolivia, while the central-eastern part is more humid and often marshy.
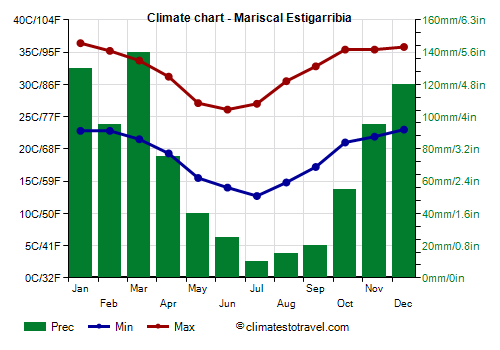
Mariscal Estigarribia

In the northwest, the Gran Chaco is very hot in the summer, and it is still quite warm in the winter, at least during the day. In
Mariscal Estigarribia, the maximum temperatures from May to July are around 26/27 °C (79/81 °F).
In this northern area, as mentioned, the rainfall is lower than 1,000 mm (40 in) per year, and winter is dry.
Center-south
In winter, the center and south of Paraguay is cooler and rainier than the northwest. Summer, on the other hand, is very hot here too, even though it is a little milder in the extreme south.
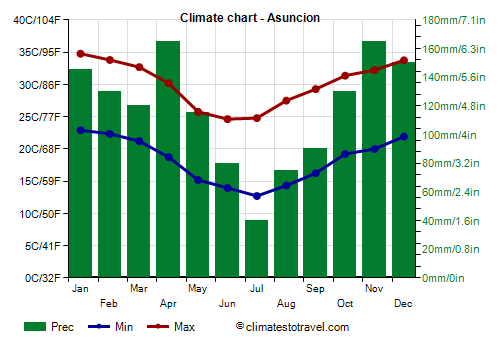
Asunción

In the capital,
Asunción, located in the southwest, a short distance from the border with Argentina, the average daily temperature ranges from 29 °C (84 °F) in January to 18.5 °C (65.5 °F) in July.
Precipitation amounts to nearly 1,400 mm (55 in) per year, including more than 100 mm (4 in) per month from October to May, while there's a remarkable decrease in winter, with a minimum of 40 mm (1.6 in) in July. In fact, looking at the map above, we can see that the capital is located in the center of the country, halfway between the north-west, which has a dry winter, and the south-east, which is rainy in winter as well.

In the east, the city of Pedro Juan Caballero, being located at 600 meters (2,000 feet) above sea level, is less hot in summer and cooler in winter.
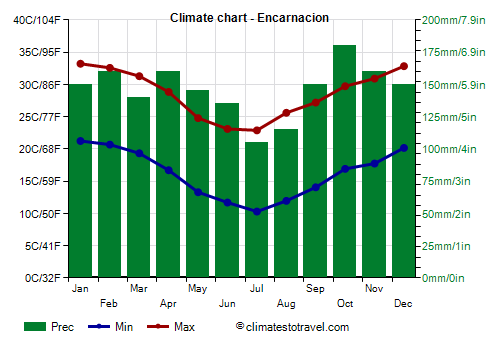
Encarnación

In the far south-east, in
Encarnación, the temperature is a few degrees lower throughout the year.
In addition, the rains in Encarnación are more abundant: they exceed 100 mm (4 in) per month even in winter, and there is no dry season.
When to go
The best time to visit Paraguay is winter,
from mid-May to mid-August, to avoid the heat, but also the strong thunderstorms, which can affect the country during the rest of the year.
Winter is typically mild or pleasantly warm and is the driest season in most of the country, except in the south-east. It must be said that in this season, especially from late June to late July, sometimes the weather can be a bit cold and windy for a few days; in the south-east, and sometimes even in Asunción, weather disturbances in winter can bring some cloudy and rainy days.
What to pack
In winter (mid-May to mid-August): bring clothes for spring and autumn (light for the day), and a sweater and a jacket for the evening. A raincoat or umbrella for the south.
In summer (November-March): bring lightweight clothes of natural fibers, a sun hat, a light raincoat or umbrella, and a light sweatshirt for the evening in the south.
Climate data - Paraguay
| Asuncion |
|---|
|
| Jan | Feb | Mar | Apr | May | Jun | Jul | Aug | Sep | Oct | Nov | Dec |
|---|
| Min temp. | 23 | 22 | 21 | 19 | 15 | 14 | 13 | 14 | 16 | 19 | 20 | 22 |
|---|
| Max temp. | 35 | 34 | 33 | 30 | 26 | 25 | 25 | 27 | 29 | 31 | 32 | 34 |
|---|
| Precip. | 145 | 130 | 120 | 165 | 115 | 80 | 40 | 75 | 90 | 130 | 165 | 150 |
|---|
| Prec. days | 8 | 7 | 7 | 8 | 7 | 7 | 4 | 5 | 6 | 8 | 8 | 8 |
|---|
| Humidity | 67% | 70% | 71% | 73% | 76% | 76% | 69% | 62% | 61% | 66% | 65% | 68% |
|---|
| Day length | 14 | 13 | 12 | 12 | 11 | 11 | 11 | 11 | 12 | 13 | 13 | 14 |
|---|
| Sun hours | 9 | 9 | 8 | 8 | 7 | 6 | 6 | 7 | 7 | 8 | 9 | 10 |
|---|
|
| Ciudad Del Este (200 meters) |
|---|
|
| Jan | Feb | Mar | Apr | May | Jun | Jul | Aug | Sep | Oct | Nov | Dec |
|---|
| Min temp. | 22 | 21 | 20 | 18 | 14 | 13 | 12 | 13 | 15 | 18 | 19 | 21 |
|---|
| Max temp. | 33 | 32 | 32 | 29 | 24 | 23 | 23 | 26 | 28 | 30 | 31 | 32 |
|---|
| Precip. | 185 | 155 | 135 | 140 | 130 | 130 | 90 | 115 | 130 | 175 | 165 | 140 |
|---|
| Prec. days | 10 | 9 | 8 | 7 | 8 | 8 | 7 | 8 | 9 | 10 | 9 | 9 |
|---|
| Humidity | 72% | 73% | 72% | 75% | 79% | 79% | 74% | 67% | 65% | 68% | 67% | 71% |
|---|
| Day length | 14 | 13 | 12 | 12 | 11 | 11 | 11 | 11 | 12 | 13 | 13 | 14 |
|---|
| Sun hours | 7 | 7 | 7 | 6 | 6 | 5 | 5 | 5 | 5 | 6 | 8 | 7 |
|---|
|
| Concepcion |
|---|
|
| Jan | Feb | Mar | Apr | May | Jun | Jul | Aug | Sep | Oct | Nov | Dec |
|---|
| Min temp. | 23 | 23 | 22 | 19 | 16 | 15 | 13 | 15 | 17 | 20 | 21 | 23 |
|---|
| Max temp. | 35 | 34 | 33 | 32 | 27 | 26 | 27 | 30 | 31 | 33 | 33 | 34 |
|---|
| Precip. | 155 | 125 | 140 | 125 | 125 | 60 | 45 | 55 | 70 | 125 | 160 | 165 |
|---|
| Prec. days | 10 | 9 | 8 | 7 | 7 | 7 | 5 | 6 | 7 | 8 | 8 | 10 |
|---|
| Humidity | 70% | 72% | 72% | 73% | 77% | 76% | 70% | 62% | 60% | 66% | 69% | 70% |
|---|
| Day length | 13 | 13 | 12 | 12 | 11 | 11 | 11 | 11 | 12 | 13 | 13 | 14 |
|---|
| Sun hours | 7 | 8 | 7 | 6 | 6 | 5 | 6 | 5 | 6 | 7 | 7 | 7 |
|---|
|
| Coronel Oviedo |
|---|
|
| Jan | Feb | Mar | Apr | May | Jun | Jul | Aug | Sep | Oct | Nov | Dec |
|---|
| Min temp. | 21 | 21 | 20 | 18 | 14 | 13 | 12 | 13 | 15 | 18 | 19 | 21 |
|---|
| Max temp. | 33 | 32 | 32 | 29 | 25 | 24 | 24 | 26 | 27 | 30 | 31 | 32 |
|---|
| Precip. | 165 | 125 | 140 | 155 | 175 | 110 | 100 | 75 | 130 | 225 | 195 | 175 |
|---|
| Prec. days | 13 | 11 | 9 | 8 | 9 | 6 | 6 | 4 | 7 | 10 | 9 | 12 |
|---|
|
|
|
|
| Encarnacion |
|---|
|
| Jan | Feb | Mar | Apr | May | Jun | Jul | Aug | Sep | Oct | Nov | Dec |
|---|
| Min temp. | 21 | 21 | 19 | 16 | 13 | 12 | 10 | 12 | 14 | 17 | 18 | 20 |
|---|
| Max temp. | 33 | 32 | 31 | 28 | 24 | 22 | 22 | 25 | 26 | 28 | 30 | 32 |
|---|
| Precip. | 150 | 160 | 140 | 160 | 145 | 135 | 105 | 115 | 150 | 180 | 160 | 150 |
|---|
| Prec. days | 9 | 8 | 7 | 8 | 7 | 8 | 8 | 8 | 9 | 9 | 9 | 9 |
|---|
| Humidity | 69% | 70% | 72% | 75% | 78% | 78% | 75% | 69% | 68% | 69% | 66% | 66% |
|---|
| Day length | 14 | 13 | 12 | 11 | 11 | 10 | 11 | 11 | 12 | 13 | 14 | 14 |
|---|
| Sun hours | 8 | 8 | 7 | 6 | 6 | 5 | 6 | 6 | 5 | 6 | 8 | 9 |
|---|
|
| Mariscal Estigarribia |
|---|
|
| Jan | Feb | Mar | Apr | May | Jun | Jul | Aug | Sep | Oct | Nov | Dec |
|---|
| Min temp. | 23 | 23 | 22 | 19 | 16 | 14 | 13 | 15 | 17 | 21 | 22 | 23 |
|---|
| Max temp. | 36 | 35 | 34 | 31 | 27 | 26 | 27 | 30 | 33 | 35 | 35 | 36 |
|---|
| Precip. | 130 | 95 | 140 | 75 | 40 | 25 | 10 | 15 | 20 | 55 | 95 | 120 |
|---|
| Prec. days | 8 | 6 | 8 | 6 | 5 | 3 | 2 | 2 | 3 | 5 | 7 | 7 |
|---|
|
| Day length | 13 | 13 | 12 | 12 | 11 | 11 | 11 | 11 | 12 | 13 | 13 | 14 |
|---|
|
|
| Pedro Juan Caballero (615 meters) |
|---|
|
| Jan | Feb | Mar | Apr | May | Jun | Jul | Aug | Sep | Oct | Nov | Dec |
|---|
| Min temp. | 21 | 21 | 20 | 18 | 15 | 14 | 13 | 15 | 17 | 19 | 20 | 21 |
|---|
| Max temp. | 31 | 30 | 30 | 28 | 25 | 24 | 24 | 27 | 29 | 30 | 30 | 30 |
|---|
| Precip. | 160 | 155 | 170 | 140 | 155 | 85 | 45 | 75 | 110 | 170 | 200 | 190 |
|---|
| Prec. days | 12 | 10 | 10 | 7 | 7 | 6 | 4 | 5 | 6 | 9 | 9 | 10 |
|---|
|
|
| Sun hours | 7 | 6 | 7 | 8 | 6 | 6 | 7 | 8 | 7 | 7 | 7 | 7 |
|---|
|
| Puerto Casado |
|---|
|
| Jan | Feb | Mar | Apr | May | Jun | Jul | Aug | Sep | Oct | Nov | Dec |
|---|
| Min temp. | 24 | 24 | 23 | 20 | 17 | 16 | 14 | 16 | 18 | 22 | 22 | 23 |
|---|
| Max temp. | 35 | 34 | 33 | 31 | 28 | 26 | 27 | 29 | 32 | 33 | 33 | 34 |
|---|
| Precip. | 140 | 120 | 125 | 105 | 75 | 55 | 30 | 45 | 50 | 110 | 150 | 180 |
|---|
| Prec. days | 10 | 8 | 8 | 7 | 6 | 6 | 4 | 5 | 6 | 8 | 8 | 9 |
|---|
|
|
|
|
See also the
temperatures month by month