In Peru, the climate is
subtropical desert on the coast (called
la Costa), cloudy and foggy in winter and pleasantly warm in summer, while it's
tropical with abundant rainfall in the Amazon forest (
la Selva). In the Andes (
la Sierra), the climate is
temperate with rainy summers and dry winters up to high altitudes, while it is cold on the mountain peaks.
Peru is a South American country, located just south of the Equator and bordering the Pacific Ocean.
The climate in detail
The coast

Along the Peruvian coast, the climate is very peculiar. The temperature varies little during the year and is almost always
spring-like, but it almost never rains and therefore the landscape is
desert.
The reason why along the coast there is a desert, is found in the
Humboldt Current, which flows in the ocean and cools the lowest layers of the atmosphere, thereby inhibiting the formation of vertical air currents, which are necessary for rain cloud formation.
However, there's no shortage of
fog and low clouds, which occur often, especially in the cold season, while sunshine prevails above 500 meters (1,600 feet), as happens in the Andean area lying above the fog layer.
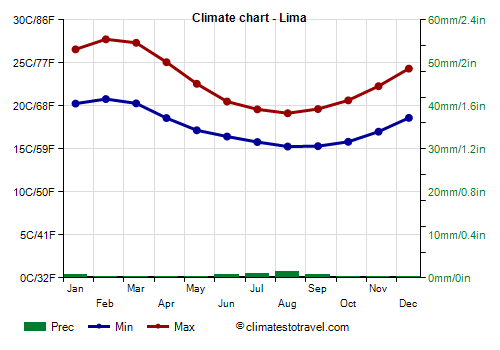
In the north (see El Alto), the daily average temperature ranges from 18 °C (64 °F) in the coldest month (August) to 24 °C (75 °F) in the warmest month (February); in the center (see Lima and Trujillo), it ranges from 17 °C to 23 °C (63 to 73 °F); while in the south, near the border with Chile (see Ilo), it ranges from 15 °C to 22 °C (59 to 72 °F).
![]() Climate chart - Lima
Climate chart - Lima
In
Lima, the capital, located in the central part of the coast, basically
it never rains.
During
winter, from June to September, the sky is almost always overcast, and even if it doesn't rain there is a mist, the
Garúa, which can deposit moisture on the ground. Temperatures are mild, with highs around 19/20 °C (66/68 °F) and lows only a few degrees below, but owing to the lack of sunshine and the high humidity, the capital's residents are cold, also because they often live in unheated houses. Temperature inversion favors the accumulation of pollutants, despite the proximity of the sea.

During
summer, from December to April, the sun often shines, at least at noon and in the afternoon, especially in February and March, while in the early hours of the day, fog can still occur. Sometimes, banks of low clouds can form in this season as well, albeit more rarely. The temperature is warm but without excess, with highs around 27/28 °C (81/82 °F) from January to March.
In Lima, the
sea is never very warm, even though it becomes acceptable for swimming from January to March.
![]() Climate chart - Tumbes
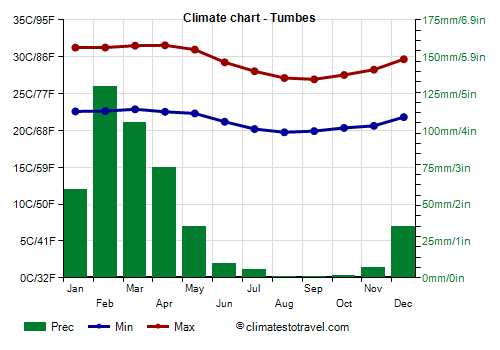
Climate chart - Tumbes
In the northern part of the coast, the sea is warmer, in fact the water temperature ranges from 25 °C (77 °F) in February and March to 21 °C (70 °F) between August and October.
In addition, the northernmost part of the coast (in the regions of
Tumbes and
Piura, see Tumbes, Máncora, El Alto,
Talara, Paita) may experience
a bit of rain from January to May, around 50/100 millimeters (2/4 inches) per year (but even more in the far north, see Tumbes).
The phenomenon known as
El Niño, which is an abnormal warming of the ocean waters, can influence this part of the coast (even a little further to the south, up to the region of Lambayeque, see
Chiclayo), bringing
warmer weather conditions and unusual rainfall in the years when it occurs.
During the most intense El Niño years (such as in 1983, 1998 and in 2016), the climate of this area can be transformed in the first months of the year (from January to May, but sometimes also in the previous December and in June), becoming
tropical, ie hot and humid, with almost monsoon-like rains, especially in the northernmost part.
In Lima, usually it does not rain even during these periods, but the torrents that descend from inland can swell, causing
floods and landslides. Furthermore, the air temperature can exceed 30 °C (86 °F) in summer, and sea temperature can exceed 25 °C (77 °F).
The Andes

The Andean Mountains cross Peru from north to south, clearly separating the coast from the Amazon forest. Here the climate varies with altitude and slope exposure.
There are several
high peaks, among which Huascaran, the highest with its 6,768 meters (22,205 feet), Yerupajá, 6,617 mt (21,709 feet), and Coropuna, 6,425 mt (21,079 ft).
Eternal snows are found at about 5,000 meters (16,500 ft).
In the
Andean Plateau, which hosts several modern cities but also the ruins of pre-Columbian civilizations, there is a
rainy season from September to May (but in the far south, the rainy season is shorter, and the rains are poor also in September and May).
In contrast with the coast, on the plateau, the
dry season, from June to August, is sunny. The tropical sun's rays are very strong, especially at high altitude, hence they raise the temperature during the day by many degrees, but at night with clear skies it can get cold, even with possible frosts, especially in the south, which lies farther from the Equator and thus has a cooler winter.
In the Andean region,
rainfall varies depending on slope exposure.
The western side, where it rains very rarely, is desert.
![]() Climate chart - Arequipa
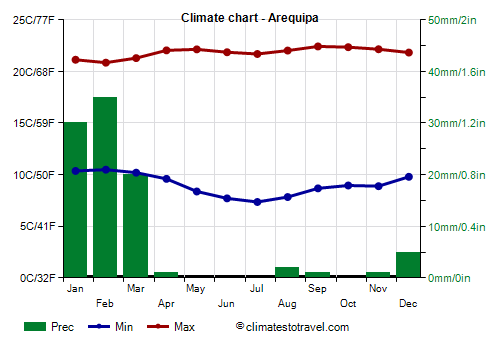
Climate chart - Arequipa
In
Arequipa, located in the south at 2,500 meters (8,200 ft) above sea level, on the western slope of the Andes, ie the driest one, only 95 mm (3.7 in) of rain fall on average each year.
The temperature in Arequipa is mild throughout the year, with quite cold nights especially from May to September, that is, in the austral winter.
In Arequipa, the sun shines regularly for many months a year, in the long dry season; in the months when sometimes it can rain, from January to March, the sun shines a little less often.
![]() Climate chart - Nazca
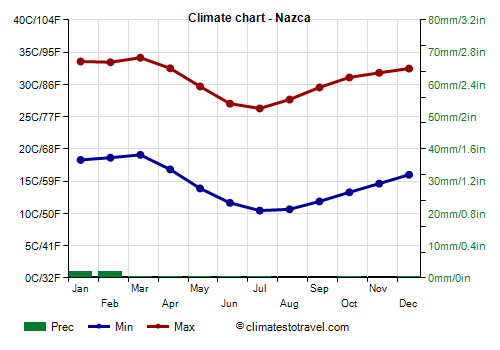
Climate chart - Nazca
The Nazca area, where the famous and mysterious
Nazca Lines are found, is
desert as well, but it's located around 500 meters (1,600 feet) above sea level, halfway between the Andes and the coast, in an area where you can find
hot weather during the day, especially from December to March.

The
plateau is generally arid, or at most moderately rainy: on average, from 350 to 800 millimeters (14 to 31.5 inches) of rain fall per year; rainfall is a bit more abundant in the north, where the rainy season is longer.
The eastern mountain range, called
Cordillera Oriental, is rainier than the western one.
Daytime temperatures in the Andean area do not vary by much during the year, while nights are colder in the winter months, especially in the south. At night, the temperature can drop
below freezing (0 °C or 32 °F) above 3,000 meters (9,800 ft), from May to August.

In
Cusco (or Cuzco), the ancient capital of the Inca empire, located at 3,400 meters (11,100 feet) above sea level, the maximum temperatures vary little throughout the year, from 20 °C (68 °F) between January and July to 22 °C (71.5 °F) in October and November (in fact, the spring months, before the rainy season, are the warmest). The minimum temperatures fluctuate more, and range from 8 °C (46.5 °F) in the December-March period (that is, the austral summer) to only 1 °C (34 °F) in July.
In Cusco, about 700 millimeters (27.5 in) of rain fall per year, almost all in the period from October to April, with a maximum from December to March, when rainfall is more frequent and abundant, while from May to August it almost never rains.
The famous archaeological site of
Machu Picchu, located at about 2,500 meters (8,200 ft) above sea level, is a little milder.

Lake Titicaca
On the shores of
Lake Titicaca, shared between Peru and Bolivia, at 3,800 meters (12,500 ft) above sea level, the climate is
colder than in Cusco, so much so that from May to September there are frequent night frosts.
However, in winter, with the sky usually clear, the temperature range between night and day is remarkable, to the point that during the day the temperature is similar to that of the summer months.
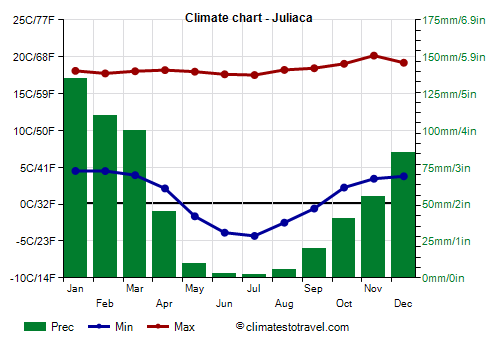
![]() Climate chart - Juliaca
Climate chart - Juliaca
In
Juliaca, 665 mm (26 in) fall per year, with a pattern similar to that of Cuzco.
In the north, in
Cajamarca, at 2,600 meters (8,500 ft), the temperature is milder, and the daily average is around 13/15 °C (55/59 °F) throughout the year. However, there is a high diurnal range: lows are a few degrees above freezing in winter and around 6/7 °C (43/45 °F) in summer, while highs are around 21/22 °C (70/72 °F) all year round.
As mentioned, the rainy period in the north lasts longer than in the south; in Cajamarca, the rainiest period runs from October to April, but there are 7/8 days per month with some rain also in May and September.
The sun in Cajamarca does not shine very often; however, there is a maximum in the austral winter, that is, in the dry season.
The forest

In the vast area of eastern Peru occupied by plains and hills and belonging to the Amazon Basin, there is a
impenetrable rainforest, almost completely uninhabited. The northern region has an
equatorial climate, hot and humid all year round, with frequent rainfall, while in the south the climate is
tropical, with a relatively dry season in winter.

![]() Climate chart - Iquitos
Climate chart - Iquitos
In
Iquitos, in the north, 2,850 mm (112 in) of rain fall per year; the only months when the rainfall decreases a bit, to around 150 mm (6 in) per month, are July and August. The tropical rains usually occur in the form of downpours or thunderstorms in the afternoon.
The temperatures in this northern part of the Amazon are steadily high all year round.
The sun in Iquitos does not shine very often, however, it becomes a bit more frequent in the least rainy months, which as mentioned are July and August.

Moving south, the relatively dry season in the Southern Hemisphere winter becomes more evident: in
Pucallpa, in the central area, just 50/60 mm (2/2.4 in) of rain fall per month in the period from June to August, while in the southernmost part, in
Puerto Maldonado, the least rainy season goes from May to September. Here, during winter there is also a decrease in temperature, in fact the average minimum temperature goes down to about 15 °C (59 °F).
The highest amount of rainfall is recorded in the eastern slope of the Andes, where the mountains descend towards the Amazon rainforest.
Quince Mil, at 650 meters (2,100 ft) above sea level, on the north side of the
Cordillera Oriental, receives 6 meters and a half (21 feet) of rain per year! Here the "best" period is from May to September, when "only" 300 to 350 mm (12/14 in) of rain fall per month.
When to go
It's not possible to find a single period when the entire Peru offers its best weather, in fact the best time in the Andean areas and in the Amazon is the Southern Hemisphere winter (
June to August), while along the coast during this period the weather is cool, cloudy and foggy.
To find warm and sunny weather along the coast and in Lima, the best time is from
December to April, and in particular the best period for swimming is from January to March.
What to pack
In
winter (June to August): for Lima and the coast, bring clothes for spring and autumn, with a sweatshirt or sweater and a jacket. For the Amazon, bring loose-fitting, light clothing, possibly with long sleeves against mosquitoes, and a sweatshirt for the evening; in the southernmost part (see Puerto Maldonado), and also in the part of the Amazon located at an altitude higher than sea level, you can bring a sweater and a jacket for the evening. For the Andes, at around 2,500/4,000 meters (8,000/13,000 feet), for example in Cuzco, Arequipa and Lake Titicaca, bring clothes for spring and autumn for the day, but also a sweater, a warm jacket and a hat for the evening; a sun hat, sunscreen, hiking shoes. For the highest peaks, bring a down jacket, a scarf, gloves, warm boots.
In
summer (December to February): for Lima and the coast, bring light clothing, a sweatshirt for the evening, an umbrella or a light raincoat north of Lima during El Niño years, a light jacket for the southern part of the coast. For the Amazon, bring tropics-friendly, loose-fitting clothing of natural fibers (cotton, linen) or synthetics that breathe, maybe with long sleeves against mosquitoes; in the part of the Amazon located at an altitude higher than sea level, you can add a sweatshirt or a light jacket for the evening. For the Andes, at around 2,500/4,000 meters (8,000/13,000 feet), for example in Cuzco, Arequipa and Lake Titicaca, bring clothes for spring and autumn (light for the day), and a sweater, a jacket and a hat for the evening; a sun hat, sunscreen, an umbrella or raincoat, hiking shoes. For the highest peaks, bring a down jacket, a scarf, gloves, warm boots.
Back to topSee also the
temperatures month by month