Select units of measurement for the temperature and rainfall tables (metric or imperial).
Average weather, temperature, rainfall, sunshine
In Suriname, the former Dutch Guiana, there's an
equatorial climate almost everywhere, hot and humid throughout the year, with abundant rainfall, in fact, it is covered with rainforests and mangroves.
However, in most of the country, there is a
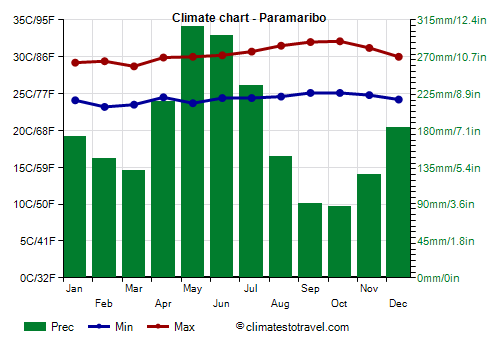
rainy season from December to mid-August (with a relative decrease in February and March and a peak in May and June) and a
relatively dry season from late August to mid-November.
The
sea in Suriname is warm all year round, and its temperature is similar to the average daily air temperature on the coast, ranging between 26.5 °C (79.5 °F) in January and February, and 28.5 °C (83.5 °F) in August and September.
Suriname lies outside of the hurricane belt, since hurricanes and tropical storms pass to the north, above the Caribbean Sea.
The climate in detail
Coast
As mentioned, in Suriname it is hot all year round, however, on the coast the temperature is less high, furthermore, the sea breeze gives some relief.
Rainfall ranges from 1,700 mm (67 in) per year in the westernmost part (see Nieuw Nickerie), on the border with Guyana, to 2,500 mm (98 in) per year in the eastern part (see Albina), along the Maroni river, on the border with French Guiana.

In the capital,
Paramaribo, located in the central part of the coast, the average daily
temperature ranges from 26 degrees Celsius (79 °F) in the coolest months (February and March) to 28.5 °C (83 °F) in the hottest months (September and October).
An average of 2,135 mm (84 in) of rain falls each year; the rainiest months are May and June, when the rainfall reaches 300 mm (12 in) per month and it rains almost every day.
The amount of
sunshine is not so high from December to May, while it is good in the driest period, from late August to mid-November.

Inland areas
In the inland areas of Suriname, the climate is similar to that of the coast, however, there are greater temperature differences between day and night, and it gets very hot during the day, especially in the dry season.
In the south-central regions, close to the
Wilhelmina Mountains, whose highest point is Julianatop, 1,280 meters (4,199 feet) high, rainfall reaches 3,000 mm (118 in) per year.
In the far south, in the
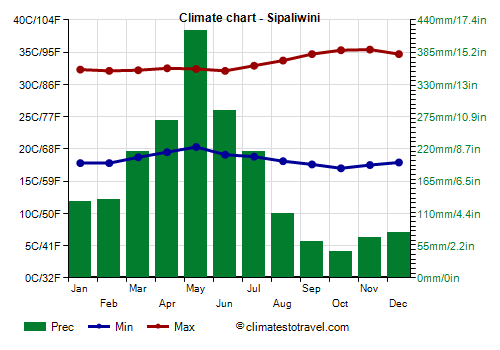
Sipaliwini Savanna Nature Reserve, the dry season is longer, so the climate is tropical, and the region is covered with savannah, as the name suggests.

In the
Sipaliwini Airstrip, located in the extreme south-east, daytime temperatures are around 35 °C (95 °F) in the dry period, from September to November.
Rainfall amounts to 2,000 mm (118 in) per year, of which less than 100 mm (4 in) per month from September to December, and just above this level in August, January and February.
When to go
The best time to visit Suriname runs from
late August to mid-November, since it is the driest and sunniest period of the year; it is true that it is also the hottest, but what matters most here is to avoid the heavy rains.
The short dry season, in
February and March, is less pronounced, but it is still quite noticeable, at least along the north coast, especially from Paramaribo to the west, that is, to the border with Guyana. However, for its brevity (one or two weeks) it's not reliable.
In the far south, you can visit the
Sipaliwini Savanna for a longer period, from August to February, with a preference for the period from September to December.
What to pack
Throughout the year: pack
tropics-friendly, loose-fitting clothing, light shirts and pants of natural fibers (cotton, linen) or synthetics that breathe, maybe with long sleeves for mosquitoes; a light sweatshirt for the evening, a sun hat, and an umbrella or a light and breathable raincoat.
From December to March, add a sweatshirt for the evening.
Climate data - Suriname
| Nieuw Nickerie |
|---|
|
| Jan | Feb | Mar | Apr | May | Jun | Jul | Aug | Sep | Oct | Nov | Dec |
|---|
| Min temp. | 24 | 23 | 25 | 25 | 25 | 24 | 23 | 25 | 24 | 25 | 24 | 24 |
|---|
| Max temp. | 27 | 28 | 29 | 29 | 29 | 29 | 29 | 30 | 30 | 31 | 29 | 29 |
|---|
| Precip. | 125 | 110 | 105 | 140 | 240 | 235 | 230 | 155 | 65 | 55 | 75 | 155 |
|---|
|
|
|
|
| Sea temp | 27 | 27 | 27 | 27 | 27 | 28 | 28 | 28 | 28 | 28 | 28 | 27 |
|---|
| Paramaribo |
|---|
|
| Jan | Feb | Mar | Apr | May | Jun | Jul | Aug | Sep | Oct | Nov | Dec |
|---|
| Min temp. | 24 | 23 | 24 | 24 | 24 | 24 | 24 | 25 | 25 | 25 | 25 | 24 |
|---|
| Max temp. | 29 | 29 | 29 | 30 | 30 | 30 | 31 | 32 | 32 | 32 | 31 | 30 |
|---|
| Precip. | 175 | 145 | 130 | 215 | 305 | 295 | 235 | 150 | 90 | 85 | 125 | 185 |
|---|
|
|
|
| Sun hours | 6 | 7 | 7 | 7 | 6 | 6 | 8 | 9 | 10 | 9 | 8 | 6 |
|---|
| Sea temp | 27 | 27 | 27 | 27 | 28 | 28 | 28 | 28 | 28 | 28 | 28 | 27 |
|---|
| Sipaliwini (265 meters) |
|---|
|
| Jan | Feb | Mar | Apr | May | Jun | Jul | Aug | Sep | Oct | Nov | Dec |
|---|
| Min temp. | 18 | 18 | 19 | 20 | 20 | 19 | 19 | 18 | 18 | 17 | 18 | 18 |
|---|
| Max temp. | 32 | 32 | 32 | 32 | 32 | 32 | 33 | 34 | 35 | 35 | 35 | 35 |
|---|
| Precip. | 130 | 135 | 215 | 270 | 420 | 285 | 215 | 110 | 60 | 45 | 70 | 80 |
|---|
|
|
|
|
|