Select units of measurement for the temperature and rainfall tables (metric or imperial).
Average weather, temperature, rainfall, sunshine
In Colombia, the climate is generally
tropical, hot all year round, but in the cities located in the Andes it is
temperate by altitude, and at higher altitudes, such as in capital Bogota, it becomes
subtropical. Finally, on the highest peaks of the Andes, there is a
cold mountain climate.
Colombia is a large country in South America, crossed by the Equator in the southern part. Due to the low latitude,
temperatures vary little throughout the year.
The
rains vary greatly from one area to another. As a result, there are arid and rainy areas, grasslands and forests, plains where the heat is stifling and plateaus with a mild climate, pristine coastlines with a warm sea and snow-capped peaks in the Andes.
In the
tierras calientes, from sea level to about 1,000 meters (3,300 feet), it's hot all year round, while the
tierras templadas at middle altitudes are pleasantly warm, and the
tierras frías, above 2,000 meters (6,500 feet), are cool to cold.
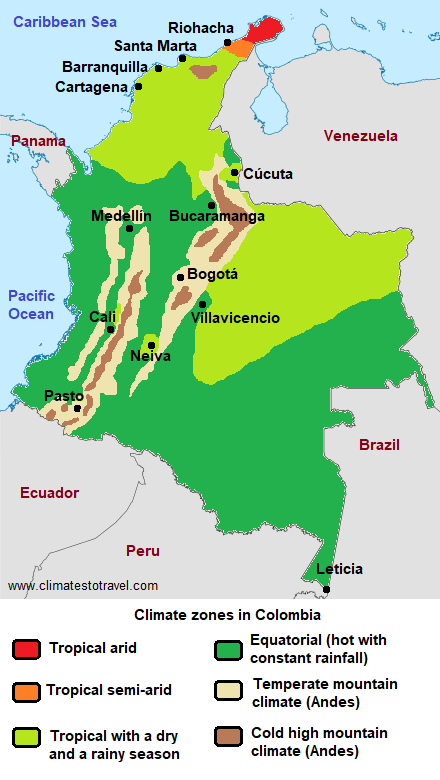
In the following map, we can see the
climate zones in Colombia.
Index
- The deserts - Guajira Peninsula, Tatacoa
- The savanna - Barranquilla, Cartagena, Llanos, San Andrés and Providencia
- The forest - Pacific-Chocó, Quibdó, Tumaco, Amazon rainforest
- The Andes - Nevado del Ruiz
- Andean valleys - Bogotá, Cali, Medellín, Popayán
- El Niño
- Hurricanes
- When to go
- What to pack
- Climate data
The deserts
Guajira Peninsula
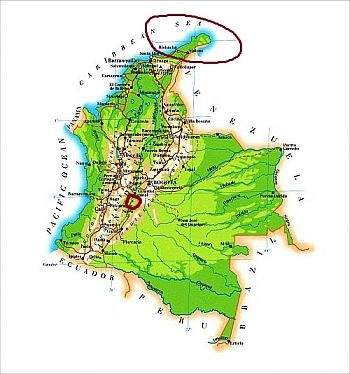
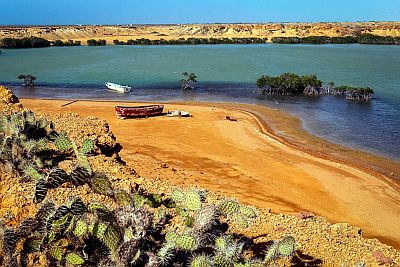
In the far north, the Guajira Peninsula (see the red circle at the top of the map) is the most arid part of Colombia; in fact, precipitation is below 300 mm (12 in) per year, and there is even a desert, called
La Guajira Desert. In the north of the peninsula, the
Parque Nacional Natural Macuira is a bit greener because there are some hills that capture a bit of the moisture brought by the trade winds.
This offshoot of Colombia, which overlooks the Caribbean Sea, can be affected by
hurricanes, in the period from June to November (though most likely between August and October), but this rarely happens because it is located at the southern end of their trajectory.
In
Riohacha, capital city of the La Guajira Department, the climate is
hot throughout the year: in July, lows are around 26 °C (79 °F) and highs around 36 °C (97 °F), while in the coolest months, from December to February, they are just a few degrees lower.
Riohacha is located on the north coast, to the west of the peninsula, and although it does not rain a lot, it is not so dry, in fact the rains amount to 550 millimeters (22 inches) per year. However, the rains are quite scarce from December to April, then there is a first relatively rainy period in May and June, when 70 mm and 40 mm (2.8 and 1.6 in) of rain fall respectively, a second dry period from July to mid-August, and a second rainy period between September and mid-November; October is the wettest month with 150 mm (6 in) of rain.
This rainfall pattern, with
two dry and two rainy periods, is also found in other less arid areas; in fact, it is typical of sub-equatorial areas, where the sun passes directly overhead at noon twice a year.
The Caribbean Sea in Colombia is warm all year round, and therefore also in this part of the coast.
Tatacoa Desert
In the south-western inland areas, between the two Andean mountain ranges and near the town of Villavieja, there is another arid zone, the
Tatacoa Desert (see the small circle at the center of the map). It is an area occupied by canyons and rocky landscapes, where good visibility allows to see the shooting stars during the periods of meteor showers, but also the stars at the
astronomical observatory and a collection of fossils of the area in the archaeological museum. The average altitude is about 400 meters (1,300 feet).
There is
intense heat throughout the year, especially from July to September, while it decreases a little in November and December, as also happens in the nearby city of
Neiva.
During the day, temperatures can reach 40 °C (104 °F) all year round, while at night they can drop to around 15/17 °C (59/63 °F).
The
rains are below 1,000 mm (40 in) per year, but they are not entirely absent: some showers can occur throughout the year, but mainly in March and April and from October to December, while the driest months are June, July and August.
The savanna
The climate of the savanna is hot year-round, with
a dry season and a rainy season. To the southwest of the Guajira Peninsula, along the coast of the Caribbean Sea, the climate is more humid, so there is tropical (muggy) heat rather than torrid (hot and dry). Also, the rains are more abundant.
In
Barranquilla, highs range between 31.5 °C and 33 °C (88.5 and 91 °F) throughout the year, and lows between 24 °C and 25 °C (75 to 77 °F).
In Barranquilla, it almost never rains from mid-December to April, but then the rainy season, from May to mid-November, is more pronounced than in the Guajira Peninsula, with a peak in the last part (Semptember-October). The summer break is not so evident: in July, 65 mm (2.6 in) of rain fall anyway. Total annual rainfall is 815 mm (32 in).
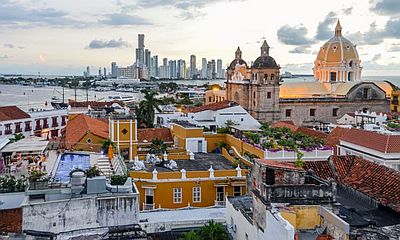
Continuing southwestward on the west coast, in
Cartagena de Indias, at 10 degrees north latitude, it is hot all year round as well. The climate is similar to that of Barranquilla, although the rains are a little more abundant, reaching 1,000 mm (40 in) per year.
Continuing on the coast south of Cartagena, the temperatures remain similar, but the
rains are even more abundant: in Santiago de Tolú, located a short distance from the Archipelago of San Bernardo, they reach 1,340 mm (52.7 in) per year, and exceed 150 mm (6 in) from May to November. Further south, precipitation reaches 1,400 mm (55 in) per year in San Bernardo del Viento, and 1,465 mm (57 in) in Cristo Rey.
In
Arboletes, which is located west of Monterìa, rainfall amounts to 1,700 mm (67 in), and by now the dry season has been reduced to about 4 months.
In the inland areas located east of the coast, the climate is similar to that of this portion of the coast, with a greater risk of intense heat, around 37/40 °C (99/104 °F) on sunny days.
Llanos
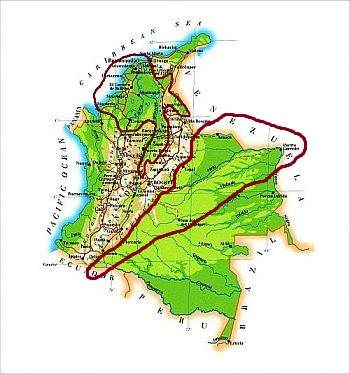
To the east of the Andes (in the map, the area to the right), there is a large area that has a similar climate, hot throughout the year, with a dry and a wet season: this is the area of the so-called
Llanos, plains and hills occupied by the
savannah.
Compared with the previous area, here the rainfall is more abundant, above 2,000 mm (79 in), but there is still a relatively dry season, from December to March in the north (see
Arauca,
Puerto Carreno) and from mid-December to February in the center and south (see Las Gaviotas, San José del Guaviare). The dry period is also the hottest, with peaks above 35 °C (95 °F), when, however, air humidity is lower than in the rainy period.
San Andrés and Providencia
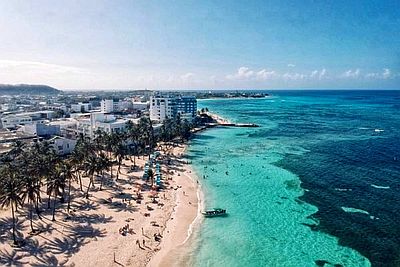
The small Caribbean islands of
San Andrés and
Providencia, located to the east of Nicaragua, are hot all year round, with highs around 29/31 °C (84/88 °F). These islands are very rainy: the total rainfall is 1,900 mm (75 in) per year; we put them in this section because here too there is a dry season, from mid-January to April, and a rainy season, from May to mid-January. Like the Peninsula de la Guajira, these islands are located at the lower part of the hurricane zone.
The forest
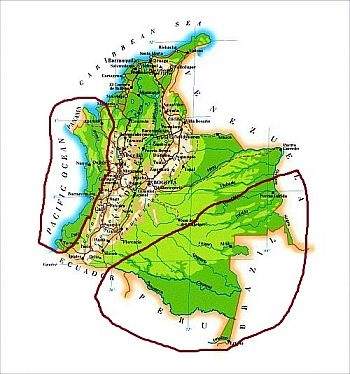
There are two areas of Colombia in the west and south-east, which have an
equatorial climate, hot and rainy throughout the year. The rains generally occur in the form of downpours or thunderstorms, preferably in the afternoon or in the evening.
Pacific-Chocó
In the southernmost part of the coast of the Caribbean Sea, north of the border with Panama (see Acandí, Capurganá, Turbo, Necoclí,
Apartadó), more than 2,000 millimeters (80 inches) of rain fall per year. The only period when precipitation drops to less than 150 millimeters (6 inches) per month is from
January to March.
South of the border with Panama, the coastal area of the
Pacific Ocean is even more rainy: rainfall reaches 5,350 mm (210 in) in Bahia Solano, and up to 6,900 mm (271 in) in Buenaventura, at almost 4 degrees north latitude.
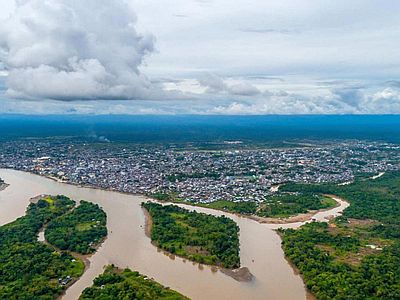
East of the coast, on the slopes at the foot of the Western Cordillera of the Andes, we find
Quibdó, which is the rainiest city in Colombia as well as one of the rainiest in the world. Here, annual rainfall reaches as high as 8,000 mm, ie 8 meters (or 26 feet)! Heavy downpours occur almost daily, and cloudiness forms in late morning and persists in the afternoon. In fact, Quibdó is
the rainiest city in the world, at least of a certain size (in some mountainous areas of India, where it rains even more, there are only villages and small towns).
The temperatures in Quibdó are high throughout the year, and the air is constantly moist.
Amazon rainforest
The area we are dealing with (that is, the one circled in the left on the map) is not the only part of the country with an equatorial climate. The south-eastern part of Colombia, that of the
Amazon rainforest (in the map, the area circled in the right), has a similar climate. This is an area, however vast, sparsely populated and difficult to penetrate.
In the far south, in
Leticia, in the area where the Amazon River marks for a few kilometers the border with Peru, it rains a lot throughout the year, on average 3,300 mm (130 in), with a slight decrease in July and August.
In fact, here we are, albeit slightly, south of the Equator, so the seasons are reversed, and June, July and August can be considered as winter months, and sometimes nights can be a bit cool from June to September.
The Andes
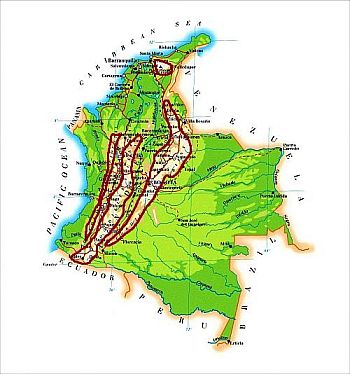
In the west, Colombia is crossed from north to south by the
Andes, which are divided into three mountain ranges, called
Cordilleras: Western, Central and Eastern. To the three Cordilleras we must also add the
Sierra Nevada de Santa Marta, which is located in the north, apart from them, and it's home to the highest peak of Colombia,
Pico Cristóbal Colón (Christopher Columbus), 5,775 meters (18,947 feet) high. However, there are several peaks (often volcanic) exceeding 5,000 meters (16,500 ft). Considering that we are at the Equator, to find very low temperatures we must rise above 3,500 meters (11,500 ft), which is typically the limit beyond which neither trees nor towns are found.
In the Andean zone, the rainfall is more or less abundant depending on slope exposure, while the temperature varies with altitude.
For example, at 4,150 meters (13,600 feet) on the slopes of the
Nevado del Ruiz, whose summit is at 5,321 meters (17,457 feet), located 130 kilometers (80 mi) west of Bogotá, the average temperature is around 1 °C (34 °C) at night and 8/9 °C (46/48 °F) during the day, all year round.
Between 3,500 and 4,500 meters (11,500 and 15,000 ft), there are areas with a particular kind of vegetation, a tropical high mountain tundra with shrubs and cactuses, called
páramos, while over 4,500 meters (15,000 ft) there are snow-covered areas (called
nevados).
Andean valleys
In the
valleys between mountain ranges, the amount of rainfall is lower than in the two external sides, typically between 900 and 1,200 mm (35 and 47 in) per year. We have said that the western side, which overlooks the Pacific Ocean, is rain-soaked, but so is the eastern side, even though it doesn't reach the peaks of cities like Quibdó.
For example, in
Villavicencio, at 430 meters (1,400 feet) above sea level, 4,500 mm (178 in) of rain fall per year, and the only months when precipitation goes below 150 mm (6 in) are January (with 65 mm or 2.5 in) and February (with 130 mm or 5.1 in). Here, the relatively dry period goes from mid-December to mid-March. Further south, in
Florencia, the least rainy period, with rainfall between 100 and 150 mm (4 and 6 in) per month, is shorter, and it's limited to December and January.
In the interior area of the Andes, there are many cities located at high altitudes.
The capital,
Bogotá, is located at 2,600 meters (8,500 ft), and has a cool, spring-like climate all year round, with maximum temperatures ranging from 19 to 20 °C (66 to 68 °F) and minimum temperatures from 7 to 10 °C (44.5 to 50 °F).
The
rainfall pattern is influenced by the two zenith passages of the sun (that is, when it shines directly overhead in the sky at mid-day), and therefore there are
two maxima in April-May and October-November and
two minima from December to February and from June to September. However, the minimum in the latter season is not very reliable, in fact, the rains decrease in quantity, but not in frequency (it rains often anyway). Moreover, from June to September the sun does not shine very often.
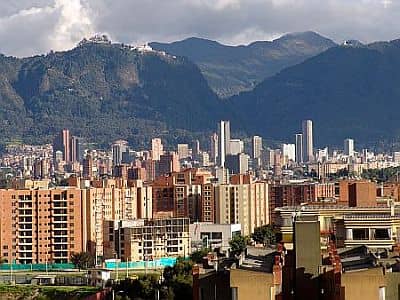
A few kilometers west of Bogotá, near Mondoñedo, there is a small arid zone, called a bit emphatically "Sabrinsky Desert", where rainfall drops below 500 mm (20 in) per year. Rainfall drops below 500 mm (20 in) also to the north-east of the city, and about 100 km (60 mi) to the north-east, in the department of Boyacá, we find the "Candelaria Desert", an arid area at about 2,100/2,500 meters (6,900/8,200 feet) above sea level, where therefore the temperatures are a little higher than in the capital.
The city of
Cali is located at a lower altitude, around 1,000 meters (3,300 feet). Here, the temperature is definitely higher than in Bogotá, and the climate is hot, but all in all it's usually bearable, at least more than at sea level. However, sometimes the temperature can reach 33/35 °C (91/95 °F) all year round.
In Cali, both the the pattern and the amount of rainfall (which is about 1,000 mm or 40 inches), are similar to those of Bogotá, although there's more sun and the rains from June to August are less frequent.
In the western districts of the city, closer to the mountains, and especially in the south-west, closer to the
Farallones de Cali, a massif of 4,000 meters (13,100 ft), the rains are more abundant.
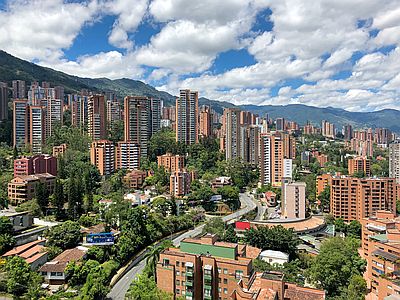
Compared with Bogotá and Cali,
Medellín is located at an intermediate altitude, 1,500 meters (5,000 feet), and as can be expected it has warm daytime temperatures, but without excesses, and quite cool nights: lows are around 18 °C (64 °F), while highs are around 27/29 °C (81/84 °F). However, the rains in Medellín are more abundant, about 1,700 mm (66 in) per year, and there is no decrease from June to August.
Another city that lies at a high altitude is
Popayán, 1,735 meters (5,700 feet) above sea level. This is really a city of eternal spring: highs are around 24/26 °C (75/79 °F) and lows around 13/14 °C (55/57 °F) all year round.
Here, however, the rains are more abundant, about 2,100 mm (82.5 in) per year, and being situated more to the south, it doesn't experience a real decrease in January and February, when it still rains a lot.
El Niño
The climate of Colombia is influenced by the phenomenon known as ENSO: a cycle that comprises periods when the waters of the Pacific become warmer than normal, i.e. those classified as
El Niño, alternating with normal (or neutral) periods, and others in which they become colder than normal, i.e. those classified as La Niña. In much of Colombia, in El Niño years the rainy season becomes hotter and drier than normal, while in
La Niña years it becomes cooler and rainier.
On the contrary, in the southernmost part of the coast, north of Ecuador (see Tumaco), the relatively dry season that normally occurs from
August to November does not occur in El Niño years, when the rains are still heavy like in the rest of the year, while in La Niña years it becomes definitely dry.
Hurricanes
As mentioned, the far north of Colomba (Guajira Peninsula, Barranquilla, Cartagena) lies at the edge of the area over which
hurricanes, the tropical cyclones of the Atlantic Ocean, can pass. This means that hurricanes affect this area quite rarely, but sometimes they can do it, as happened with Hurricane Joan in October 1988, Cesar in late July 1996, Matthew in late September 2016, and Iota in mid-November 2020.
The islands of San Andrés and Providencia, being located a bit further to the north, are hit by hurricanes more often and in a more direct manner.
The hurricane season runs from June to November, but they are most likely from August to October.
When to go
It's hard to find a single period that is fine for all of Colombia, but in most of the country the best time is from
December to March, since it is the driest, or at least the least rainy. It must be said that in Bogota and in the Andes, it is the coldest period at night, and fog forms more often.
The best time to visit Barranquilla and Cartagena is from December to April.
In San Andrés and Providencia, there is a dry season from mid-January to April, which is therefore the one to be preferred.
In the areas where the rains are abundant throughout the year (see the
forest) too, rainfall generally decreases somewhat in the northern hemisphere winter.
In the southernmost part of the coast of the Caribbean Sea (see Acandí), the only period when precipitation drops to less than 150 millimeters (6 inches) per month is from
January to March, which therefore is the best period in this area.
If you want to venture into the Chocó, the extremely rainy region facing the Pacific (see Quibdó), you can choose
February and March when it rains for "only" 22 days per month, with "only" 520 millimeters (20.5 in) of rain per month... otherwise, if you're looking for strong emotions, you can choose August, when 840 mm (33 in) of rain fall, so it practically rains in a single month like it does in an average rainy city in an entire year.
All in all, you can also choose the summer of the northern hemisphere,
from June to August, which is the least rainy season in the southern part of the Andes and the Amazon forest. In this period, however, it is very hot in the far north, while some areas (the central-north and the region facing the Pacific) are very rainy.
In fact, as mentioned, there are also areas where the least rainy season is inverted (the extreme south both of the Amazon and of the Andean area, see Popayán, where the best time goes from mid-June to mid-September), or areas where the least rainy period runs from August to November (the southernmost part of the Pacific coast - see Tumaco - which as mentioned is also affected by the El Niño cycle).
As previously mentioned, the Caribbean Sea is warm enough all year round for
swimming and sun bathing. The Pacific Ocean is warm all year round as well, and has more constant temperatures: 25/26 °C (77/79 °F) for most of the year, with a peak of 27 °C (81 °F) in October, but as we said this coastline is rainy all year round.
What to pack
In
plains and lowlands, in general, bring light clothing all year round. In the forest, bring loose-fitting clothing, light shirts and pants of natural fibers (cotton, linen) or synthetics that breathe, maybe with long sleeves against mosquitoes; possibly a light sweatshirt and a light raincoat for thunderstorms. On the coast, and possibly a light scarf and a light sweatshirt for the sea breeze. In the savannah (Barranquilla, Cartagena), you can bring a light sweatshirt and a light raincoat for thunderstorms during the rainy season.
In the
tierras templadas (see Medellín), bring light clothing, a sweatshirt for the evening, a raincoat or umbrella.
In the
tierras frías (see Bogota), bring clothes for spring and autumn, a sweater or sweatshirt, a jacket, a raincoat or umbrella.
In
high mountains, bring warm clothes, such as a down jacket, a hat, gloves, a scarf, hiking shoes.
Climate data - Colombia
| Acandí |
|---|
|
| Jan | Feb | Mar | Apr | May | Jun | Jul | Aug | Sep | Oct | Nov | Dec |
|---|
| Precip. | 130 | 85 | 120 | 285 | 375 | 270 | 295 | 285 | 200 | 225 | 270 | 280 |
|---|
| Prec. days | 9 | 7 | 8 | 14 | 18 | 17 | 18 | 17 | 14 | 15 | 16 | 14 |
|---|
|
| Day length | 12 | 12 | 12 | 12 | 12 | 13 | 13 | 12 | 12 | 12 | 12 | 12 |
|---|
|
|
| Apartado |
|---|
|
| Jan | Feb | Mar | Apr | May | Jun | Jul | Aug | Sep | Oct | Nov | Dec |
|---|
| Min temp. | 24 | 24 | 25 | 25 | 24 | 24 | 24 | 24 | 24 | 24 | 24 | 24 |
|---|
| Max temp. | 31 | 31 | 31 | 32 | 32 | 32 | 32 | 32 | 32 | 32 | 31 | 31 |
|---|
| Precip. | 95 | 80 | 100 | 255 | 330 | 285 | 255 | 250 | 285 | 310 | 290 | 205 |
|---|
| Prec. days | 9 | 9 | 10 | 18 | 22 | 22 | 22 | 22 | 22 | 21 | 19 | 15 |
|---|
| Humidity | 77% | 75% | 77% | 79% | 81% | 80% | 81% | 79% | 80% | 79% | 80% | 80% |
|---|
| Day length | 12 | 12 | 12 | 12 | 12 | 13 | 12 | 12 | 12 | 12 | 12 | 12 |
|---|
| Sun hours | 5 | 5 | 4 | 4 | 4 | 3 | 4 | 4 | 4 | 4 | 5 | 4 |
|---|
|
| Arauca |
|---|
|
| Jan | Feb | Mar | Apr | May | Jun | Jul | Aug | Sep | Oct | Nov | Dec |
|---|
| Min temp. | 22 | 22 | 23 | 23 | 23 | 23 | 23 | 23 | 23 | 23 | 23 | 23 |
|---|
| Max temp. | 33 | 35 | 35 | 33 | 32 | 30 | 30 | 31 | 32 | 32 | 32 | 32 |
|---|
| Precip. | 15 | 10 | 40 | 130 | 225 | 315 | 305 | 235 | 205 | 185 | 110 | 25 |
|---|
| Prec. days | 1 | 2 | 4 | 11 | 16 | 21 | 20 | 19 | 14 | 13 | 9 | 4 |
|---|
| Humidity | 65% | 58% | 61% | 74% | 82% | 86% | 85% | 83% | 81% | 81% | 81% | 74% |
|---|
| Day length | 12 | 12 | 12 | 12 | 12 | 12 | 12 | 12 | 12 | 12 | 12 | 12 |
|---|
| Sun hours | 9 | 8 | 7 | 5 | 5 | 4 | 5 | 5 | 6 | 6 | 7 | 8 |
|---|
|
| Arboletes |
|---|
|
| Jan | Feb | Mar | Apr | May | Jun | Jul | Aug | Sep | Oct | Nov | Dec |
|---|
| Precip. | 15 | 15 | 40 | 125 | 250 | 190 | 200 | 225 | 190 | 205 | 185 | 80 |
|---|
| Prec. days | 3 | 2 | 4 | 8 | 14 | 12 | 13 | 12 | 11 | 12 | 11 | 6 |
|---|
|
| Day length | 12 | 12 | 12 | 12 | 12 | 13 | 13 | 12 | 12 | 12 | 12 | 12 |
|---|
| Sun hours | 7 | 7 | 6 | 5 | 5 | 5 | 5 | 5 | 5 | 5 | 6 | 6 |
|---|
|
| Barranquilla |
|---|
|
| Jan | Feb | Mar | Apr | May | Jun | Jul | Aug | Sep | Oct | Nov | Dec |
|---|
| Min temp. | 24 | 24 | 24 | 25 | 25 | 25 | 25 | 25 | 24 | 24 | 24 | 25 |
|---|
| Max temp. | 32 | 32 | 32 | 33 | 33 | 33 | 33 | 33 | 33 | 33 | 32 | 32 |
|---|
| Precip. | 0 | 0 | 0 | 25 | 115 | 85 | 65 | 105 | 155 | 165 | 75 | 25 |
|---|
| Prec. days | 0 | 0 | 0 | 4 | 9 | 9 | 7 | 10 | 13 | 15 | 8 | 2 |
|---|
| Humidity | 78% | 77% | 77% | 79% | 82% | 83% | 82% | 82% | 85% | 86% | 85% | 81% |
|---|
| Day length | 12 | 12 | 12 | 12 | 13 | 13 | 13 | 12 | 12 | 12 | 12 | 12 |
|---|
| Sun hours | 9 | 9 | 8 | 7 | 6 | 6 | 7 | 7 | 5 | 5 | 6 | 8 |
|---|
| Sea temp | 27 | 27 | 27 | 27 | 28 | 28 | 28 | 29 | 29 | 29 | 29 | 28 |
|---|
| Bogota (2,500 meters) |
|---|
|
| Jan | Feb | Mar | Apr | May | Jun | Jul | Aug | Sep | Oct | Nov | Dec |
|---|
| Min temp. | 7 | 8 | 9 | 10 | 10 | 9 | 9 | 9 | 8 | 8 | 9 | 8 |
|---|
| Max temp. | 20 | 20 | 20 | 20 | 20 | 19 | 19 | 19 | 20 | 20 | 20 | 20 |
|---|
| Precip. | 30 | 45 | 65 | 100 | 95 | 55 | 45 | 45 | 70 | 105 | 90 | 50 |
|---|
| Prec. days | 8 | 11 | 14 | 18 | 20 | 18 | 17 | 16 | 16 | 18 | 17 | 12 |
|---|
| Humidity | 76% | 76% | 78% | 80% | 80% | 77% | 75% | 75% | 75% | 79% | 81% | 78% |
|---|
| Day length | 12 | 12 | 12 | 12 | 12 | 12 | 12 | 12 | 12 | 12 | 12 | 12 |
|---|
| Sun hours | 6 | 5 | 5 | 4 | 4 | 4 | 4 | 4 | 4 | 4 | 4 | 5 |
|---|
|
| Cali (1,000 meters) |
|---|
|
| Jan | Feb | Mar | Apr | May | Jun | Jul | Aug | Sep | Oct | Nov | Dec |
|---|
| Min temp. | 19 | 19 | 19 | 19 | 19 | 19 | 19 | 19 | 19 | 19 | 19 | 19 |
|---|
| Max temp. | 30 | 31 | 31 | 30 | 30 | 30 | 31 | 31 | 31 | 30 | 29 | 30 |
|---|
| Precip. | 50 | 55 | 90 | 130 | 95 | 55 | 30 | 35 | 70 | 100 | 100 | 70 |
|---|
| Prec. days | 10 | 9 | 14 | 17 | 15 | 10 | 8 | 8 | 12 | 16 | 15 | 12 |
|---|
| Humidity | 73% | 72% | 74% | 77% | 77% | 75% | 72% | 70% | 72% | 75% | 77% | 76% |
|---|
| Day length | 12 | 12 | 12 | 12 | 12 | 12 | 12 | 12 | 12 | 12 | 12 | 12 |
|---|
| Sun hours | 6 | 6 | 5 | 5 | 5 | 5 | 6 | 6 | 5 | 5 | 5 | 5 |
|---|
|
| Cartagena |
|---|
|
| Jan | Feb | Mar | Apr | May | Jun | Jul | Aug | Sep | Oct | Nov | Dec |
|---|
| Min temp. | 24 | 24 | 25 | 26 | 26 | 26 | 26 | 26 | 26 | 26 | 25 | 25 |
|---|
| Max temp. | 31 | 31 | 31 | 32 | 32 | 32 | 32 | 32 | 32 | 32 | 31 | 31 |
|---|
| Precip. | 5 | 0 | 0 | 25 | 115 | 100 | 110 | 125 | 135 | 230 | 140 | 35 |
|---|
| Prec. days | 1 | 0 | 1 | 3 | 10 | 12 | 10 | 13 | 14 | 16 | 11 | 3 |
|---|
| Humidity | 80% | 78% | 79% | 80% | 82% | 82% | 81% | 82% | 82% | 83% | 83% | 82% |
|---|
| Day length | 12 | 12 | 12 | 12 | 13 | 13 | 13 | 12 | 12 | 12 | 12 | 12 |
|---|
| Sun hours | 9 | 8 | 8 | 7 | 6 | 6 | 7 | 6 | 6 | 6 | 6 | 8 |
|---|
| Sea temp | 27 | 27 | 27 | 28 | 28 | 29 | 29 | 29 | 29 | 29 | 29 | 28 |
|---|
| Leticia |
|---|
|
| Jan | Feb | Mar | Apr | May | Jun | Jul | Aug | Sep | Oct | Nov | Dec |
|---|
| Min temp. | 23 | 23 | 23 | 23 | 23 | 22 | 22 | 22 | 22 | 23 | 23 | 23 |
|---|
| Max temp. | 31 | 31 | 31 | 31 | 30 | 30 | 31 | 32 | 32 | 32 | 32 | 31 |
|---|
| Precip. | 355 | 335 | 350 | 350 | 290 | 205 | 160 | 170 | 235 | 265 | 300 | 290 |
|---|
| Prec. days | 24 | 21 | 22 | 22 | 23 | 19 | 16 | 16 | 17 | 19 | 21 | 23 |
|---|
| Humidity | 87% | 87% | 87% | 87% | 87% | 86% | 84% | 82% | 83% | 84% | 85% | 87% |
|---|
| Day length | 12 | 12 | 12 | 12 | 12 | 12 | 12 | 12 | 12 | 12 | 12 | 12 |
|---|
| Sun hours | 4 | 4 | 4 | 5 | 5 | 5 | 6 | 6 | 6 | 6 | 5 | 5 |
|---|
|
| Medellin (1,500 meters) |
|---|
|
| Jan | Feb | Mar | Apr | May | Jun | Jul | Aug | Sep | Oct | Nov | Dec |
|---|
| Min temp. | 18 | 18 | 18 | 18 | 18 | 18 | 18 | 18 | 18 | 18 | 18 | 18 |
|---|
| Max temp. | 28 | 28 | 28 | 28 | 28 | 28 | 29 | 28 | 28 | 27 | 27 | 27 |
|---|
| Precip. | 65 | 80 | 125 | 160 | 200 | 160 | 120 | 150 | 180 | 210 | 145 | 95 |
|---|
| Prec. days | 12 | 13 | 17 | 22 | 23 | 19 | 17 | 19 | 22 | 24 | 21 | 15 |
|---|
| Humidity | 57% | 57% | 59% | 62% | 62% | 57% | 53% | 55% | 57% | 63% | 65% | 61% |
|---|
| Day length | 12 | 12 | 12 | 12 | 12 | 12 | 12 | 12 | 12 | 12 | 12 | 12 |
|---|
| Sun hours | 6 | 5 | 5 | 4 | 4 | 6 | 6 | 6 | 5 | 4 | 4 | 5 |
|---|
|
| Neiva (450 meters) |
|---|
|
| Jan | Feb | Mar | Apr | May | Jun | Jul | Aug | Sep | Oct | Nov | Dec |
|---|
| Min temp. | 23 | 23 | 23 | 23 | 23 | 23 | 23 | 24 | 24 | 23 | 23 | 23 |
|---|
| Max temp. | 34 | 34 | 33 | 33 | 33 | 33 | 34 | 35 | 35 | 34 | 32 | 33 |
|---|
| Precip. | 105 | 130 | 150 | 135 | 90 | 35 | 35 | 25 | 65 | 205 | 215 | 160 |
|---|
| Prec. days | 11 | 12 | 14 | 15 | 15 | 12 | 10 | 8 | 10 | 16 | 18 | 14 |
|---|
| Humidity | 61% | 61% | 66% | 66% | 65% | 59% | 54% | 47% | 49% | 59% | 69% | 67% |
|---|
| Day length | 12 | 12 | 12 | 12 | 12 | 12 | 12 | 12 | 12 | 12 | 12 | 12 |
|---|
| Sun hours | 6 | 6 | 5 | 5 | 5 | 6 | 6 | 5 | 5 | 6 | 6 | 6 |
|---|
|
| Nevado d. Ruiz (4,150 meters) |
|---|
|
| Jan | Feb | Mar | Apr | May | Jun | Jul | Aug | Sep | Oct | Nov | Dec |
|---|
| Min temp. | 1 | 1 | 1 | 2 | 2 | 2 | 1 | 1 | 1 | 1 | 1 | 1 |
|---|
| Max temp. | 9 | 9 | 9 | 9 | 8 | 9 | 9 | 9 | 8 | 8 | 8 | 8 |
|---|
|
|
|
|
|
| Popayán (1,750 meters) |
|---|
|
| Jan | Feb | Mar | Apr | May | Jun | Jul | Aug | Sep | Oct | Nov | Dec |
|---|
| Min temp. | 14 | 14 | 14 | 15 | 14 | 14 | 13 | 13 | 13 | 14 | 14 | 14 |
|---|
| Max temp. | 25 | 25 | 25 | 25 | 25 | 25 | 26 | 26 | 26 | 25 | 24 | 25 |
|---|
| Precip. | 210 | 165 | 210 | 205 | 165 | 85 | 55 | 50 | 110 | 265 | 330 | 265 |
|---|
| Prec. days | 18 | 16 | 20 | 21 | 21 | 14 | 11 | 10 | 15 | 24 | 24 | 23 |
|---|
|
| Day length | 12 | 12 | 12 | 12 | 12 | 12 | 12 | 12 | 12 | 12 | 12 | 12 |
|---|
| Sun hours | 5 | 5 | 4 | 4 | 4 | 5 | 6 | 5 | 5 | 4 | 4 | 4 |
|---|
|
| Quibdo |
|---|
|
| Jan | Feb | Mar | Apr | May | Jun | Jul | Aug | Sep | Oct | Nov | Dec |
|---|
| Min temp. | 24 | 24 | 24 | 24 | 24 | 24 | 23 | 23 | 23 | 23 | 23 | 24 |
|---|
| Max temp. | 30 | 30 | 31 | 31 | 32 | 31 | 31 | 31 | 31 | 30 | 30 | 30 |
|---|
| Precip. | 555 | 515 | 525 | 660 | 720 | 755 | 815 | 840 | 680 | 640 | 720 | 580 |
|---|
| Prec. days | 24 | 22 | 22 | 25 | 27 | 26 | 26 | 27 | 27 | 27 | 26 | 26 |
|---|
| Humidity | 84% | 84% | 83% | 83% | 83% | 83% | 82% | 82% | 82% | 83% | 84% | 85% |
|---|
| Day length | 12 | 12 | 12 | 12 | 12 | 12 | 12 | 12 | 12 | 12 | 12 | 12 |
|---|
| Sun hours | 3 | 3 | 3 | 3 | 4 | 4 | 4 | 4 | 4 | 4 | 4 | 3 |
|---|
|
| Riohacha |
|---|
|
| Jan | Feb | Mar | Apr | May | Jun | Jul | Aug | Sep | Oct | Nov | Dec |
|---|
| Min temp. | 23 | 23 | 24 | 25 | 26 | 26 | 26 | 26 | 25 | 24 | 24 | 24 |
|---|
| Max temp. | 32 | 33 | 32 | 33 | 34 | 35 | 36 | 35 | 34 | 33 | 32 | 33 |
|---|
| Precip. | 5 | 0 | 5 | 25 | 70 | 40 | 15 | 40 | 130 | 150 | 60 | 20 |
|---|
| Prec. days | 1 | 1 | 1 | 3 | 7 | 3 | 2 | 4 | 9 | 11 | 6 | 2 |
|---|
| Humidity | 65% | 63% | 68% | 68% | 68% | 63% | 58% | 68% | 72% | 76% | 76% | 68% |
|---|
| Day length | 12 | 12 | 12 | 12 | 13 | 13 | 13 | 12 | 12 | 12 | 12 | 12 |
|---|
| Sun hours | 8 | 8 | 8 | 6 | 6 | 8 | 8 | 8 | 7 | 7 | 7 | 8 |
|---|
| Sea temp | 26 | 26 | 26 | 26 | 27 | 28 | 27 | 28 | 28 | 29 | 28 | 27 |
|---|
| Tumaco |
|---|
|
| Jan | Feb | Mar | Apr | May | Jun | Jul | Aug | Sep | Oct | Nov | Dec |
|---|
| Min temp. | 23 | 23 | 24 | 24 | 24 | 24 | 23 | 24 | 24 | 24 | 23 | 23 |
|---|
| Max temp. | 29 | 29 | 30 | 30 | 29 | 29 | 29 | 29 | 29 | 29 | 29 | 29 |
|---|
| Precip. | 340 | 275 | 285 | 330 | 360 | 220 | 165 | 95 | 125 | 115 | 135 | 205 |
|---|
| Prec. days | 21 | 19 | 19 | 21 | 24 | 22 | 19 | 16 | 17 | 15 | 14 | 17 |
|---|
|
| Day length | 12 | 12 | 12 | 12 | 12 | 12 | 12 | 12 | 12 | 12 | 12 | 12 |
|---|
| Sun hours | 4 | 5 | 5 | 5 | 4 | 4 | 4 | 5 | 3 | 3 | 3 | 3 |
|---|
|
See also the
temperatures month by month