![]() Climate chart - Sao Pedro Da Aldeia (Rio de Janeiro)
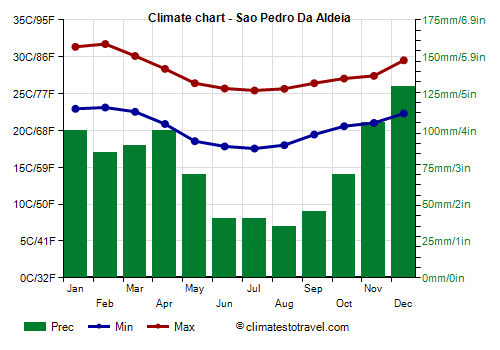
Climate chart - Sao Pedro Da Aldeia (Rio de Janeiro)
The climate of São Pedro da Aldeia is
tropical, with a relatively cool and dry season from May to August, and a hot and rainy season from November to March.
The city is located in Southern Brazil, in the state of Rio de Janeiro, at almost 23 degrees south latitude, and overlooks the Araruama lagoon, a salt lagoon where sports such as windsurfing and kitesurfing are practiced. In fact, the area is
windy, especially from August to February. Nearby are locations such as Cabo Frio, Arraial do Cabo, Armação dos Búzios, Iguaba Grande, and Araruama.
We are in the
Lakes Region, also known as the "Costa do Sol" Region, characterized by slightly lower temperatures (as the name of the locality Cabo Frio or "Cold Cape" suggests) and by slightly lower rainfall than in the city of Rio de Janeiro and in the part of the Brazilian coast further to the north. This is due to the influence, albeit marginal, of the Falklands current.
In winter, from May to August, there can be cool days, with highs of 20 °C (68 °F) or even lower.
In the hot season, from November to March, the sea breeze tempers the heat, however, there can be very hot periods. Sometimes, it can get very hot even in winter, when the wind blows from the mountains located to the north.
From mid-August to October, in spring, the temperature rises and there can be very hot periods, however, sometimes cool, winter-like weather can return. The rains become more frequent, although they are not yet as frequent as in the summer.

Best Time
The best time to visit São Pedro da Aldeia is from May to August, being the coolest and driest of the year. It must be said that the sea is not very warm, moreover, sometimes there can be cool days. For a beach holiday you can then choose the period from January to April, although it is hot and muggy and thunderstorms can break out.
Sao Pedro Da Aldeia - Climate data
The
average temperature of the coldest month (July) is of 21.5 °C (70.7 °F), that of the warmest month (February) is of 27.4 °C (81.4 °F). Here are the average temperatures.
Sao Pedro Da Aldeia - Average temperatures (1991-2020) | Month | Min (°C) | Max (°C) | Mean (°C) | Min (°F) | Max (°F) | Mean (°F) |
|---|
| January | 22.9 | 31.4 | 27.1 | 73 | 88 | 80.9 |
|---|
| February | 23.1 | 31.7 | 27.4 | 74 | 89 | 81.4 |
|---|
| March | 22.5 | 30.1 | 26.3 | 73 | 86 | 79.4 |
|---|
| April | 20.9 | 28.4 | 24.6 | 70 | 83 | 76.3 |
|---|
| May | 18.6 | 26.4 | 22.5 | 65 | 80 | 72.5 |
|---|
| June | 17.8 | 25.7 | 21.8 | 64 | 78 | 71.2 |
|---|
| July | 17.6 | 25.4 | 21.5 | 64 | 78 | 70.7 |
|---|
| August | 18 | 25.7 | 21.8 | 64 | 78 | 71.3 |
|---|
| September | 19.4 | 26.4 | 22.9 | 67 | 80 | 73.3 |
|---|
| October | 20.6 | 27 | 23.8 | 69 | 81 | 74.9 |
|---|
| November | 21 | 27.4 | 24.2 | 70 | 81 | 75.6 |
|---|
| December | 22.3 | 29.5 | 25.9 | 72 | 85 | 78.6 |
|---|
| Year | 20.4 | 27.9 | 24.1 | 68.7 | 82.2 | 75.5 |
|---|
amounts to 915 millimeters (36 inches) per year: so, it is at an intermediate level. It ranges from 35 mm (1.4 in) in the driest month (August) to 130 mm (5.1 in) in the wettest one (December). Here is the average precipitation.
Sao Pedro Da Aldeia - Average precipitation| Month | Millimeters | Inches | Days |
|---|
| January | 100 | 3.9 | 7 |
|---|
| February | 85 | 3.3 | 6 |
|---|
| March | 90 | 3.5 | 8 |
|---|
| April | 100 | 3.9 | 7 |
|---|
| May | 70 | 2.8 | 6 |
|---|
| June | 40 | 1.6 | 6 |
|---|
| July | 40 | 1.6 | 5 |
|---|
| August | 35 | 1.4 | 6 |
|---|
| September | 45 | 1.8 | 7 |
|---|
| October | 70 | 2.8 | 8 |
|---|
| November | 105 | 4.1 | 10 |
|---|
| December | 130 | 5.1 | 9 |
|---|
| Year | 915 | 36 | 86 |
|---|
The
sea temperature ranges from 22.5 °C (72 °F) in August, September to 26.5 °C (80 °F) in February, March. Here are the average sea temperatures.
Sao Pedro Da Aldeia - Sea temperature| Month | Celsius (°C) | Fahrenheit (°F) |
|---|
January | 25.5 | 78 | February | 26.5 | 79 | March | 26.5 | 80 | April | 26 | 79 | May | 25 | 77 | June | 23.5 | 74 | July | 23 | 73 | August | 22.5 | 72 | September | 22.5 | 72 | October | 23 | 73 | November | 24 | 75 | December | 25 | 77 | Year | 24.4 | 75.9 |
Sao Pedro Da Aldeia - Weather by month
Based on the period 1991-2020
January is generally a warm to hot, muggy month. The average temperature is of 27.1 °C (81 °F), with a minimum of 22.9 °C (73.3 °F) and a maximum of 31.4 °C (88.4 °F).

On the coldest nights of the month, the temperature usually drops to around 20.5 °C (68.5 °F). However, it dropped to 18 °C (64.4 °F) in January 2012.

On the warmest days of the month, the temperature usually reaches around 36 °C (96.5 °F). However, it reached 38 °C (100.4 °F) in January 2015.

Precipitation amounts to 100 mm (3.9 in), distributed over 7 days.
The day lasts on average 12 hours and 10 minutes.
The average humidity is 71%. Hence, the air is normally humid.
The average wind speed is 19 kph (12 mph).

The average sea temperature is of 25.5 °C (78.5 °F). Therefore, the sea is warm enough for swimming.
February, the hottest month of the year, is generally a warm to hot month. The average temperature is of 27.4 °C (81 °F), with a minimum of 23.1 °C (73.6 °F) and a maximum of 31.7 °C (89.1 °F).
On the coldest nights of the month, the temperature usually drops to around 20 °C (68.5 °F). However, it dropped to 19 °C (66.2 °F) in February 2008.
On the warmest days of the month, the temperature usually reaches around 36 °C (97 °F). However, it reached 38 °C (100.4 °F) in February 2010.
Precipitation amounts to 85 mm (3.3 in), distributed over 6 days.
The day lasts on average 12 hours and 10 minutes.
The average humidity is 69%.
The average wind speed is 20 kph (12 mph).
The average sea temperature is of 26.5 °C (79.5 °F). Therefore, the sea is pleasantly warm and allows long swims.
March is generally a warm to hot, muggy month. The average temperature is of 26.3 °C (79 °F), with a minimum of 22.5 °C (72.6 °F) and a maximum of 30.1 °C (86.2 °F).
On the coldest nights, the temperature usually drops to around 19 °C (66 °F). However, it dropped to 18 °C (64.4 °F) in March 2012.
On the warmest days, the temperature usually reaches around 35 °C (95 °F). However, it reached 37 °C (98.6 °F) in March 2010.
Precipitation amounts to 90 mm (3.5 in), distributed over 8 days.
The day lasts on average 12 hours and 5 minutes.
The average humidity is 74%. Hence, the air is normally humid.
The average wind speed is 15 kph (9 mph).
The average sea temperature is of 26.5 °C (80 °F). Therefore, the sea is pleasantly warm and allows long swims.
April is generally a warm to hot, muggy month. The average temperature is of 24.6 °C (76 °F), with a minimum of 20.9 °C (69.6 °F) and a maximum of 28.4 °C (83 °F).
On the coldest nights, the temperature usually drops to around 16.5 °C (62 °F). However, it dropped to 13 °C (55.4 °F) in April 2014.
On the warmest days, the temperature usually reaches around 34 °C (93 °F). However, it reached 37 °C (98.6 °F) in April 2012.
Precipitation amounts to 100 mm (3.9 in), distributed over 7 days.
The day lasts on average 12 hours and 5 minutes.
The average humidity is 76%. Hence, the air is normally humid.
The average wind speed is 14 kph (9 mph).
The average sea temperature is of 26 °C (79 °F). Therefore, the sea is warm enough for swimming.
May is generally a warm month. The average temperature is of 22.5 °C (72 °F), with a minimum of 18.6 °C (65.4 °F) and a maximum of 26.4 °C (79.5 °F).
On the coldest nights, the temperature usually drops to around 14 °C (57.5 °F). However, it dropped to 12 °C (53.6 °F) in May 2018.
On the warmest days, the temperature usually reaches around 32 °C (89.5 °F). However, it reached 34 °C (93.2 °F) in May 2017.
Precipitation amounts to 70 mm (2.8 in), distributed over 6 days.
The day lasts on average 12 hours and 0 minutes.
The average humidity is 75%. Hence, the air is normally humid.
The average wind speed is 13 kph (8 mph).
The average sea temperature is of 25 °C (76.5 °F). Therefore, the sea is warm enough for swimming.
June is generally a warm month. The average temperature is of 21.8 °C (71 °F), with a minimum of 17.8 °C (64.1 °F) and a maximum of 25.7 °C (78.3 °F).
On the coldest nights, the temperature usually drops to around 13.5 °C (56 °F). However, it dropped to 11 °C (51.8 °F) in June 2017.
On the warmest days, the temperature usually reaches around 31.5 °C (89 °F). However, it reached 35 °C (95 °F) in June 2000.
Precipitation amounts to 40 mm (1.6 in), distributed over 6 days.
The day lasts on average 12 hours and 0 minutes.
The average humidity is 76%. Hence, the air is normally humid.
The average wind speed is 13 kph (8 mph).
The average sea temperature is of 23.5 °C (74.5 °F). Therefore, the sea can be considered barely acceptable for swimming.
July, the coolest month of the year, is generally a warm month. The average temperature is of 21.5 °C (71 °F), with a minimum of 17.6 °C (63.6 °F) and a maximum of 25.4 °C (77.8 °F).
On the coldest nights of the month, the temperature usually drops to around 12.5 °C (54.5 °F). However, it dropped to 10 °C (50 °F) in July 2000.
On the warmest days of the month, the temperature usually reaches around 32 °C (89.5 °F). However, it reached 36 °C (96.8 °F) in July 2016.
Precipitation amounts to 40 mm (1.6 in), distributed over 5 days.
The day lasts on average 12 hours and 0 minutes.
The average humidity is 74%. Hence, the air is normally humid.
The average wind speed is 16 kph (10 mph).
The average sea temperature is of 23 °C (73 °F). Therefore, the sea can be considered barely acceptable for swimming.
August is generally a warm month. The average temperature is of 21.8 °C (71 °F), with a minimum of 18 °C (64.4 °F) and a maximum of 25.7 °C (78.2 °F).
On the coldest nights of the month, the temperature usually drops to around 13 °C (55.5 °F). However, it dropped to 12 °C (53.6 °F) in August 2000.
On the warmest days of the month, the temperature usually reaches around 32 °C (89.5 °F). However, it reached 34 °C (93.2 °F) in August 2000.
Precipitation amounts to 35 mm (1.4 in), distributed over 6 days.
The day lasts on average 12 hours and 0 minutes.
The average humidity is 72%. Hence, the air is normally humid.
The average wind speed is 19 kph (12 mph).
The average sea temperature is of 22.5 °C (72.5 °F). Therefore, the sea can be considered barely acceptable for swimming.
September is generally a warm to hot, muggy month. The average temperature is of 22.9 °C (73 °F), with a minimum of 19.4 °C (67 °F) and a maximum of 26.4 °C (79.5 °F).
On the coldest nights, the temperature usually drops to around 14.5 °C (58.5 °F). However, it dropped to 12 °C (53.6 °F) in September 2012.
On the warmest days, the temperature usually reaches around 33 °C (91.5 °F). However, it reached 36 °C (96.8 °F) in September 2008.
Precipitation amounts to 45 mm (1.8 in), distributed over 7 days.
The day lasts on average 12 hours and 5 minutes.
The average humidity is 72%. Hence, the air is normally humid.
The average wind speed is 21 kph (13 mph).
The average sea temperature is of 22.5 °C (72 °F). Therefore, the sea can be considered barely acceptable for swimming.
October is generally a warm to hot, muggy month. The average temperature is of 23.8 °C (75 °F), with a minimum of 20.6 °C (69 °F) and a maximum of 27 °C (80.7 °F).
On the coldest nights, the temperature usually drops to around 15.5 °C (59.5 °F). However, it dropped to 12 °C (53.6 °F) in October 2014.
On the warmest days, the temperature usually reaches around 33.5 °C (92 °F). However, it reached 35 °C (95 °F) in October 2014.
Precipitation amounts to 70 mm (2.8 in), distributed over 8 days.
The day lasts on average 12 hours and 10 minutes.
The average humidity is 73%. Hence, the air is normally humid.
The average wind speed is 21 kph (13 mph).
The average sea temperature is of 23 °C (73 °F). Therefore, the sea can be considered barely acceptable for swimming.
November is generally a warm to hot, muggy month. The average temperature is of 24.2 °C (76 °F), with a minimum of 21 °C (69.9 °F) and a maximum of 27.4 °C (81.3 °F).
On the coldest nights, the temperature usually drops to around 16.5 °C (62 °F). However, it dropped to 14 °C (57.2 °F) in November 2011.
On the warmest days, the temperature usually reaches around 34 °C (93.5 °F). However, it reached 38 °C (100.4 °F) in November 2019.
Precipitation amounts to 105 mm (4.1 in), distributed over 10 days.
The day lasts on average 12 hours and 10 minutes.
The average humidity is 77%. Hence, the air is normally humid.
The average wind speed is 19 kph (12 mph).
The average sea temperature is of 24 °C (75 °F). Therefore, the sea is warm enough for swimming.
December is generally a warm to hot, muggy month. The average temperature is of 25.9 °C (79 °F), with a minimum of 22.3 °C (72.1 °F) and a maximum of 29.5 °C (85.1 °F).
On the coldest nights of the month, the temperature usually drops to around 18.5 °C (65 °F). However, it dropped to 15 °C (59 °F) in December 2018.
On the warmest days of the month, the temperature usually reaches around 35.5 °C (96 °F). However, it reached 38 °C (100.4 °F) in December 2014.
Precipitation amounts to 130 mm (5.1 in), distributed over 9 days.
The day lasts on average 12 hours and 20 minutes.
The average humidity is 75%. Hence, the air is normally humid.
The average wind speed is 17 kph (11 mph).
The average sea temperature is of 25 °C (77 °F). Therefore, the sea is warm enough for swimming.