Select units of measurement for the temperature and rainfall tables (metric or imperial).
Average weather, temperature, rainfall, sunshine hours
The climate of Lanzhou (or Lan-chou) is
arid continental, with very cold, dry winters and hot, quite rainy summers.
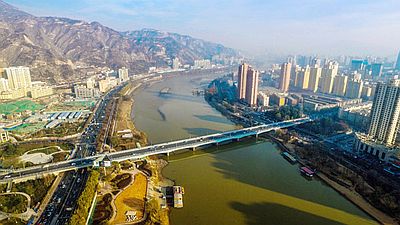
The city is the capital of the province of Gansu and is located in central-western China, at 36 degrees north latitude, in a mountain valley crossed by the Huang He (or Yellow River), at 1,600 meters (5,250 feet) above sea level.
The
winter is dry and sunny. Even though the temperatures are low, snowfalls are rare. The cold record is -20 °C (-4 °F), set in December 1975.
The
summer is the only season to experience significant rains. In periods of good weather, the temperature can reach 35 °C (95 °F), and sometimes as high as 38/40 °C (100/104 °F).
The data below refer to the city of Lanzhou, while the values of the Zhongchuan airport, which is located to the north and at 1,900 meters (6,235 feet) above sea level, are not representative of the city, being much colder.

Best Time
To visit Lanzhou, you can choose the months of May and September. In summer, temperatures are generally acceptable, but it can sometimes be very hot, and it is also the wettest season, especially in August.
Lanzhou - Climate data
In Lanzhou, the
average temperature of the coldest month (January) is of
-3.1 °C, that of the warmest month (July) is of
24 °C. Here are the average temperatures.
Lanzhou - Average temperatures (1991-2020) |
| Month | Min | Max | Mean |
|---|
| January | -8.4 | 2.3 | -3.1 |
|---|
| February | -4.3 | 7.6 | 1.6 |
|---|
| March | 1.6 | 14.1 | 7.8 |
|---|
| April | 7.2 | 20.7 | 14 |
|---|
| May | 11.5 | 24.9 | 18.2 |
|---|
| June | 15.8 | 28.6 | 22.2 |
|---|
| July | 17.9 | 30.2 | 24 |
|---|
| August | 16.9 | 28.8 | 22.8 |
|---|
| September | 12.6 | 23.6 | 18.1 |
|---|
| October | 6.1 | 17.5 | 11.8 |
|---|
| November | -0.9 | 10.3 | 4.7 |
|---|
| December | -7 | 3.5 | -1.8 |
|---|
| Year | 5.8 | 17.7 | 11.75 |
|---|
amounts to
310 millimeters per year: it is therefore scarce. It ranges from
0.7 millimeters in the driest month (December) to
65 millimeters in the wettest ones (July, August) Here is the average precipitation.
Lanzhou - Average precipitation| Month | Days |
|---|
| January | 2 | 2 |
|---|
| February | 3 | 2 |
|---|
| March | 7 | 4 |
|---|
| April | 15 | 6 |
|---|
| May | 40 | 8 |
|---|
| June | 45 | 9 |
|---|
| July | 65 | 11 |
|---|
| August | 65 | 10 |
|---|
| September | 45 | 10 |
|---|
| October | 20 | 6 |
|---|
| November | 3 | 2 |
|---|
| December | 1 | 1 |
|---|
| Year | 310 | 71 |
|---|
There are on average around 2425
sunshine hours per year. Here are the average hours of sunshine per day.
Lanzhou - Sunshine hours| Month | Average | Total |
|---|
| January | 5 | 155 |
|---|
| February | 6.5 | 180 |
|---|
| March | 6.5 | 195 |
|---|
| April | 7.5 | 225 |
|---|
| May | 8 | 245 |
|---|
| June | 8 | 235 |
|---|
| July | 8 | 245 |
|---|
| August | 8 | 240 |
|---|
| September | 6.5 | 190 |
|---|
| October | 6 | 185 |
|---|
| November | 6 | 175 |
|---|
| December | 5 | 150 |
|---|
| Year | 6.6 | 2425 |
|---|