Select units of measurement for the temperature and rainfall tables (metric or imperial).
Average weather, temperature, rainfall, sunshine
In Vietnam, a country in Southeast Asia, the climate is
subtropical in the north and
tropical in the center and south. Moreover, the climate is influenced by the monsoons. The
south-west monsoon, from May to October, brings heavy rainfall in the exposed areas, ie both the north and the south, while along the central part, protected by the mountains, it brings relatively little rain and leaves often space to the sun. The
north-east monsoon, from October to April, is generally drier, but brings heavy rains in the early months (October-December) along the coast exposed to the east, and light but frequent rains in the north.
In inland areas, there are
hills and mountains, which make the climate milder in the summer months, but even cold in winter in the north.
The
rains are usually abundant, in fact they normally fluctuate between 1,500 and 2,500 millimeters (60 and 98 inches) per year, but there is also a relatively small arid zone in the Phan Thiet area (north-east of Ho Chi Minh City), where they are slightly above 1,000 mm (40 in).
The
sun does not often shine in northern Vietnam, where there are just 1,500/1,600 hours of sunshine a year. The centre-south is sunnier, in fact, there are from 2,100 to 2,900 hours of sunshine per year.
The climate in detail
The north
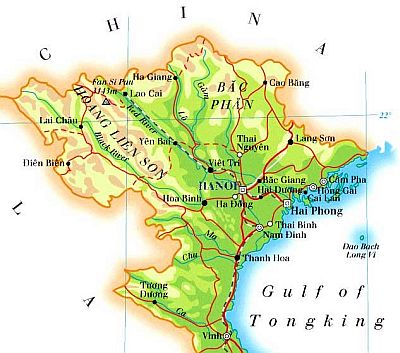
In northern Vietnam,
winter is unusually cool for the latitude: we are just south of the Tropic of Cancer, yet the average temperature in January is below 20 °C (68 °F). The average is 17 °C (62.5 °F) in Hanoi and 18 °C (64.5 °F) in
Vinh, while it's around 15 °C (59 °F) in the northernmost areas of Tonkin, where the temperature at night can approach freezing (0 °C or 32 °F) between December and February (and sometimes in early March).
The winter monsoon is originally dry because it comes from the Asian continent, but the clash with the mild and moist air of the Gulf of Tonkin generates compact cloudiness, which bring
light but frequent rains. Therefore, during winter, the
sun rarely shines, and although the temperature is spring-like, a journey to this city would not be so pleasant.
In
spring, the temperature gradually rises in northern Vietnam, and the sun comes out every so often in April, but then, from May to October, it's the
rainy season, and the weather becomes hot and humid, with downpours in the afternoon or evening.
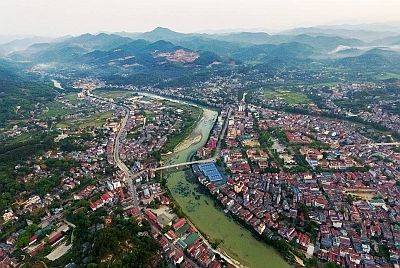
In
Cao Bang, located in the north-east, a short distance from the border with China, in a valley at 200 meters (650 feet) above sea level, winter is mild, however, the temperature can sometimes drop below 5 °C (41 °F) from December to February.
In April and May, before the monsoon, the temperature can reach 38/39 °C (100/102 °F), but this can also happen from June to September, in periods of good weather.
In Cao Bang, 1,425 mm (56 in) of rain fall per year. In winter, the rains are weak but they are quite frequent, while they are abundant from May to September (and sometimes in October), during the summer monsoon period.

The capital,
Hanoi, is a little further to the south and about 90 km (55 mi) from the sea, at the beginning of the Red River delta.
Winter averages are a little higher than in the far north, however, sometimes there can be
very cool periods here as well, with lows around 7/8 °C (45/46 °F) and highs around 15 °C (59 °F); more rarely, it can even get cold for a few days, and highs can drop to around 10 °C (50 °F).
Here too, in April and May, before the monsoon, it can get
very hot, but also from June to September, in the pauses between a period of bad weather and the next.
On average, about 1,600 mm (63 in) of
rain fall per year, with a maximum from June to September. In winter, especially from January onwards, there are frequent drizzles.
Hanoi is a
dull city, in fact, the sun is rarely seen from January to April, but even in summer, it does not shine very often because of the summer monsoon. There are about 1,585 hours of sunshine per year.
In the northernmost part of the coast, near Hanoi (see
Haiphong), the
sea is a bit cool from January to March, while it is very warm in the summer months. Anyway, in winter, cool and cloudy weather conditions which prevail in this season are usually not inviting for swimming.

In the northern
mountainous areas, winter is quite cold: at 1,500 meters (5,000 feet) of altitude, the average temperature in January is around 9 °C (48 °F). The highest peak is Fansipan (or Phan Xi Pang), 3,143 meters (10,311 feet) high, which is covered with snow in winter.
In
Sa Pa, a city located at 1,500 meters (5,000 feet), and at the foot of the Fansipan, in winter, there can be days with highs below 5 °C (41 °F).
From April to September, on the hottest days the temperature can reach 28/29 °C (82/84 °F).
On top of Fansipan, the temperature is about 10 degrees Celsius (19 degrees Fahrenheit) lower than in Sa Pa.
In Sa Pa, rainfall is abundant, so much so that it amounts to 2,800 mm (112 in) per year, and exceeds 300 mm (12 in) per month from May to September. In winter, the rains are frequent, but they are a little more abundant than in the plains.
The center
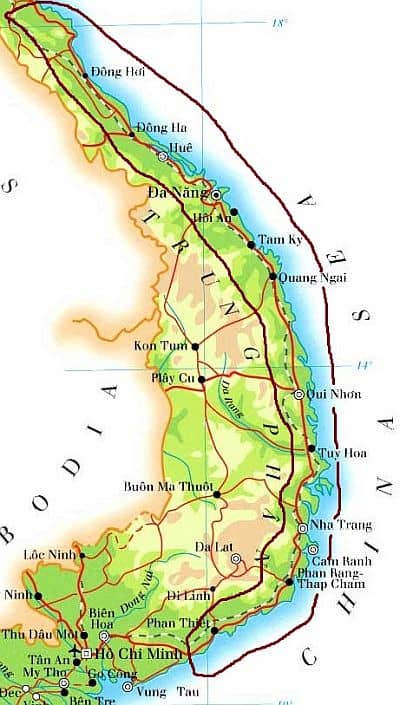
Along the coast of central Vietnam, the winter is warmer: the average temperature in January ranges from 19.5 °C (67 °F) in
Dong Hoi to 24.5 °C (76 °F) in Nha Trang. In addition,
the summer monsoon produces little effects, especially in the central-southern part, so that less than 100 mm (4 in) of rain fall per month until August, and the amount of sunshine remains acceptable.
On the other hand, the summer is
very hot, so much so that highs from June to August are on average around 34/35 °C (93/95 °F), but sometimes they can reach 40 °C (104 °F).
Here, the rainy season comes later, and runs
from September to December, but even to January in the northern part (from Ha Tinh to Da Nang), with a maximum in October and November, when the rains can be torrential. These intense rains at the end of the year are due to the
retreating monsoon, which particularly affects the part of the coast exposed to the north-east: in
Hue, 2,800 mm (110 in) of rain fall per year, of which 750 mm (29.5 in) in October.
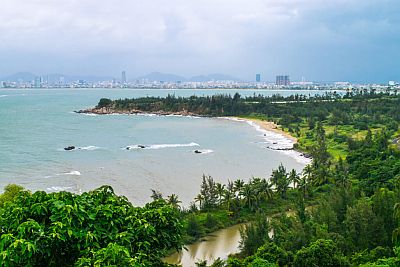
In
Da Nang, located on the east coast of Vietnam at 16 degrees north latitude, winter is much warmer than in the north and in Hanoi. From December to February, the temperature generally drops to around 14/15 °C (57/59 °F), and sometimes below.
From April to August, the temperature can reach 39/40 °C (102/104 °F). As we have said, in the summer, the monsoon has limited effects in this central part of Vietnam, which is why there are long periods of very hot weather.
In Da Nang, it rains less than in Hue, but the trend is similar, and the rains are abundant from September to December.
In Da Nang, the
sun shines more often than in the north and in Hanoi, both in winter (even though it does not go beyond 3.5/5 hours per day) and in summer, when it shines for a good number of hours (especially from May to July).
In the central part of Vietnam, the
sea is warm enough for swimming all year round, although it drops in February to 23 °C (73 °F) in Hue and to 23.5 °C (74.5 °F) in Da Nang.
Continuing south, the rainfall pattern remains more or less the same at
Quang Ngai and
Duc Pho, while further south, precipitation drops below 2,000 mm (80 in) per year. In addition, winter temperatures gradually increase, and the likelihood of cold air coming from the north decreases.
In
Quy Nhon, a city located on the coast in the province of Bình Dinh, it is definitely warm even in winter, in fact the January average is 24 °C (75 °F). The warming in spring is less evident than in the cities further north, on the other hand, summer is very hot here too, and from June to August the temperature can reach 39 °C (102 °F).
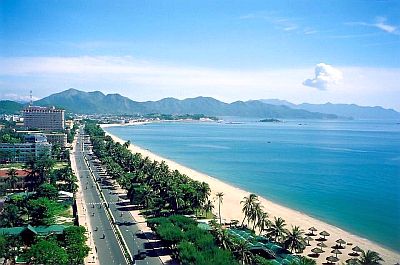
Further south on the coast, in
Nha Trang, the temperatures are similar, but the winter is slightly warmer, while in the summer the temperatures are a bit lower. From May to September, the temperature generally reaches 35/36 °C (95/97 °F) on the hottest days.
In this area, where the coast begins to be exposed to the south-east, precipitation drops below 1,500 mm (60 in) per year. Here too, however, the rainy period runs from September to December.
In Nha Trang the sun often shines for a long period, from February to August, and for a total of 2,500 hours per year.
In Nha Trang, the sea is warmer in winter, in fact the water temperature reaches a minimum of 25.5 °C (78 °F) in January and February.
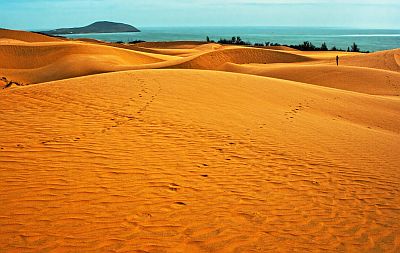
South of this area, in the Binh Thuan province, the rains are even less abundant: in
Phan Thiet, just 1,050 mm (41 in) of rain fall per year, which is not a very low value, however, the landscape is semi-arid, and in the Mui Ne area, even sand dunes are found.
Inland areas
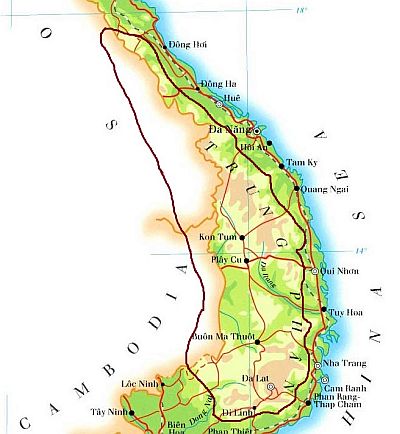
In the interior of central Vietnam,
the climate is milder due to the presence of mountains (the Central Highlands), in fact, there are many cities located between 400 and 1,000 meters (1,300 and 3,300 feet) above sea level, where winters are nice and sunny, while summers are a bit less sultry than at sea level.
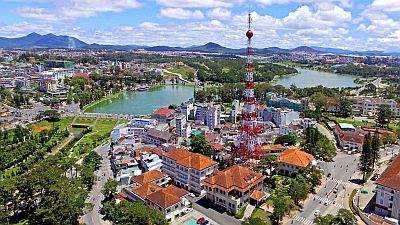 Da Lat
 is even at 1,500 meters (4,900 ft) above sea level, and has a fairly cool climate.
In Da Lat, rainfall amounts to 1,750 mm (69 in) per year, and exceeds 150 mm (6 in) per month from April to October.
In
Pleiku, located at 750 meters (2,450 ft) above sea level, the hottest period is from March to May, before the monsoon, when the temperature generally reaches 32/33 °C (90/91 °F), but can sometimes reach 35 °C (95 °F). Here, the monsoon rains occur in the canonical period, from May to October, with a maximum between June and September.
The south

In the southern part of Vietnam and on the southern islands (see
Con Dao,
Phu Quoc), the climate is
hot all year round, while the rainy period is the summer, as happens in the north and in the inland areas of the center.
Between November and mid-February, the maximum temperatures are around 31/32 °C (88/90 °F), while by mid-February, the temperatures starts to rise, and reach the highest level of the year between March and May: 33/35 °C (91/95 °F) on average, but with peaks of 40 °C (104 °F), before the arrival of the monsoon. During the period of the summer monsoon, the heat is quite muggy.

In
Ho Chi Minh City (formerly Saigon), the largest city of Vietnam, located not far from the Mekong Delta, the winter is hot, in fact the January average is 27 °C (80.5 °F). In the coolest nights, the temperature can sometimes drop to 16/17 °C (61/63 °F).
Until May, Ho Chi Minh is the hottest city in Vietnam. The temperature rises until the monsoon arrives, and from March to May it can reach 39 °C (102 °F).
In Ho Chi Minh, the rains amount to about 1,930 mm (76 in) per year, and are abundant from May to mid-November, with a maximum in September.
In southern Vietnam, the sea is warm all year round.
Typhoons
Vietnam is located in the path of
typhoons, the tropical cyclones of the western Pacific, which affect the country from the east, from the South China Sea, generally
from April 20 to December 10. Since cyclones hit directly the coast from the sea, when they are at their maximum strength, Vietnam, especially in the northern part, is one of the most affected countries of Southeast Asia.
The area more often affected is
the north, in particular, the Gulf of Tonkin and the Red River delta. A particularly destructive typhoon was the one that devastated Haiphong in early October 1881. In the north, typhoons generally occur
from May 20 to mid-November, with a maximum from July to October. Typically, in July and August, typhoons only affect northern Vietnam.
In
the center, typhoons generally occur from late April to late June (more rarely and generally not strong) and
from the beginning of September to December 10. For example, Nha Trang was hit by Typhoon Damrey in early November 2017.
In
the south, typhoons generally occur
from October 15 to December 20 with a maximum in early November.
In the south, where the sea is warm all year round, typhoons can also form in winter, but in this period they are weak and often do not even reach the coast. Typically, the only time they don't form even in the south is from February to mid-March.
In January, and again from mid-March to mid-April, some tropical depressions can occasionally form, generally off the central-southern coast, but they almost always dissipate over the sea before reaching the coast. However, they can cause abnormal waves.
When to go
It is difficult to find the
best time to visit all of Vietnam. In general, it is better to avoid very hot periods, the monsoon rainy season and the typhoon period.
The
rainy season runs roughly from May to October in the north (see Hanoi) and in inland central areas, from September to December on the south-central coast (see Hue, Da Nang, Quy Nhon, Nha Trang) and from May to November in the south (see Ho Chi Minh).
Typhoons typically arrive from May 20 to mid-November in the north, from early September to December 10 in the center, and from October 15 to December 20, with a maximum in early November, in the south.
The
hottest period of the year goes from May to September in the center-north, but sometimes it can be very hot even in April. In the south, on the other hand, where it is hot even in winter, the hottest period goes from March to May, i.e. before the summer monsoon.
In the
north (see Hanoi) there is no season that is mild, dry and sunny at the same time. In winter, from December to February (and more rarely in the first half of March), the weather is generally cool or mild, but there is little sun, there are frequent rains, and sometimes it can be a bit cold. In the mountains, then, it can get very cold and it can snow.
Therefore, if you want to visit Vietnam as a whole, you can choose the months of
March and April, because in the north the climate is milder than in winter, although there is not much sun and the rains are enough frequent, while in the centre-south it is a dry and sunny period. It must be said that in the south it is very hot, in addition, in the central-south, there is a gradual increase in the risk of typhoons from mid-March onwards. However, during this period, you can go to the beach throughout the country.
Otherwise, if you fear the heat, you can choose the period of
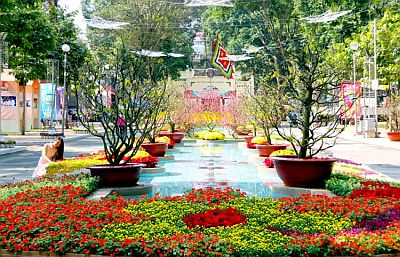
Tet (Têt Nguyên Ðán), the Vietnamese New Year, which traditionally marks the beginning of spring and occurs from January 21 to February 19 depending on the year. In this period, the weather is generally cool and cloudy in the north, with frequent drizzles, and sometimes even cold, while in the centre-south it is progressively warmer and sunnier, but in the south it is not as hot as in the following months. Moreover, in this period the country is covered with flowers.
In the period of
Christmas and New Year, therefore between the end of December and the beginning of January, the weather is similar to that of the Tet, i.e. cool and cloudy in the north, hot and sunny in the south, however, in the central part of the coast, the last rains related to the "retreating monsoon" occur.
If you want to go in
July and August, you can choose the south-central coast (from Da Nang and the Cham islands to Phan Thiet, including Nha Trang), where, as mentioned above, it is sunny and not very rainy, and generally, in this period, it is also spared by typhoons. It must be said that in this period, it can get very hot in this area.
For swimming, in the north, the
sea is a bit cool from January to March, while it is very warm in the summer months. Anyway, in winter, cool and cloudy weather conditions which prevail in this season are usually not inviting for swimming. Already in the center, on the other hand, the sea is warm enough for swimming all year round, although only in the south, both air and sea temperatures are fully summery even in winter.
What to pack
In
winter: in the north (Hanoi), pack spring/autumn clothes, a jacket and a sweater, a raincoat for the drizzle, and a hat and gloves for colder nights. In mountain peaks, pack warm clothes, such as a down jacket, gloves, a hat, and hiking shoes.
In the center (Hue, Nha Trang), pack light clothes for the day, a sweatshirt and a scarf for the breeze, a jacket and a sweater for cooler evenings, and a raincoat or umbrella until January inclusive.
For the inland south-central areas, light clothes for the day, and a jacket and a sweater for the evening.
For the south (Ho Chi Minh), light clothing, a scarf for the breeze, a light sweatshirt for the evening, and possibly a light jacket or sweater for cooler evenings.
In
summer: across the country, at low altitude, pack tropics-friendly, lightweight clothing of natural fibers, a light raincoat or umbrella, and a light sweatshirt for the evening; for the towns located at an altitude higher than sea level, you can add a sweatshirt and a light jacket; for the highest peaks, warm clothes, a fleece, a jacket, a raincoat, and hiking boots.
When going to the reef, you can bring snorkeling equipment, including water shoes or rubber-soled shoes.
Before entering pagodas, it is customary to take off shoes, dress neatly and cover a little.
Climate data - Vietnam
| Cao Bang |
|---|
|
| Jan | Feb | Mar | Apr | May | Jun | Jul | Aug | Sep | Oct | Nov | Dec |
|---|
| Min temp. | 12 | 14 | 17 | 20 | 23 | 24 | 24 | 24 | 23 | 20 | 16 | 12 |
|---|
| Max temp. | 18 | 21 | 24 | 28 | 32 | 33 | 33 | 33 | 32 | 29 | 25 | 21 |
|---|
| Precip. | 25 | 25 | 50 | 85 | 185 | 235 | 270 | 260 | 140 | 85 | 45 | 20 |
|---|
| Prec. days | 9 | 9 | 10 | 12 | 15 | 17 | 19 | 18 | 12 | 10 | 7 | 6 |
|---|
|
|
| Sun hours | 2 | 2 | 3 | 4 | 5 | 5 | 6 | 6 | 6 | 5 | 4 | 4 |
|---|
|
| Da Lat (1,500 meters) |
|---|
|
| Jan | Feb | Mar | Apr | May | Jun | Jul | Aug | Sep | Oct | Nov | Dec |
|---|
| Min temp. | 11 | 12 | 13 | 14 | 16 | 16 | 16 | 16 | 16 | 15 | 14 | 13 |
|---|
| Max temp. | 22 | 24 | 25 | 25 | 24 | 23 | 23 | 22 | 23 | 22 | 22 | 21 |
|---|
| Precip. | 15 | 10 | 50 | 170 | 190 | 215 | 230 | 250 | 280 | 240 | 85 | 20 |
|---|
| Prec. days | 2 | 2 | 5 | 11 | 16 | 20 | 22 | 23 | 24 | 19 | 8 | 3 |
|---|
|
|
| Sun hours | 8 | 8 | 8 | 7 | 6 | 5 | 5 | 4 | 4 | 5 | 6 | 7 |
|---|
|
| Da Nang |
|---|
|
| Jan | Feb | Mar | Apr | May | Jun | Jul | Aug | Sep | Oct | Nov | Dec |
|---|
| Min temp. | 19 | 20 | 22 | 24 | 25 | 26 | 25 | 25 | 24 | 23 | 22 | 20 |
|---|
| Max temp. | 25 | 26 | 28 | 31 | 34 | 35 | 35 | 34 | 32 | 30 | 28 | 25 |
|---|
| Precip. | 85 | 25 | 20 | 35 | 85 | 90 | 85 | 115 | 310 | 650 | 430 | 215 |
|---|
| Prec. days | 12 | 6 | 4 | 5 | 10 | 9 | 9 | 11 | 14 | 20 | 20 | 18 |
|---|
| Humidity | 83% | 82% | 82% | 80% | 76% | 71% | 72% | 74% | 80% | 83% | 83% | 84% |
|---|
| Day length | 11 | 12 | 12 | 12 | 13 | 13 | 13 | 13 | 12 | 12 | 11 | 11 |
|---|
| Sun hours | 4 | 5 | 6 | 7 | 8 | 8 | 8 | 7 | 6 | 5 | 4 | 3 |
|---|
| Sea temp | 24 | 24 | 24 | 26 | 28 | 29 | 30 | 30 | 29 | 28 | 27 | 25 |
|---|
| Haiphong |
|---|
|
| Jan | Feb | Mar | Apr | May | Jun | Jul | Aug | Sep | Oct | Nov | Dec |
|---|
| Min temp. | 15 | 16 | 18 | 22 | 25 | 26 | 26 | 26 | 25 | 23 | 19 | 16 |
|---|
| Max temp. | 20 | 21 | 23 | 27 | 31 | 33 | 32 | 32 | 31 | 29 | 26 | 22 |
|---|
| Precip. | 25 | 30 | 50 | 95 | 200 | 245 | 225 | 360 | 255 | 155 | 40 | 20 |
|---|
| Prec. days | 8 | 13 | 17 | 14 | 12 | 15 | 14 | 17 | 14 | 11 | 6 | 5 |
|---|
|
|
| Sun hours | 3 | 2 | 1 | 3 | 6 | 6 | 7 | 6 | 6 | 6 | 5 | 4 |
|---|
| Sea temp | 21 | 21 | 22 | 24 | 27 | 29 | 30 | 30 | 30 | 28 | 26 | 23 |
|---|
| Hanoi |
|---|
|
| Jan | Feb | Mar | Apr | May | Jun | Jul | Aug | Sep | Oct | Nov | Dec |
|---|
| Min temp. | 14 | 16 | 18 | 22 | 24 | 26 | 26 | 26 | 25 | 22 | 19 | 15 |
|---|
| Max temp. | 20 | 22 | 24 | 28 | 32 | 34 | 34 | 33 | 32 | 30 | 26 | 22 |
|---|
| Precip. | 20 | 20 | 35 | 105 | 165 | 265 | 255 | 275 | 245 | 155 | 60 | 20 |
|---|
| Prec. days | 10 | 12 | 16 | 14 | 14 | 15 | 16 | 17 | 14 | 11 | 8 | 5 |
|---|
| Humidity | 78% | 81% | 85% | 84% | 81% | 79% | 81% | 84% | 81% | 76% | 74% | 73% |
|---|
| Day length | 11 | 12 | 12 | 13 | 13 | 13 | 13 | 13 | 12 | 12 | 11 | 11 |
|---|
| Sun hours | 2 | 2 | 2 | 3 | 6 | 6 | 6 | 6 | 6 | 5 | 5 | 4 |
|---|
|
| Ho Chi Minh |
|---|
|
| Jan | Feb | Mar | Apr | May | Jun | Jul | Aug | Sep | Oct | Nov | Dec |
|---|
| Min temp. | 22 | 23 | 24 | 26 | 25 | 25 | 24 | 24 | 24 | 24 | 23 | 22 |
|---|
| Max temp. | 32 | 33 | 34 | 35 | 35 | 33 | 33 | 33 | 32 | 32 | 32 | 32 |
|---|
| Precip. | 15 | 5 | 10 | 50 | 220 | 310 | 295 | 270 | 325 | 265 | 115 | 50 |
|---|
| Prec. days | 2 | 1 | 2 | 5 | 18 | 19 | 23 | 22 | 23 | 21 | 12 | 7 |
|---|
| Humidity | 70% | 68% | 68% | 71% | 78% | 82% | 83% | 83% | 85% | 84% | 80% | 75% |
|---|
| Day length | 12 | 12 | 12 | 12 | 13 | 13 | 13 | 12 | 12 | 12 | 12 | 12 |
|---|
| Sun hours | 8 | 9 | 9 | 8 | 6 | 6 | 6 | 6 | 5 | 6 | 7 | 7 |
|---|
| Sea temp | 25 | 25 | 26 | 28 | 29 | 29 | 29 | 29 | 29 | 28 | 28 | 26 |
|---|
| Nha Trang |
|---|
|
| Jan | Feb | Mar | Apr | May | Jun | Jul | Aug | Sep | Oct | Nov | Dec |
|---|
| Min temp. | 22 | 22 | 23 | 25 | 26 | 26 | 26 | 26 | 25 | 24 | 24 | 23 |
|---|
| Max temp. | 27 | 28 | 29 | 31 | 32 | 33 | 32 | 33 | 32 | 30 | 29 | 27 |
|---|
| Precip. | 40 | 15 | 30 | 35 | 70 | 60 | 35 | 50 | 160 | 300 | 330 | 155 |
|---|
| Prec. days | 8 | 4 | 3 | 4 | 8 | 9 | 8 | 10 | 15 | 18 | 18 | 14 |
|---|
| Humidity | 78% | 77% | 78% | 79% | 78% | 76% | 76% | 76% | 79% | 81% | 81% | 80% |
|---|
| Day length | 12 | 12 | 12 | 12 | 13 | 13 | 13 | 12 | 12 | 12 | 12 | 11 |
|---|
| Sun hours | 6 | 7 | 8 | 9 | 8 | 8 | 8 | 8 | 7 | 6 | 5 | 5 |
|---|
| Sea temp | 25 | 26 | 27 | 28 | 29 | 29 | 29 | 29 | 29 | 28 | 27 | 26 |
|---|
| Pleiku (750 meters) |
|---|
|
| Jan | Feb | Mar | Apr | May | Jun | Jul | Aug | Sep | Oct | Nov | Dec |
|---|
| Min temp. | 16 | 16 | 19 | 20 | 21 | 21 | 21 | 21 | 21 | 19 | 18 | 17 |
|---|
| Max temp. | 26 | 28 | 29 | 30 | 29 | 27 | 26 | 26 | 26 | 26 | 26 | 25 |
|---|
| Precip. | 5 | 5 | 20 | 95 | 245 | 345 | 390 | 475 | 360 | 190 | 65 | 10 |
|---|
| Prec. days | 1 | 1 | 3 | 8 | 18 | 23 | 26 | 27 | 25 | 16 | 7 | 2 |
|---|
| Humidity | 71% | 67% | 68% | 72% | 80% | 87% | 89% | 90% | 88% | 83% | 79% | 76% |
|---|
| Day length | 11 | 12 | 12 | 12 | 13 | 13 | 13 | 13 | 12 | 12 | 12 | 11 |
|---|
| Sun hours | 9 | 9 | 9 | 8 | 7 | 5 | 5 | 4 | 4 | 6 | 7 | 8 |
|---|
|
| Quy Nhon |
|---|
|
| Jan | Feb | Mar | Apr | May | Jun | Jul | Aug | Sep | Oct | Nov | Dec |
|---|
| Min temp. | 21 | 22 | 23 | 25 | 27 | 27 | 27 | 27 | 26 | 25 | 24 | 22 |
|---|
| Max temp. | 27 | 28 | 30 | 32 | 33 | 34 | 34 | 34 | 33 | 30 | 28 | 27 |
|---|
| Precip. | 65 | 30 | 25 | 30 | 85 | 65 | 40 | 60 | 225 | 550 | 435 | 200 |
|---|
| Prec. days | 13 | 6 | 4 | 4 | 9 | 8 | 7 | 9 | 16 | 21 | 21 | 19 |
|---|
| Humidity | 80% | 79% | 80% | 80% | 78% | 72% | 70% | 69% | 76% | 81% | 82% | 81% |
|---|
| Day length | 11 | 12 | 12 | 12 | 13 | 13 | 13 | 13 | 12 | 12 | 12 | 11 |
|---|
| Sun hours | 5 | 7 | 8 | 9 | 9 | 8 | 8 | 8 | 6 | 5 | 4 | 4 |
|---|
| Sea temp | 25 | 25 | 26 | 28 | 29 | 29 | 29 | 29 | 29 | 28 | 27 | 26 |
|---|
| Sa Pa (1,500 meters) |
|---|
|
| Jan | Feb | Mar | Apr | May | Jun | Jul | Aug | Sep | Oct | Nov | Dec |
|---|
| Min temp. | 6 | 8 | 11 | 14 | 16 | 18 | 18 | 17 | 16 | 14 | 10 | 7 |
|---|
| Max temp. | 12 | 14 | 18 | 21 | 22 | 23 | 23 | 23 | 22 | 19 | 16 | 13 |
|---|
| Precip. | 65 | 80 | 105 | 215 | 345 | 410 | 465 | 450 | 315 | 215 | 110 | 65 |
|---|
| Prec. days | 15 | 16 | 16 | 18 | 22 | 24 | 26 | 24 | 20 | 18 | 14 | 12 |
|---|
|
|
| Sun hours | 4 | 4 | 5 | 6 | 5 | 3 | 3 | 4 | 3 | 3 | 4 | 4 |
|---|
|
| Vinh |
|---|
|
| Jan | Feb | Mar | Apr | May | Jun | Jul | Aug | Sep | Oct | Nov | Dec |
|---|
| Min temp. | 16 | 17 | 19 | 22 | 25 | 27 | 27 | 26 | 25 | 23 | 20 | 17 |
|---|
| Max temp. | 21 | 22 | 24 | 29 | 33 | 35 | 34 | 33 | 31 | 28 | 25 | 22 |
|---|
| Precip. | 50 | 40 | 45 | 65 | 130 | 115 | 120 | 225 | 515 | 540 | 185 | 75 |
|---|
| Prec. days | 13 | 14 | 14 | 11 | 11 | 9 | 7 | 12 | 15 | 16 | 14 | 11 |
|---|
| Humidity | 88% | 89% | 89% | 85% | 78% | 70% | 72% | 77% | 83% | 84% | 84% | 84% |
|---|
| Day length | 11 | 12 | 12 | 13 | 13 | 13 | 13 | 13 | 12 | 12 | 11 | 11 |
|---|
| Sun hours | 2 | 2 | 2 | 4 | 7 | 7 | 7 | 6 | 6 | 5 | 3 | 3 |
|---|
| Sea temp | 23 | 22 | 23 | 25 | 28 | 30 | 30 | 30 | 29 | 28 | 26 | 24 |
|---|
See also the
temperatures month by month