![]() Climate chart - Zhanjiang (Guangdong)
Climate chart - Zhanjiang (Guangdong)
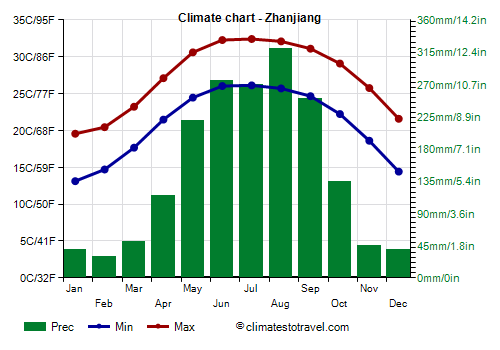
The climate of Zhanjiang is
subtropical, with very mild winters and hot, humid and rainy summers. The rains are abundant from May to September.
The city is located in southern China, at 21 degrees north latitude, in the southwest of Guangdong province, in a bay on the South China Sea. We are in the northern part of the Leizhou (or Luichow) peninsula, which in the southern part is 20 km (12 mi) away from the island of
Hainan.
Winter, from December to February, is very mild, however, the north-east monsoon brings cloudy days, during which there are some drizzles, or fog can form. Sometimes, cold and windy days can occur, with highs around 10 °C (50 °F) or even below. In January 2016, the temperature dropped to 3 °C (37 °F), with a maximum of 6 °C (43 °F).
Guangdong can be hit by
typhoons, the tropical cyclones of Southeast Asia. Typically, typhoons pass in this area from June to early November, but they have sometimes affected the area outside of this period, as happened in April 2008 and in May 2006. The area most at risk is the coastal one, since it can receive the strongest winds, as well as storm surges.

Best Time
It's not easy to find the
best time to visit Zhanjiang. Winter can be a good period, although the sky is often cloudy in the second part; moreover, it can be windy, and sometimes, though rarely, it can be a little cold. Spring is pleasantly warm, but it's also cloudy, and when the sun becomes a little more frequent, the rains begin as well, then, by May, it becomes muggy and there is some risk (though still low) of typhoons. In theory, autumn is the best season, but in October, a typhoon can still arrive, while in November, there can be the first cool and windy days, and sometimes, at the end of the month, it can already be a little cold. All in all, the best times are from mid-March to mid-April and from mid-October to late November.
What to pack
In winter: bring spring/autumn clothes, a sweatshirt or sweater, a jacket, a raincoat or umbrella, and a hat for colder days.
In summer: bring tropics-friendly, lightweight clothing, a light sweatshirt for air-conditioned places, and a light raincoat or umbrella.
Zhanjiang - Climate data
The
average temperature of the coldest month (January) is of 16.3 °C (61.4 °F), that of the warmest month (July) is of 29.3 °C (84.7 °F). Here are the average temperatures.
Zhanjiang - Average temperatures (1991-2020) | Month | Min (°C) | Max (°C) | Mean (°C) | Min (°F) | Max (°F) | Mean (°F) |
|---|
| January | 13.1 | 19.6 | 16.3 | 56 | 67 | 61.4 |
|---|
| February | 14.7 | 20.4 | 17.6 | 58 | 69 | 63.6 |
|---|
| March | 17.7 | 23.2 | 20.4 | 64 | 74 | 68.8 |
|---|
| April | 21.5 | 27.1 | 24.3 | 71 | 81 | 75.7 |
|---|
| May | 24.5 | 30.6 | 27.5 | 76 | 87 | 81.6 |
|---|
| June | 26 | 32.3 | 29.2 | 79 | 90 | 84.5 |
|---|
| July | 26.1 | 32.4 | 29.3 | 79 | 90 | 84.7 |
|---|
| August | 25.7 | 32.1 | 28.9 | 78 | 90 | 84 |
|---|
| September | 24.7 | 31.1 | 27.9 | 76 | 88 | 82.2 |
|---|
| October | 22.2 | 29.1 | 25.7 | 72 | 84 | 78.2 |
|---|
| November | 18.6 | 25.8 | 22.2 | 65 | 78 | 71.9 |
|---|
| December | 14.4 | 21.6 | 18 | 58 | 71 | 64.4 |
|---|
| Year | 20.8 | 27.1 | 23.9 | 69.4 | 80.8 | 75 |
|---|
amounts to 1795 millimeters (70.7 inches) per year: it is therefore abundant. It ranges from 30 mm (1.2 in) in the driest month (February) to 320 mm (12.6 in) in the wettest one (August). Here is the average precipitation.
Zhanjiang - Average precipitation| Month | Millimeters | Inches | Days |
|---|
| January | 40 | 1.6 | 9 |
|---|
| February | 30 | 1.2 | 11 |
|---|
| March | 50 | 2 | 13 |
|---|
| April | 115 | 4.5 | 13 |
|---|
| May | 220 | 8.7 | 13 |
|---|
| June | 275 | 10.8 | 13 |
|---|
| July | 270 | 10.6 | 13 |
|---|
| August | 320 | 12.6 | 15 |
|---|
| September | 250 | 9.8 | 13 |
|---|
| October | 135 | 5.3 | 8 |
|---|
| November | 45 | 1.8 | 6 |
|---|
| December | 40 | 1.6 | 7 |
|---|
| Year | 1795 | 70.7 | 135 |
|---|
The
sea temperature ranges from 19.5 °C (67 °F) in January, February to 29.5 °C (85 °F) in August. Here are the average sea temperatures.
Zhanjiang - Sea temperature| Month | Celsius (°C) | Fahrenheit (°F) |
|---|
January | 19.5 | 67 | February | 19.5 | 67 | March | 20.5 | 69 | April | 23 | 74 | May | 27 | 80 | June | 29 | 84 | July | 29 | 85 | August | 29.5 | 85 | September | 29 | 84 | October | 27.5 | 81 | November | 25 | 77 | December | 21.5 | 71 | Year | 25.1 | 77.1 |
There are on average around 2065
sunshine hours per year. Here are the average hours of sunshine per day.
Zhanjiang - Sunshine hours| Month | Average | Total |
|---|
January | 4 | 130 | February | 2.5 | 75 | March | 3 | 85 | April | 4 | 125 | May | 6.5 | 200 | June | 6.5 | 200 | July | 8 | 250 | August | 7 | 220 | September | 7 | 215 | October | 7 | 215 | November | 6 | 185 | December | 5.5 | 165 | Year | 5.7 | 2065 |
Zhanjiang - Weather by month
Based on the period 1991-2020
January, the coldest month of the year, is generally a very mild month. The average temperature is of 16.3 °C (61 °F), with a minimum of 13.1 °C (55.6 °F) and a maximum of 19.6 °C (67.2 °F).

On the coldest nights of the month, the temperature usually drops to around 7 °C (45 °F). However, it dropped to 2.7 °C (36.9 °F) in January 2016.

On the warmest days of the month, the temperature usually reaches around 25.5 °C (77.5 °F). However, it reached 32 °C (89.6 °F) in January 1998.

Precipitation amounts to 40 mm (1.6 in), distributed over 9 days.
The day lasts on average 11 hours and 0 minutes.

There are on average 4 hours of sunshine per day. So, the sun shines 38% of the time.
The average humidity is 79%. Hence, the air is normally humid.
The average wind speed is 12 kph (7 mph).

The average sea temperature is of 19.5 °C (67.5 °F). Therefore, the sea is very cool for swimming.
February is generally a very mild month. The average temperature is of 17.6 °C (64 °F), with a minimum of 14.7 °C (58.5 °F) and a maximum of 20.4 °C (68.8 °F).
On the coldest nights of the month, the temperature usually drops to around 8.5 °C (47.5 °F). However, it dropped to 3.8 °C (38.8 °F) in February 1996.
On the warmest days of the month, the temperature usually reaches around 27 °C (81 °F). However, it reached 33.6 °C (92.5 °F) in February 2010.
Precipitation amounts to 30 mm (1.2 in), distributed over 11 days.
The day lasts on average 11 hours and 30 minutes.
There are on average 2.5 hours of sunshine per day. So, the sun shines 23% of the time.
The average humidity is 84%. Hence, the air is normally humid.
The average wind speed is 12 kph (7 mph).
The average sea temperature is of 19.5 °C (67.5 °F). Therefore, the sea is very cool for swimming.
March is generally a warm month. The average temperature is of 20.4 °C (69 °F), with a minimum of 17.7 °C (63.8 °F) and a maximum of 23.2 °C (73.8 °F).
On the coldest nights, which normally occur at the beginning of the month, the temperature usually drops to around 11.5 °C (52.5 °F). However, it dropped to 7.5 °C (45.5 °F) in March 2005.
On the warmest days, which normally occur at the end of the month, the temperature usually reaches around 30 °C (86.5 °F). However, it reached 36 °C (96.8 °F) in March 2003.
Precipitation amounts to 50 mm (2 in), distributed over 13 days.
The day lasts on average 12 hours and 5 minutes.
There are on average 3 hours of sunshine per day. So, the sun shines 23% of the time.
The average humidity is 87%. Hence, the air is normally humid.
The average wind speed is 12 kph (8 mph).
The average sea temperature is of 20.5 °C (69.5 °F). Therefore, the sea is cool for swimming.
April is generally a warm to hot, muggy month. The average temperature is of 24.3 °C (76 °F), with a minimum of 21.5 °C (70.7 °F) and a maximum of 27.1 °C (80.8 °F).
On the coldest nights, which normally occur at the beginning of the month, the temperature usually drops to around 16 °C (60.5 °F). However, it dropped to 11.5 °C (52.7 °F) in April 1996.
On the warmest days, which normally occur at the end of the month, the temperature usually reaches around 33 °C (92 °F). However, it reached 36.4 °C (97.5 °F) in April 2012.
Precipitation amounts to 115 mm (4.5 in), distributed over 13 days.
The day lasts on average 12 hours and 40 minutes.
There are on average 4 hours of sunshine per day. So, the sun shines 32% of the time.
The average humidity is 86%. Hence, the air is normally humid.
The average wind speed is 12 kph (7 mph).
The average sea temperature is of 23 °C (74 °F). Therefore, the sea can be considered barely acceptable for swimming.
May is generally a warm to hot, muggy month. The average temperature is of 27.5 °C (82 °F), with a minimum of 24.5 °C (76 °F) and a maximum of 30.6 °C (87.1 °F).
On the coldest nights, which normally occur at the beginning of the month, the temperature usually drops to around 20.5 °C (68.5 °F). However, it dropped to 16.9 °C (62.4 °F) in May 1997.
On the warmest days, which normally occur at the end of the month, the temperature usually reaches around 35 °C (95 °F). However, it reached 38.4 °C (101.1 °F) in May 2015.
Precipitation amounts to 220 mm (8.7 in), distributed over 13 days.
The day lasts on average 13 hours and 10 minutes.
There are on average 6.5 hours of sunshine per day. So, the sun shines 49% of the time.
The average humidity is 83%. Hence, the air is normally humid.
The average wind speed is 11 kph (7 mph).
The average sea temperature is of 27 °C (80 °F). Therefore, the sea is pleasantly warm and allows long swims.
June is generally a very hot, muggy month. The average temperature is of 29.2 °C (84 °F), with a minimum of 26 °C (78.9 °F) and a maximum of 32.3 °C (90.1 °F).
On the coldest nights, the temperature usually drops to around 23 °C (73.5 °F). However, it dropped to 21.2 °C (70.2 °F) in June 2000.
On the warmest days, the temperature usually reaches around 35.5 °C (96 °F). However, it reached 36.7 °C (98.1 °F) in June 2015.
Precipitation amounts to 275 mm (10.8 in), distributed over 13 days.
The day lasts on average 13 hours and 25 minutes. June 21, the summer solstice, is the longest day of the year in the Northern Hemisphere.
There are on average 6.5 hours of sunshine per day. So, the sun shines 49% of the time.
The average humidity is 82%. Hence, the air is normally humid.
The average wind speed is 10 kph (6 mph).
The average sea temperature is of 29 °C (84 °F). Therefore, the sea is pleasantly warm and allows long swims.
July, the hottest month of the year, is generally a very hot, muggy month. The average temperature is of 29.3 °C (85 °F), with a minimum of 26.1 °C (79 °F) and a maximum of 32.4 °C (90.3 °F).
On the coldest nights of the month, the temperature usually drops to around 23.5 °C (74.5 °F). However, it dropped to 22.2 °C (72 °F) in July 2004.
On the warmest days of the month, the temperature usually reaches around 35.5 °C (96.5 °F). However, it reached 37.5 °C (99.5 °F) in July 2015.
Precipitation amounts to 270 mm (10.6 in), distributed over 13 days.
The day lasts on average 13 hours and 20 minutes.
There are on average 8 hours of sunshine per day. So, the sun shines 61% of the time.
The average humidity is 81%. Hence, the air is normally humid.
The average wind speed is 11 kph (7 mph).
The average sea temperature is of 29 °C (84.5 °F). Therefore, the sea is pleasantly warm and allows long swims.
August is generally a very hot, muggy month. The average temperature is of 28.9 °C (84 °F), with a minimum of 25.7 °C (78.3 °F) and a maximum of 32.1 °C (89.8 °F).
On the coldest nights of the month, the temperature usually drops to around 23.5 °C (74 °F). However, it dropped to 21.5 °C (70.7 °F) in August 2002.
On the warmest days of the month, the temperature usually reaches around 35 °C (95 °F). However, it reached 36.3 °C (97.3 °F) in August 2015.
Precipitation amounts to 320 mm (12.6 in), distributed over 15 days.
The day lasts on average 12 hours and 50 minutes.
There are on average 7 hours of sunshine per day. So, the sun shines 55% of the time.
The average humidity is 83%. Hence, the air is normally humid.
The average wind speed is 10 kph (6 mph).
The average sea temperature is of 29.5 °C (85 °F). Therefore, the sea is pleasantly warm and allows long swims.
September is generally a very hot, muggy month. The average temperature is of 27.9 °C (82 °F), with a minimum of 24.7 °C (76.4 °F) and a maximum of 31.1 °C (88 °F).
On the coldest nights, the temperature usually drops to around 22 °C (71.5 °F). However, it dropped to 17.2 °C (63 °F) in September 1997.
On the warmest days, the temperature usually reaches around 34 °C (93.5 °F). However, it reached 35.5 °C (95.9 °F) in September 1992.
Precipitation amounts to 250 mm (9.8 in), distributed over 13 days.
The day lasts on average 12 hours and 10 minutes.
There are on average 7 hours of sunshine per day. So, the sun shines 59% of the time.
The average humidity is 81%. Hence, the air is normally humid.
The average wind speed is 10 kph (6 mph).
The average sea temperature is of 29 °C (84 °F). Therefore, the sea is pleasantly warm and allows long swims.
October is generally a warm to hot, muggy month. The average temperature is of 25.7 °C (78 °F), with a minimum of 22.2 °C (72 °F) and a maximum of 29.1 °C (84.3 °F).
On the coldest nights, which normally occur at the end of the month, the temperature usually drops to around 18 °C (64 °F). However, it dropped to 11 °C (51.8 °F) in October 1992.
On the warmest days, which normally occur at the beginning of the month, the temperature usually reaches around 32 °C (90 °F). However, it reached 33.8 °C (92.8 °F) in October 2014.
Precipitation amounts to 135 mm (5.3 in), distributed over 8 days.
The day lasts on average 11 hours and 35 minutes.
There are on average 7 hours of sunshine per day. So, the sun shines 60% of the time.
The average humidity is 75%. Hence, the air is normally humid.
The average wind speed is 11 kph (7 mph).
The average sea temperature is of 27.5 °C (81.5 °F). Therefore, the sea is pleasantly warm and allows long swims.
November is generally a warm month. The average temperature is of 22.2 °C (72 °F), with a minimum of 18.6 °C (65.5 °F) and a maximum of 25.8 °C (78.4 °F).
On the coldest nights, which normally occur at the end of the month, the temperature usually drops to around 13.5 °C (56 °F). However, it dropped to 7.6 °C (45.7 °F) in November 2009.
On the warmest days, which normally occur at the beginning of the month, the temperature usually reaches around 30.5 °C (86.5 °F). However, it reached 32.7 °C (90.9 °F) in November 2003.
Precipitation amounts to 45 mm (1.8 in), distributed over 6 days.
The day lasts on average 11 hours and 5 minutes.
There are on average 6 hours of sunshine per day. So, the sun shines 56% of the time.
The average humidity is 73%. Hence, the air is normally humid.
The average wind speed is 12 kph (7 mph).
The average sea temperature is of 25 °C (77 °F). Therefore, the sea is warm enough for swimming.
December is generally a very mild month. The average temperature is of 18.0 °C (64 °F), with a minimum of 14.4 °C (58 °F) and a maximum of 21.6 °C (70.9 °F).
On the coldest nights of the month, the temperature usually drops to around 8 °C (46.5 °F). However, it dropped to 3.6 °C (38.5 °F) in December 1991.
On the warmest days of the month, the temperature usually reaches around 26.5 °C (80 °F). However, it reached 29.2 °C (84.6 °F) in December 1994.
Precipitation amounts to 40 mm (1.6 in), distributed over 7 days.
The day lasts on average 10 hours and 55 minutes. December 21, the winter solstice, is the shortest day of the year in the Northern Hemisphere.
There are on average 5.5 hours of sunshine per day. So, the sun shines 49% of the time.
The average humidity is 72%. Hence, the air is normally humid.
The average wind speed is 12 kph (7 mph).
The average sea temperature is of 21.5 °C (71 °F). Therefore, the sea is cool for swimming.