Select units of measurement for the temperature and rainfall tables (metric or imperial).
Average weather, temperature, rainfall, sunshine
In Taiwan, formerly Formosa, an island in East Asia crossed by the Tropic of Cancer, there is a
humid subtropical climate, with a very mild winter from December to February and a sultry, rainy summer from June to September. The summer rains are due to the
monsoon, while in the other seasons, rainfall depends on latitude and slope exposure. However, winter is the least rainy season everywhere.
In the interior of the island there are
mountains, where the climate cools down as the altitude increases. The mountains are also very rainy, moreover, it can snow in winter.
The climate in detail
The seasons
In
winter, the temperature is pleasant in the south, where highs in January are about 23 °C (73 °F), and the sun often shines, while in the north (see Taipei), the climate is cooler and cloudier, with average maximum temperatures about 19 °C (66 °F). Owing to maritime influence and low latitude, night-time temperatures are rarely cold and never drop below freezing (0 °C or 32 °F). However, sometimes, there can be very cool days in the north, with highs about 10/12 °C (50/54 °F).
In
spring, in April and early May, the temperature rises, and thunderstorms begin to occur in the afternoon, starting from the north and the interior.
The
monsoon arrives on the island around May 10 - May 20, coming from the south. It brings heavy rainfall throughout the island, but especially along the southwest coast, from Tainan to Hengchun, in addition to the highlands of the interior.
Summer is hot, humid and rainy, with more frequent rains (unlike in winter) along the southern coast.
The temperatures are quite uniform from north to south: in July and August, the daily average at sea level is around is 28.5 °C (83 °F) along the coasts and 30.5 °C (87 °F) in Taipei.
The north-west coast, from Taichung to Taoyuan, experiences a relative decrease in rainfall in July.
Since the tropical rains are usually intense but short-lived, the amount of sunshine in summer is acceptable, however, in this season, sticky and unpleasant heat dominates.
During summer, the island is often affected by
typhoons, the tropical cyclones of South-East Asia, able to bring strong winds and torrential rainfall; they typically cause heavier damage along the east coast.
After the monsoon, in
autumn, from October to December, the rains decrease and the muggy heat is replaced by more pleasant weather conditions. The only area which remains fairly rainy is the east coast, where more than 100 millimeters (4 inches) of rain fall per month still in autumn (see Hualien).
The north
Taipei
The capital,
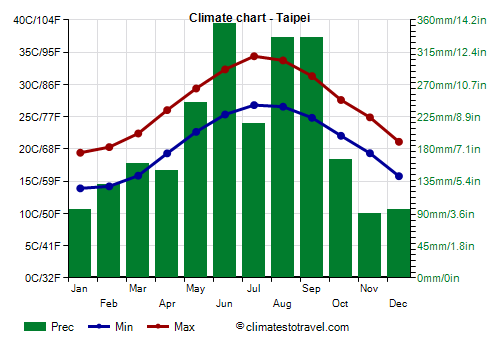
Taipei, is located in the northern part of the island, which is the rainiest along with the north-east, and is the coolest in winter. The average temperature ranges from 16.5 °C (61.5 °F) in January to 30.5 °C (87 °F) in July.
From December to March, on the coldest nights the temperature generally drops to 8/10 °C (46/50 °F). Sometimes there can be colder periods. In January 2016, there was a day with a minimum of 4 °C (39 °F) and a maximum of 6 °C (43 °F).
In summer, the "urban heat island effect", generated in the big city, makes the heat even more unpleasant, but the buildings are fortunately equipped with air-conditioning.
On the hottest days of the year, which generally occur from June to September, the temperature reaches 37/38 °C (99/100 °F). The highest record is 39 °C (102.2 °F) and was set in July 2020 and 2021.
Taipei is a
very rainy city. On average, 2,370 mm (93 in) of rain fall per year, with a peak in the hot period, from May to September.
However, there is no dry season in Taipei, and the sky in winter is often cloudy. In fact, the
winter monsoon, which is originally dry as it comes from the Asian mainland, picks up moisture over the sea and brings clouds, mists and some rain in the northern part of the island.
Even in spring, the sun is rarely seen. Overall, Taipei is a
dull city: in a year, there are only 1,375 hours of sunshine.
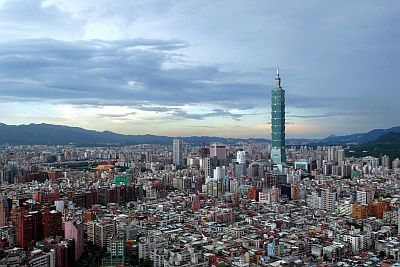
Along the northern coast, the
sea is warm enough for swimming from May to October, while in winter, it becomes very cool. In
Keelung, about 20 kilometers (12 miles) northeast of Taipei, the water temperature drops to 18/19 °C (64/66 °F) from January to March, while it reaches 27/28 °C (81/82 °F) from June to September.
The south
Tainan
In the south, as mentioned, winter is warmer, especially during the day. In
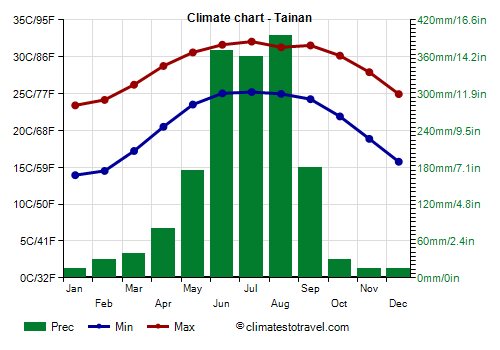
Tainan, located on the southwestern coast, the average highs in January are around 23 °C (74).
Here too, sometimes in winter it can get a bit cold, and during the coldest winters, the temperature can drop to 5 °C (41 °F).
In summer, however, the temperatures are a bit lower, because the wind from the south-west prevails, which comes directly from the sea. Typically, the hottest days of the year occur in May and June, and the temperature reaches 34 °C (93 °F).
In Tainan, 1,700 mm (67 in) of rain fall per year, and the dry season is long, from October to March, while showers begin to increase in April.
In Tainan, and in general in the south, the winter, in addition to being drier, is also sunnier than in Taipei. In Tainan, there are 2,200 hours of sunshine per year.
Along the south coast, the
sea is warm enough for swimming all year round. In winter, however, the air temperature is not always ideal for swimming and sunbathing, even in the south.
The mountains
The
interior of the island is very green and is occupied by mountains. In the
Yangmingshan National Park, north of Taipei, it can snow above 1,000 meters (3,300 feet) during cold spells. The highest peak is Mount Qixing, 1,120 meters (3,670 feet) high.
Above 2,000 meters (6,500 feet), winter is quite cold, and there's some chance of snow and frosts, while summer is cool but very rainy.
Yushan
The highest peak in Taiwan is
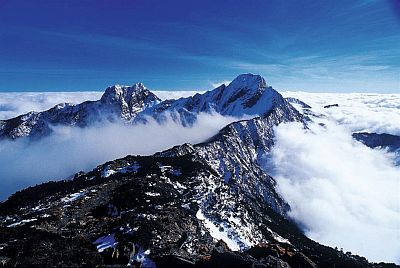
Yushan (formerly Mount Morrison), located in the central part of the island and 3,952 meters (12,966 feet) high. Its name, "Jade Mountain", derives from the contrast created in winter between the snow-capped peak and the sky in the background.
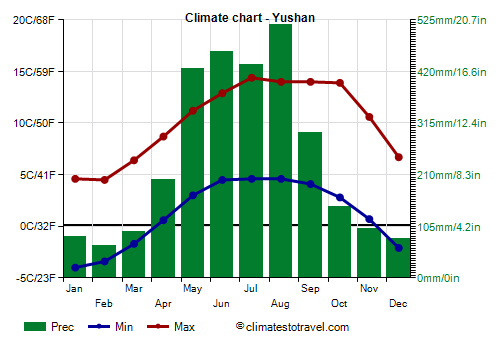
On the top of Yushan, the average temperature in the winter months is around freezing (but sometimes the temperature can drop as low as -10 °C or 14 °F), while in summer, it is around 9 °C (48 °F).
On average, precipitation amounts to as many as 2,900 mm (114 in) per year, with a remarkable maximum in summer, while snow is frequent in winter.
Penghu Islands
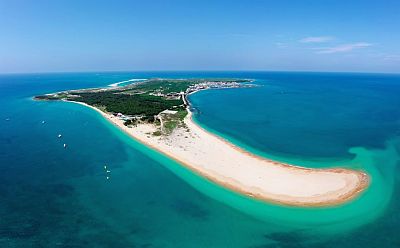
To the west of Taiwan, in the strait that separates it from China, we find the Penghu Islands, called
Pescadores in the Portuguese era.
On these islands, winter is quite cool and windy, and although the rains are not abundant, the sky is often cloudy and a light rain can fall. In contrast, summer is hot, muggy, and rainy, even though the sun shines for a good number of hours.
Magong
In the largest city of the islands,
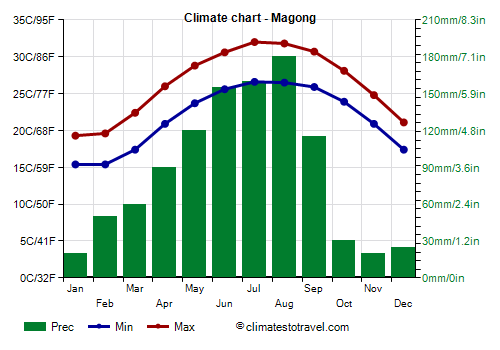
Magong (or Makung), the average temperature ranges from 17.5 °C (63.5 °F) in January and February, to 29.5 °C (85 °F) in July and August.
These islands are not as rainy as the main island of Taiwan, since they receive about 1,000 mm (40 in) of rain per year.
Although it's the wettest period, the sun shines more often in summer; in fact, in this period, apart from thunderstorms, the weather tends to be good.
In these islands, the sea temperature in winter is halfway between the north and south of Taiwan: it is a little cool from December to March, and drops to 20.5 °C (69 °F) in January and February, while it becomes pleasantly warm for swimming in summer, reaching 28/28.5 °C (82/83 °F) from July to September.
Typhoons
As mentioned earlier, Taiwan can be hit by typhoons, the tropical cyclones of Southeast Asia. Actually, Taiwan is one of the most affected countries, also because the mountains that cross the island create the conditions for torrential rains: it is not by chance that in some places, during the most intense typhoons, a total of more than 1,000 mm (40 in) of rain has fallen in a few days.
Typically, typhoons occur in this area
from June through October, although they are more frequent from mid-July to early October.
Recently, however, perhaps because of global warming, they have sometimes affected the country outside of this period, though without reaching high intensities, as happened with Typhoon Kujira in late April 2003, with Typhoon Chanchu in May 2006, and with Typhoon Nanmadol in early December 2004.
When to go
The best time to visit Taiwan runs from
November to March, since it is the mildest and outside of both the monsoon rains and the typhoon season. The east coast, however, is very rainy still in November.
For a beach holiday at the
Penghus, the best time is the summer, although it should be remembered that it is the period when typhoons can affect the area.
What to pack
In
winter: pack spring/autumn clothes, a sweatshirt or sweater, a light jacket, and a raincoat or umbrella. For the high mountains, a down jacket, a rain jacket, a hat, gloves, and a scarf.
In
summer: pack tropics-friendly, loose-fitting clothing, a light sweatshirt and a light scarf for air-conditioned places, and a light raincoat or umbrella.
When going to the reef, you can bring snorkeling equipment, including water shoes or rubber-soled shoes.
For the high mountains, a warm jacket, a rain jacket, and hiking boots.
Climate data - Taiwan
| Chiayi |
|---|
|
| Jan | Feb | Mar | Apr | May | Jun | Jul | Aug | Sep | Oct | Nov | Dec |
|---|
| Min temp. | 13 | 14 | 16 | 20 | 23 | 25 | 25 | 25 | 24 | 21 | 18 | 14 |
|---|
| Max temp. | 22 | 23 | 25 | 28 | 31 | 33 | 33 | 33 | 32 | 30 | 28 | 24 |
|---|
| Precip. | 30 | 45 | 55 | 85 | 170 | 320 | 385 | 445 | 210 | 30 | 20 | 25 |
|---|
| Prec. days | 5 | 6 | 7 | 8 | 10 | 14 | 15 | 18 | 9 | 3 | 3 | 4 |
|---|
|
|
| Sun hours | 5 | 5 | 5 | 5 | 6 | 6 | 7 | 6 | 6 | 6 | 5 | 5 |
|---|
|
| Hengchun |
|---|
|
| Jan | Feb | Mar | Apr | May | Jun | Jul | Aug | Sep | Oct | Nov | Dec |
|---|
| Min temp. | 19 | 19 | 20 | 23 | 24 | 26 | 26 | 26 | 25 | 24 | 22 | 20 |
|---|
| Max temp. | 24 | 26 | 27 | 30 | 31 | 32 | 32 | 32 | 31 | 30 | 28 | 25 |
|---|
| Precip. | 20 | 25 | 15 | 35 | 145 | 350 | 390 | 535 | 320 | 125 | 60 | 30 |
|---|
| Prec. days | 5 | 5 | 3 | 4 | 9 | 15 | 16 | 18 | 14 | 9 | 5 | 4 |
|---|
|
|
| Sun hours | 5 | 6 | 6 | 6 | 6 | 6 | 7 | 6 | 6 | 6 | 6 | 5 |
|---|
|
| Hsinchu |
|---|
|
| Jan | Feb | Mar | Apr | May | Jun | Jul | Aug | Sep | Oct | Nov | Dec |
|---|
| Min temp. | 13 | 13 | 15 | 19 | 22 | 25 | 26 | 26 | 24 | 22 | 19 | 15 |
|---|
| Max temp. | 19 | 19 | 22 | 26 | 29 | 32 | 33 | 33 | 31 | 28 | 25 | 21 |
|---|
| Precip. | 75 | 125 | 160 | 160 | 250 | 250 | 120 | 195 | 175 | 55 | 50 | 60 |
|---|
| Prec. days | 10 | 11 | 14 | 13 | 12 | 11 | 8 | 11 | 9 | 6 | 7 | 8 |
|---|
|
|
| Sun hours | 3 | 3 | 3 | 4 | 5 | 6 | 8 | 7 | 6 | 6 | 5 | 4 |
|---|
|
| Hualien |
|---|
|
| Jan | Feb | Mar | Apr | May | Jun | Jul | Aug | Sep | Oct | Nov | Dec |
|---|
| Min temp. | 16 | 16 | 18 | 20 | 22 | 25 | 26 | 25 | 24 | 22 | 20 | 17 |
|---|
| Max temp. | 21 | 22 | 24 | 26 | 29 | 31 | 32 | 32 | 31 | 28 | 26 | 23 |
|---|
| Precip. | 55 | 75 | 75 | 75 | 185 | 165 | 200 | 260 | 330 | 350 | 175 | 85 |
|---|
| Prec. days | 13 | 14 | 14 | 14 | 16 | 12 | 8 | 10 | 13 | 12 | 12 | 11 |
|---|
|
|
| Sun hours | 2 | 2 | 3 | 3 | 4 | 6 | 8 | 7 | 5 | 4 | 3 | 2 |
|---|
|
| Kaohsiung |
|---|
|
| Jan | Feb | Mar | Apr | May | Jun | Jul | Aug | Sep | Oct | Nov | Dec |
|---|
| Min temp. | 16 | 17 | 20 | 23 | 25 | 26 | 27 | 26 | 26 | 24 | 22 | 18 |
|---|
| Max temp. | 24 | 25 | 27 | 29 | 31 | 32 | 33 | 32 | 32 | 30 | 28 | 25 |
|---|
| Precip. | 20 | 20 | 30 | 70 | 200 | 415 | 375 | 510 | 225 | 55 | 25 | 20 |
|---|
| Prec. days | 3 | 3 | 4 | 5 | 6 | 13 | 13 | 17 | 10 | 4 | 3 | 3 |
|---|
|
|
| Sun hours | 6 | 6 | 6 | 7 | 7 | 7 | 7 | 6 | 6 | 6 | 6 | 5 |
|---|
|
| Keelung |
|---|
|
| Jan | Feb | Mar | Apr | May | Jun | Jul | Aug | Sep | Oct | Nov | Dec |
|---|
| Min temp. | 14 | 14 | 16 | 19 | 22 | 25 | 27 | 26 | 25 | 22 | 20 | 16 |
|---|
| Max temp. | 18 | 19 | 21 | 25 | 28 | 31 | 33 | 32 | 30 | 26 | 24 | 20 |
|---|
| Precip. | 330 | 350 | 275 | 210 | 285 | 290 | 120 | 210 | 390 | 380 | 395 | 355 |
|---|
| Prec. days | 20 | 18 | 19 | 16 | 16 | 15 | 8 | 12 | 15 | 17 | 19 | 20 |
|---|
|
|
| Sun hours | 2 | 2 | 3 | 3 | 4 | 5 | 7 | 7 | 5 | 3 | 2 | 2 |
|---|
| Sea temp | 18 | 18 | 19 | 22 | 25 | 27 | 28 | 28 | 27 | 25 | 22 | 20 |
|---|
| Kinmen |
|---|
|
| Jan | Feb | Mar | Apr | May | Jun | Jul | Aug | Sep | Oct | Nov | Dec |
|---|
| Min temp. | 10 | 10 | 12 | 16 | 21 | 24 | 26 | 26 | 24 | 21 | 17 | 13 |
|---|
| Max temp. | 17 | 17 | 20 | 23 | 26 | 30 | 32 | 32 | 31 | 28 | 24 | 20 |
|---|
| Precip. | 35 | 65 | 90 | 120 | 140 | 155 | 130 | 155 | 115 | 40 | 25 | 25 |
|---|
|
|
|
| Sun hours | 4 | 4 | 3 | 4 | 4 | 6 | 8 | 7 | 6 | 6 | 5 | 5 |
|---|
|
| Magong |
|---|
|
| Jan | Feb | Mar | Apr | May | Jun | Jul | Aug | Sep | Oct | Nov | Dec |
|---|
| Min temp. | 15 | 15 | 17 | 21 | 24 | 26 | 27 | 26 | 26 | 24 | 21 | 17 |
|---|
| Max temp. | 19 | 20 | 22 | 26 | 29 | 31 | 32 | 32 | 31 | 28 | 25 | 21 |
|---|
| Precip. | 20 | 50 | 60 | 90 | 120 | 155 | 160 | 180 | 115 | 30 | 20 | 25 |
|---|
| Prec. days | 5 | 7 | 9 | 9 | 10 | 10 | 8 | 9 | 7 | 2 | 4 | 4 |
|---|
|
|
| Sun hours | 4 | 3 | 4 | 5 | 6 | 7 | 9 | 8 | 7 | 6 | 5 | 4 |
|---|
| Sea temp | 20 | 20 | 22 | 24 | 26 | 28 | 28 | 28 | 28 | 26 | 24 | 22 |
|---|
| Taichung |
|---|
|
| Jan | Feb | Mar | Apr | May | Jun | Jul | Aug | Sep | Oct | Nov | Dec |
|---|
| Min temp. | 13 | 14 | 16 | 20 | 23 | 25 | 26 | 25 | 25 | 22 | 19 | 15 |
|---|
| Max temp. | 22 | 23 | 25 | 28 | 31 | 32 | 33 | 33 | 32 | 30 | 28 | 24 |
|---|
| Precip. | 35 | 65 | 85 | 125 | 250 | 330 | 305 | 340 | 150 | 25 | 25 | 30 |
|---|
| Prec. days | 7 | 8 | 10 | 11 | 12 | 14 | 14 | 16 | 8 | 3 | 4 | 5 |
|---|
|
|
| Sun hours | 6 | 5 | 5 | 5 | 5 | 5 | 6 | 5 | 6 | 7 | 6 | 6 |
|---|
|
| Tainan |
|---|
|
| Jan | Feb | Mar | Apr | May | Jun | Jul | Aug | Sep | Oct | Nov | Dec |
|---|
| Min temp. | 14 | 15 | 17 | 20 | 24 | 25 | 25 | 25 | 24 | 22 | 19 | 16 |
|---|
| Max temp. | 23 | 24 | 26 | 29 | 31 | 32 | 32 | 31 | 32 | 30 | 28 | 25 |
|---|
| Precip. | 15 | 30 | 40 | 80 | 175 | 370 | 360 | 395 | 180 | 30 | 15 | 15 |
|---|
| Prec. days | 4 | 5 | 5 | 7 | 9 | 13 | 12 | 15 | 10 | 3 | 2 | 3 |
|---|
|
|
| Sun hours | 6 | 6 | 6 | 6 | 6 | 6 | 7 | 6 | 6 | 6 | 6 | 6 |
|---|
| Sea temp | 23 | 23 | 24 | 26 | 27 | 28 | 29 | 29 | 28 | 27 | 26 | 24 |
|---|
| Taipei |
|---|
|
| Jan | Feb | Mar | Apr | May | Jun | Jul | Aug | Sep | Oct | Nov | Dec |
|---|
| Min temp. | 14 | 14 | 16 | 19 | 23 | 25 | 27 | 27 | 25 | 22 | 19 | 16 |
|---|
| Max temp. | 19 | 20 | 22 | 26 | 29 | 32 | 34 | 34 | 31 | 28 | 25 | 21 |
|---|
| Precip. | 95 | 130 | 160 | 150 | 245 | 355 | 215 | 335 | 335 | 165 | 90 | 95 |
|---|
| Prec. days | 13 | 11 | 13 | 13 | 13 | 14 | 11 | 14 | 13 | 12 | 12 | 13 |
|---|
|
|
| Sun hours | 2 | 3 | 3 | 3 | 4 | 4 | 6 | 6 | 5 | 4 | 3 | 3 |
|---|
|
| Taitung |
|---|
|
| Jan | Feb | Mar | Apr | May | Jun | Jul | Aug | Sep | Oct | Nov | Dec |
|---|
| Min temp. | 17 | 18 | 19 | 21 | 24 | 26 | 26 | 26 | 25 | 23 | 21 | 18 |
|---|
| Max temp. | 23 | 24 | 25 | 28 | 30 | 32 | 33 | 32 | 31 | 29 | 27 | 24 |
|---|
| Precip. | 35 | 40 | 35 | 65 | 140 | 200 | 250 | 315 | 295 | 215 | 100 | 45 |
|---|
| Prec. days | 8 | 9 | 9 | 11 | 14 | 12 | 10 | 12 | 13 | 10 | 9 | 8 |
|---|
|
|
| Sun hours | 3 | 3 | 3 | 4 | 5 | 7 | 8 | 7 | 6 | 5 | 4 | 3 |
|---|
|
| Yushan (3,952 meters) |
|---|
|
| Jan | Feb | Mar | Apr | May | Jun | Jul | Aug | Sep | Oct | Nov | Dec |
|---|
| Min temp. | -4 | -3 | -2 | 1 | 3 | 4 | 5 | 5 | 4 | 3 | 1 | -2 |
|---|
| Max temp. | 5 | 4 | 6 | 9 | 11 | 13 | 14 | 14 | 14 | 14 | 11 | 7 |
|---|
| Precip. | 85 | 65 | 95 | 200 | 425 | 460 | 435 | 515 | 295 | 145 | 100 | 80 |
|---|
| Prec. days | 7 | 7 | 8 | 13 | 19 | 18 | 18 | 18 | 14 | 10 | 8 | 6 |
|---|
|
|
| Sun hours | 7 | 6 | 5 | 5 | 4 | 5 | 6 | 5 | 5 | 7 | 7 | 6 |
|---|
|
See also the
temperatures month by month