Select units of measurement for the temperature and rainfall tables (metric or imperial).
Average weather, temperature, rainfall, sunshine
In the endless territory of Asian Russia, the climate is characterized by
frigid winters: in fact, the coldest inhabited places in the world are found here.
The northernmost belt has an
arctic or subarctic climate, while the eastern coasts have a
cold maritime climate. For the rest, there is a strong
continentality, so there is a short but intense summer, in which it can even get
hot.
The average
temperature in January is almost everywhere below -10 °C (14 °F), and it goes down to -45 °C (-49 °F) in the Eastern inland areas. The daily average in July is around freezing (0 °C or 32 °F) on the northern islands and along the Arctic coast, while it goes up to 20 °C (68 °F) in the southernmost areas.
During winter, in most of the territory, the powerful
Siberian Anticyclone dominates. On the other hand, in the eastern seas, the clashes between continental and maritime air masses give rise to
intense low pressure areas, which can bring heavy snowfalls.
In the vast plains, in the West Siberian Plain but also in the valleys of the Central Siberian Plateau and of Yakutia,
cold air stagnates on the soil, and the sky is often gray, with frequent light snowfalls, while cold outbreaks from the Arctic may lead to raging gusts of
blizzard.
During the long winter months,
precipitation is scarce almost everywhere because of the cold: snowfalls are frequent but light, and the snow can be carried away by the wind. Owing to the greater availability of heat and energy, summer is almost everywhere the rainiest season, in fact, afternoon thunderstorms may occur in inland areas. On the other hand, the south-eastern areas receive even more rainfall in summer because they are affected by the
Asian monsoon.
In most of Siberia, yearly precipitation is between 150 and 500 millimeters (6 and 20 inches).
In the far east, the
Kamchatka peninsula is the wettest region of mainland Siberia: in some areas, precipitation exceeds 1,000 mm (40 in) per year, and a lot of snow can fall in winter.
Southwest of Kamchatka, the
Kuril Islands are even wetter, since precipitation reaches 1,500 mm (60 in) per year.
The climate in detail
The Pole of Cold
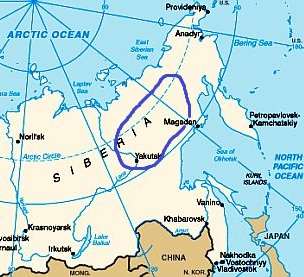
The Siberian winter gets colder from west to east, since the western part and especially the European part of Russia are more often affected by currents of Atlantic origin. In the Republic of
Yakutia (or Sakha), located in the eastern part, there is an area where the January average is below -35 °C (-31 °F), and the coldest records go down to -70 °C (-94 °F).
The coldest city is
Oymyakon, located in the upper Indigirka Valley, on the 63rd parallel and at 700 meters (2,300 feet) above sea level, where the average goes from -45.7 °C (-50.3 °F) in January to 15 °C (59 °F) in July, ans the coldest record is as low as -71 °C (-96 °F).
Another extremely cold city is
Verkhoyansk, located more to the north but at sea level, in the Yana River Valley, where the average ranges from -44,5 °C (-48 °F) in January to 16.5 °C (61.5 °F) in July, and the coldest record is -70 °C (-94 °F), or according to other sources, -68 °C (-90 °F). The highest recorded temperature in Verkhoyansk is 38 °C (100 °F), so the difference between the two records exceeds 100 degrees Celsius!
This area is the "Pole of Cold" of the Northern Hemisphere, in fact, it's colder than the North Pole, and it's surpassed only by the central area of Antarctica (according to some sources, also of Greenland). At these temperatures, a human being is likely to freeze in a few minutes, if not properly covered, while buildings tend to become brittle because of the cold.
Precipitation in this area is low, amounting to around 200/250 mm (8/10 in) per year. In particular, snowfall in the long winter months is light, given the cold; it is not surprising that the rainiest season is summer, when in any case the rains are not abundant.
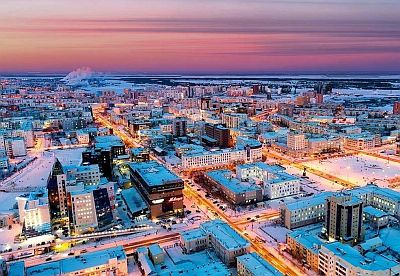
Still in this area but a little further south, we find
Yakutsk, the capital of Yakutia (Sakha), at 62 degrees north latitude on the Lena River, which is the coldest city of some importance in the world.
The average temperature ranges from -37 °C (-34.5 °F) in January to 19.5 °C (67 °F) in July. The weather station was already in operation at the end of the nineteenth century. The coldest record is -64.4 °C (-83.9 °F) and was set in February 1891. After the war, the coldest record is -60.3 °C (-76.5 °F), set in January 1951.
On the hottest days of the year, temperatures can exceed 35 °C (95 °F).
Over the past hundred years, the temperature has risen a lot, especially in winter. From 1891 to 1920, the daily average in January was -46.2 °C (-51.1 °F), while from 1951 to 1980, it was -42 °C (-43.6 °F).
North coast and islands
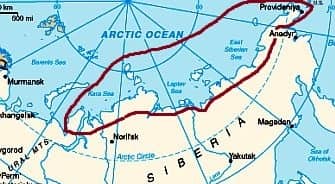
Along the
northern coast, overlooking the Arctic Ocean,
the average in January and February is around -20 °C (-4 °F) in the west, it goes below -30 °C (-22 °F) in the central and eastern part (see
Tiksi), and it rises again to around -25 °C (-13 °F) in the far east, and to -20 °C (-4 °F) in the Bering Strait, which separates Siberia from Alaska.
In the arctic regions, the
lowest records hover around -45/-50 °C (-49/-58 °F), which means that they are not much different from those of the southern part of Siberian mainland.
During summer, temperatures remain around freezing (0 °C or 32 °F) on the
northernmost islands (see
Severnaya Zemlya, Anzhu Islands), they are around 3/4 °C (37/39 °F) along the northern coast, and go up to 10 °C (50 °F) a few hundred kilometers to the south (this value is regarded as the limit of the polar climate).
The highest recorded temperatures are around 10 °C (50 °F) on the Arctic islands, and around 15/20 °C (59/68 °F) along the northern coast of the continent.
Precipitation is scarce in winter, when it occurs in the form of light snow, and it's more abundant in summer, when it can still occur in the form of snow on the northernmost coasts and islands.
The summer temperatures, between 0 and 10 °C (32 and 50 °F), make it an example of the
tundra climate.
At these latitudes, the sun from November to January does not even rise. The sunniest season is spring (in April, there are 9 sunshine hours out of 22 daylight hours per day), while in summer, the sun becomes less frequent, as cloudy and rainy days increase.
The sea is frozen solid from November to May; remember that being salted, sea water freezes at about -2 °C (28.5 °F).
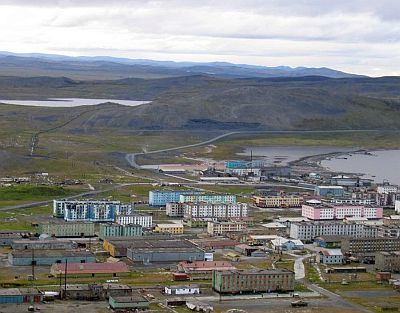
The southern cities
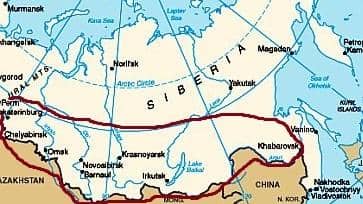
In the southern plains, where we find the major cities, which are located along the Trans-Siberian Railway, the climate is
strongly continental, but more forgiving than the northern areas, with highest winter averages as well as the warmer and longer summer.
The January averages range from -14 °C (7 °F) in the westernmost cities (see
Yekaterinburg,
Chelyabinsk), to -17 °C (1.5 °F) in the central ones (see
Omsk,
Novosibirsk,
Krasnoyarsk), to -20/-21 °C (-4/-6 °F) in the eastern ones (see
Blagoveshchensk,
Khabarovsk). In the area north of Mongolia (see
Chita,
Ulan-Ude), also due to the altitude, the January average drops to -23/-24 °C (-9/-11 °F).
The
coldest records are lower than -40 °C (-40 °F).
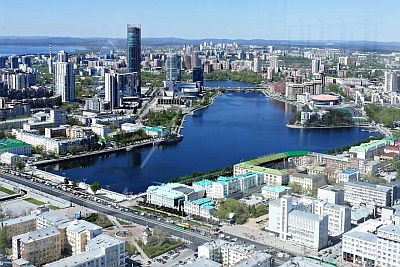
The July averages range from 18 °C (64.5 °F) in the westernmost part to 22 °C (71.5 °F) in the eastern one.
In summer there can be
very hot periods, with highs of 35 °C (95 °F) and more.
In the central-western part,
precipitation, not abundant, is between 400 and 550 mm (15 to 20 in) per year, with a maximum in summer and a minimum in winter. Snowfall, frequent but not abundant in the cold period, generally occurs from October to April.
In the southernmost areas, near the border with Kazakhstan and Mongolia, there are quite arid areas, where precipitation can drop below 400 mm (15.5 in) per year.
In the eastern part (see Blagoveshchensk, Khabarovsk), winter is drier, and the sun is seen quite often, on the other hand, summer is even rainier, due to the already mentioned
Asian monsoon, so much so that the annual total ranges from 550 to 650 mm (21.5 to 25.5 in), and in July and August, more than 100 mm (4 in) of rain fall per month.
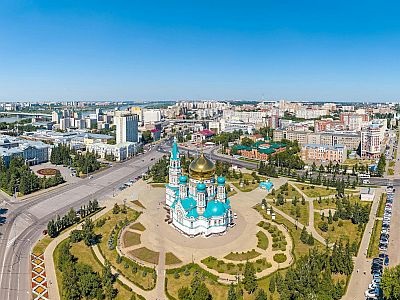
Further to the east, in
Novosibirsk and
Krasnoyarsk, the climate is similar to that of Omsk, but we enter the area affected by the aforementioned
Asian monsoon, which receives a little more rain in summer, in fact, precipitation slightly increases, and exceeds again 400 mm (16 in) per year.
Eastern coasts and islands
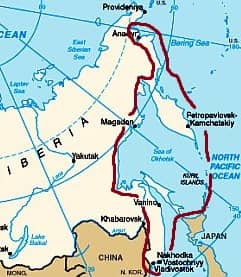
In the long
eastern coastline, the presence of the sea makes the climate more temperate, in fact, winter is less frigid, while summer is cold (or at least cool) and wet. In winter, cold currents carry
drifting ice towards the island of Hokkaido in Japan.
During summer,
fog is frequent. Because the sea warms up more slowly than in the mainland, if we exclude the northernmost area, August is, albeit slightly, the warmest month.
South of the Bering Strait, the coast bordering the Bering Sea has a subarctic climate, with long, cold winters and very cool summers; the average in July and August is around 10 °C (50 °F).
In the northeast, in
Anadyr, in the gulf of the same name, at a latitude of 64 degrees north, the average temperature ranges from -22 °C (-7.5 °F) in January to 12.5 °C (54.5 °F) in July. From 1991 to 2020, the extremes were -44 °C (-47 °F) and 29 °C (-20 °F). From 1991 to 2020, the extremes were -37 °C (-34.5 °F) and 27 °C (80.5 °F).
Precipitation amounts to 385 mm (15 in) per year. The city is located in a sheltered bay, but along the coast of the Bering Sea, annual precipitation generally exceeds 500 mm (20 in).
In this northern part of the Bering Sea, the sea remains frozen solid from January to March, while it is partially frozen (although it depends on the year) in December, April and May.
Further south, in
Magadan, in the Sea of Okhotsk, at a latitude of 59 degrees north, the average temperature is between -15.5 °C (4 °F) in January and 12.5 °C (53.5 °F) in July and August. Winter is cold and dry, since the wind in this season blows from the continent, while later it picks up moisture from the sea and bring snowfall over Kamchatka.
Annual precipitation amounts to 585 mm (23 in), with a maximum of 85 mm (3.3 in) in August. Snowfalls occur from October to May, but they are not abundant because, as we mentioned, the winter is dry.
In Magadan, the sunniest months (albeit slightly) are March and April, while later, from May to September, there is a certain number of days with rainfall or even fog.
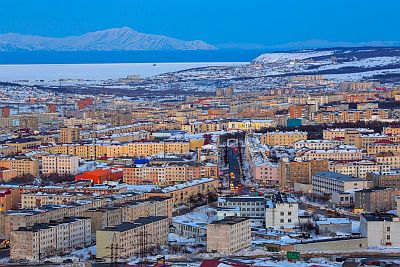
In
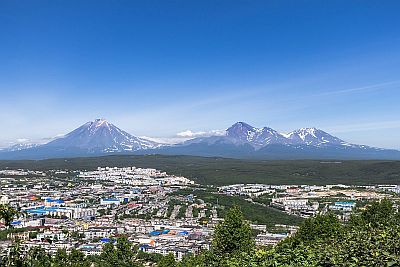
Petropavlovsk-Kamchatksy, at a latitude of 53 degrees north, on the southeastern coast of the wet peninsula of
Kamchatka, subject to low pressure areas in autumn and winter, the average temperature ranges from -6.5 °C (20 °F) in January to 14.5 °C (58 °F) in August. From 1991 to 2020, the extremes were -25.5 °C (14 °F) and 30 °C (86 °F).
Precipitation amounts to 1,150 mm (45 in) and is frequent throughout the year, which means that there are
heavy snowfalls in winter.
Southwest of Kamchatka, the
Kuril Islands are the mildest area of Siberia in winter, with January and February averages around -4/-5 °C (23/25 °F), however, the winters are snowy and stormy, due to the strong clash between frigid air masses coming from continental Siberia and mild air masses coming from the subtropical latitudes of the Pacific. Summers in the Kurils are very cool because the sea is still cold after the long winter months, and are quite rainy as well.
More to the west, on the island of
Sakhalin, summer is a bit warmer, while winter is very cold, with heavy snowfalls. In summer, owing to the effect of the Asian monsoon, which brings warm, moist air from the seas around Japan, rainfall exceeds 100 mm (4 in) per month; occasionally, the island may be affected by typhoons, tropical cyclones coming from Southeast Asia.
In
Yuzhno-Sakhalinsk, located in the southern part of the island, the average temperature ranges from -11 °C (12 °F) in January to 18 °C (64.5 °F) in August.
Returning to the mainland, in
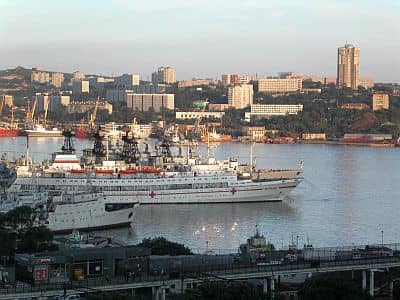
Vladivostok, on a small peninsula in the Sea of Japan, in the southernmost part of Siberia (at 43 degrees north latitude), the average temperature ranges from -11.5 °C (11.5 °F) in January to 20.5 °C (69 °F) in August.
In Vladivostok, the summer rains are abundant, so much so that in August, 155 mm (6 in) of rain fall. The winter is dry and sunny, but also swept by dusty winds from Mongolia. However, precipitation amounts to 800 mm (31.5 in) because of the summer rains.
The sun in Vladivostok is often seen in winter, while in summer, cloudy days are frequent because of the monsoon.
Unlike in the rest of Siberia, the sea near Vladivostok warms up in summer, and it becomes almost acceptable for swimming, especially in August.
This coastal area too, can occasionally be affected by typhoons in August and September, although when they arrive here, they are weaker than they were in the tropical seas.
When to go
The best time to visit the Asian part of Russia is
summer, in fact, it is the warmest and the only one that is not cold, and in particular, the months of July and August.
In the
arctic and subarctic regions, summer is the only period when the temperature exceeds freezing, in particular you can go in July and August, with a preference for July, which is usually warmer (or less cold).
It should be remembered that in the northernmost regions, which have an Arctic climate, mud dominates in summer because ice and snow do not melt completely. In the other areas, the thaw begins in April in the extreme south, and occurs progressively later and until June as you move to the north.
In the vast
northern plains and in the area of the "Pole of Cold", temperatures are acceptable from June to August, with a preference for the period mid-June to mid-August. Sometimes, it can get hot during the day, but at other times, it can get cold at night, even as low as around the freezing point.
In the
southern cities, the best period runs from June to August, though the temperature is usually above freezing in May and September as well.
In the
eastern coastal regions, the best months are July and August because they are the least cold, although they are quite foggy and rainy. In the southernemost part, in Vladivostok, the best period is from July to September, although it is the rainiest because of the summer monsoon.
What to pack
In
winter: it is necessary to bring clothes for the big cold, synthetic, thermal long underwear, a fleece, a parka, a fur hat, a wind jacket in Goretex, warm boots.
In
summer: on Arctic coasts and islands, bring warm clothing, a down jacket, a hat, gloves, a raincoat. In the continental areas and in the southern cities, bring spring/autumn clothes, short-sleeved shirts for hot days, a jacket and a sweater for the evening, which should be warmer in the northern areas; a raincoat or umbrella especially in the eastern area affected by the monsoon (see Vladivostok). On the eastern coasts and islands, bring spring/autumn clothes, but also a sweater, a warm jacket, a raincoat; bring gloves and a hat for the northern part and offshore excursions. In the mountains, warmer clothes depending on altitude; for the highest mountains, a fleece, a down jacket, a warm hat, gloves, a scarf.
Climate data - Siberia
| Anadyr |
|---|
Anadyr, location on the map |
|---|
| Jan | Feb | Mar | Apr | May | Jun | Jul | Aug | Sep | Oct | Nov | Dec |
|---|
| Min temp. | -25 | -25 | -22 | -15 | -4 | 4 | 9 | 7 | 2 | -6 | -15 | -22 |
|---|
| Max temp. | -18 | -17 | -14 | -8 | 3 | 12 | 16 | 14 | 8 | -1 | -8 | -15 |
|---|
| Precip. | 40 | 45 | 40 | 25 | 10 | 15 | 35 | 45 | 30 | 25 | 35 | 35 |
|---|
| Prec. days | 7 | 8 | 7 | 5 | 4 | 4 | 6 | 8 | 7 | 7 | 7 | 6 |
|---|
| Humidity | 81% | 81% | 80% | 81% | 81% | 74% | 77% | 79% | 79% | 84% | 84% | 81% |
|---|
| Day length | 5 | 8 | 12 | 15 | 19 | 21 | 20 | 16 | 13 | 10 | 6 | 4 |
|---|
| Sun hours | 1 | 4 | 6 | 8 | 8 | 9 | 8 | 6 | 5 | 3 | 2 | 0 |
|---|
| Sea temp | -1 | -1 | -1 | -1 | 0 | 3 | 8 | 9 | 7 | 3 | 1 | 0 |
|---|
| Barnaul |
|---|
Barnaul, location on the map |
|---|
| Jan | Feb | Mar | Apr | May | Jun | Jul | Aug | Sep | Oct | Nov | Dec |
|---|
| Min temp. | -21 | -19 | -11 | 0 | 6 | 12 | 14 | 12 | 6 | 0 | -10 | -18 |
|---|
| Max temp. | -11 | -8 | 0 | 12 | 20 | 25 | 26 | 24 | 18 | 10 | -2 | -9 |
|---|
| Precip. | 25 | 20 | 20 | 30 | 40 | 55 | 70 | 45 | 35 | 35 | 40 | 30 |
|---|
| Prec. days | 7 | 6 | 5 | 6 | 8 | 7 | 8 | 8 | 6 | 10 | 9 | 8 |
|---|
| Humidity | 79% | 76% | 72% | 58% | 49% | 59% | 66% | 65% | 64% | 69% | 80% | 81% |
|---|
| Day length | 8 | 10 | 12 | 14 | 16 | 17 | 16 | 15 | 13 | 10 | 9 | 8 |
|---|
| Sun hours | 2 | 4 | 6 | 7 | 9 | 10 | 10 | 9 | 7 | 4 | 2 | 2 |
|---|
|
| Blagoveshchensk |
|---|
Blagoveshchensk, location on the map |
|---|
| Jan | Feb | Mar | Apr | May | Jun | Jul | Aug | Sep | Oct | Nov | Dec |
|---|
| Min temp. | -26 | -22 | -13 | -1 | 7 | 14 | 18 | 15 | 8 | -1 | -14 | -24 |
|---|
| Max temp. | -16 | -9 | -1 | 11 | 20 | 26 | 28 | 25 | 19 | 9 | -5 | -15 |
|---|
| Precip. | 5 | 5 | 10 | 25 | 50 | 85 | 150 | 110 | 60 | 30 | 15 | 10 |
|---|
| Prec. days | 2 | 2 | 2 | 4 | 8 | 9 | 11 | 10 | 7 | 5 | 3 | 4 |
|---|
| Humidity | 73% | 68% | 62% | 55% | 55% | 70% | 78% | 80% | 72% | 62% | 67% | 74% |
|---|
| Day length | 9 | 10 | 12 | 14 | 16 | 16 | 16 | 14 | 13 | 11 | 9 | 8 |
|---|
| Sun hours | 4 | 7 | 7 | 7 | 8 | 8 | 7 | 7 | 6 | 6 | 5 | 4 |
|---|
|
| Chelyabinsk (220 meters) |
|---|
Chelyabinsk, location on the map |
|---|
| Jan | Feb | Mar | Apr | May | Jun | Jul | Aug | Sep | Oct | Nov | Dec |
|---|
| Min temp. | -18 | -17 | -9 | -1 | 6 | 11 | 13 | 11 | 6 | 0 | -9 | -15 |
|---|
| Max temp. | -10 | -7 | 0 | 10 | 19 | 23 | 24 | 22 | 16 | 8 | -2 | -8 |
|---|
| Precip. | 20 | 15 | 15 | 25 | 45 | 60 | 85 | 55 | 40 | 35 | 25 | 25 |
|---|
| Prec. days | 6 | 4 | 4 | 5 | 7 | 9 | 10 | 9 | 7 | 8 | 7 | 7 |
|---|
| Humidity | 79% | 75% | 72% | 59% | 55% | 62% | 68% | 70% | 70% | 72% | 78% | 80% |
|---|
| Day length | 8 | 10 | 12 | 14 | 16 | 17 | 17 | 15 | 13 | 10 | 8 | 7 |
|---|
|
|
| Chita (685 meters) |
|---|
Chita, location on the map |
|---|
| Jan | Feb | Mar | Apr | May | Jun | Jul | Aug | Sep | Oct | Nov | Dec |
|---|
| Min temp. | -31 | -26 | -17 | -5 | 2 | 9 | 13 | 10 | 2 | -6 | -18 | -28 |
|---|
| Max temp. | -18 | -10 | -1 | 9 | 18 | 25 | 27 | 24 | 17 | 7 | -6 | -16 |
|---|
| Precip. | 5 | 0 | 5 | 10 | 25 | 55 | 85 | 85 | 40 | 10 | 5 | 5 |
|---|
| Prec. days | 1 | 1 | 1 | 2 | 5 | 7 | 10 | 10 | 7 | 2 | 2 | 2 |
|---|
| Humidity | 71% | 65% | 54% | 45% | 45% | 56% | 64% | 69% | 63% | 60% | 69% | 73% |
|---|
| Day length | 8 | 10 | 12 | 14 | 16 | 17 | 16 | 15 | 13 | 11 | 9 | 8 |
|---|
| Sun hours | 4 | 6 | 8 | 8 | 9 | 9 | 8 | 7 | 7 | 6 | 4 | 3 |
|---|
|
| Golomyanny |
|---|
Golomyanny, location on the map |
|---|
| Jan | Feb | Mar | Apr | May | Jun | Jul | Aug | Sep | Oct | Nov | Dec |
|---|
| Min temp. | -30 | -30 | -29 | -22 | -11 | -3 | 0 | -1 | -4 | -12 | -22 | -27 |
|---|
| Max temp. | -23 | -24 | -22 | -16 | -7 | 0 | 2 | 2 | -1 | -8 | -16 | -20 |
|---|
| Precip. | 10 | 10 | 10 | 10 | 10 | 15 | 30 | 25 | 25 | 15 | 10 | 10 |
|---|
| Prec. days | 3 | 3 | 3 | 4 | 2 | 5 | 6 | 6 | 7 | 5 | 3 | 4 |
|---|
| Humidity | 82% | 82% | 82% | 84% | 87% | 91% | 94% | 94% | 92% | 86% | 84% | 83% |
|---|
| Day length | 0 | 1 | 12 | 22 | 24 | 24 | 24 | 24 | 15 | 4 | 0 | 0 |
|---|
|
|
| Irkutsk (465 meters) |
|---|
Irkutsk, location on the map |
|---|
| Jan | Feb | Mar | Apr | May | Jun | Jul | Aug | Sep | Oct | Nov | Dec |
|---|
| Min temp. | -22 | -19 | -11 | -2 | 4 | 10 | 14 | 11 | 5 | -2 | -12 | -19 |
|---|
| Max temp. | -13 | -8 | 1 | 10 | 18 | 24 | 26 | 23 | 16 | 8 | -3 | -11 |
|---|
| Precip. | 15 | 10 | 10 | 20 | 35 | 70 | 105 | 95 | 55 | 20 | 20 | 20 |
|---|
| Prec. days | 5 | 3 | 4 | 5 | 7 | 8 | 10 | 9 | 9 | 5 | 6 | 6 |
|---|
| Humidity | 79% | 72% | 63% | 53% | 51% | 63% | 72% | 76% | 74% | 71% | 79% | 83% |
|---|
| Day length | 8 | 10 | 12 | 14 | 16 | 17 | 16 | 15 | 13 | 11 | 9 | 8 |
|---|
| Sun hours | 4 | 6 | 7 | 8 | 9 | 9 | 9 | 8 | 6 | 5 | 3 | 2 |
|---|
|
| Kemerovo |
|---|
Kemerovo, location on the map |
|---|
| Jan | Feb | Mar | Apr | May | Jun | Jul | Aug | Sep | Oct | Nov | Dec |
|---|
| Min temp. | -22 | -20 | -13 | -3 | 5 | 11 | 13 | 11 | 5 | -1 | -10 | -19 |
|---|
| Max temp. | -13 | -9 | -1 | 9 | 19 | 24 | 26 | 23 | 16 | 8 | -3 | -10 |
|---|
| Precip. | 30 | 20 | 20 | 30 | 40 | 70 | 70 | 65 | 45 | 40 | 45 | 45 |
|---|
| Prec. days | 9 | 7 | 6 | 7 | 8 | 10 | 9 | 11 | 9 | 10 | 12 | 12 |
|---|
| Humidity | 82% | 80% | 73% | 62% | 54% | 64% | 70% | 73% | 74% | 76% | 82% | 83% |
|---|
| Day length | 8 | 10 | 12 | 14 | 16 | 17 | 17 | 15 | 13 | 10 | 8 | 7 |
|---|
| Sun hours | 2 | 4 | 5 | 7 | 8 | 9 | 10 | 8 | 5 | 3 | 2 | 1 |
|---|
|
| Khabarovsk |
|---|
Khabarovsk, location on the map |
|---|
| Jan | Feb | Mar | Apr | May | Jun | Jul | Aug | Sep | Oct | Nov | Dec |
|---|
| Min temp. | -23 | -20 | -11 | 0 | 7 | 13 | 17 | 16 | 9 | 1 | -10 | -21 |
|---|
| Max temp. | -15 | -10 | -2 | 10 | 19 | 24 | 27 | 25 | 19 | 11 | -3 | -14 |
|---|
| Precip. | 15 | 10 | 25 | 40 | 65 | 65 | 130 | 135 | 85 | 45 | 25 | 20 |
|---|
| Prec. days | 3 | 3 | 5 | 7 | 9 | 9 | 10 | 11 | 9 | 7 | 5 | 5 |
|---|
| Humidity | 73% | 69% | 65% | 60% | 63% | 73% | 79% | 82% | 76% | 65% | 69% | 72% |
|---|
| Day length | 9 | 10 | 12 | 14 | 15 | 16 | 16 | 14 | 13 | 11 | 9 | 8 |
|---|
| Sun hours | 5 | 6 | 7 | 7 | 8 | 9 | 8 | 7 | 7 | 6 | 5 | 5 |
|---|
|
| Krasnoyarsk (275 meters) |
|---|
Krasnoyarsk, location on the map |
|---|
| Jan | Feb | Mar | Apr | May | Jun | Jul | Aug | Sep | Oct | Nov | Dec |
|---|
| Min temp. | -19 | -16 | -9 | -1 | 5 | 11 | 14 | 11 | 5 | -1 | -11 | -17 |
|---|
| Max temp. | -12 | -8 | 1 | 9 | 17 | 24 | 25 | 22 | 15 | 7 | -4 | -9 |
|---|
| Precip. | 15 | 15 | 20 | 30 | 50 | 65 | 70 | 75 | 55 | 40 | 40 | 30 |
|---|
| Prec. days | 6 | 4 | 6 | 8 | 10 | 11 | 10 | 11 | 11 | 10 | 10 | 9 |
|---|
| Humidity | 73% | 70% | 64% | 58% | 54% | 64% | 72% | 76% | 75% | 71% | 74% | 73% |
|---|
| Day length | 8 | 10 | 12 | 14 | 16 | 18 | 17 | 15 | 13 | 10 | 8 | 7 |
|---|
| Sun hours | 2 | 4 | 6 | 7 | 8 | 9 | 9 | 8 | 5 | 4 | 2 | 1 |
|---|
|
| Magadan |
|---|
Magadan, location on the map |
|---|
| Jan | Feb | Mar | Apr | May | Jun | Jul | Aug | Sep | Oct | Nov | Dec |
|---|
| Min temp. | -18 | -18 | -14 | -7 | 0 | 5 | 10 | 10 | 5 | -3 | -12 | -16 |
|---|
| Max temp. | -13 | -13 | -8 | -1 | 5 | 11 | 15 | 15 | 10 | 2 | -7 | -12 |
|---|
| Precip. | 15 | 15 | 20 | 25 | 35 | 50 | 55 | 110 | 80 | 70 | 65 | 30 |
|---|
| Prec. days | 4 | 4 | 5 | 5 | 6 | 7 | 8 | 10 | 9 | 9 | 9 | 5 |
|---|
| Humidity | 65% | 64% | 65% | 71% | 78% | 82% | 86% | 83% | 78% | 69% | 66% | 64% |
|---|
| Day length | 7 | 9 | 12 | 15 | 17 | 19 | 18 | 16 | 13 | 10 | 8 | 6 |
|---|
| Sun hours | 2 | 5 | 7 | 8 | 7 | 8 | 6 | 6 | 5 | 5 | 3 | 2 |
|---|
| Sea temp | 0 | 0 | 0 | 0 | 2 | 6 | 11 | 12 | 9 | 4 | 2 | 1 |
|---|
| Novosibirsk |
|---|
Novosibirsk, location on the map |
|---|
| Jan | Feb | Mar | Apr | May | Jun | Jul | Aug | Sep | Oct | Nov | Dec |
|---|
| Min temp. | -22 | -19 | -13 | -2 | 6 | 12 | 14 | 11 | 6 | 0 | -10 | -19 |
|---|
| Max temp. | -13 | -9 | -2 | 9 | 19 | 24 | 25 | 23 | 16 | 8 | -3 | -10 |
|---|
| Precip. | 25 | 20 | 20 | 25 | 30 | 60 | 60 | 60 | 45 | 40 | 35 | 35 |
|---|
| Prec. days | 8 | 6 | 6 | 6 | 7 | 9 | 8 | 9 | 8 | 9 | 10 | 11 |
|---|
| Humidity | 82% | 81% | 77% | 65% | 58% | 66% | 73% | 75% | 75% | 78% | 83% | 83% |
|---|
| Day length | 8 | 10 | 12 | 14 | 16 | 17 | 17 | 15 | 13 | 10 | 8 | 7 |
|---|
| Sun hours | 2 | 4 | 5 | 7 | 9 | 10 | 10 | 8 | 6 | 3 | 2 | 1 |
|---|
|
| Omsk |
|---|
Omsk, location on the map |
|---|
| Jan | Feb | Mar | Apr | May | Jun | Jul | Aug | Sep | Oct | Nov | Dec |
|---|
| Min temp. | -21 | -19 | -12 | -1 | 7 | 12 | 14 | 12 | 6 | 0 | -10 | -18 |
|---|
| Max temp. | -13 | -10 | -3 | 10 | 20 | 24 | 25 | 22 | 16 | 9 | -3 | -10 |
|---|
| Precip. | 20 | 15 | 20 | 25 | 30 | 55 | 70 | 60 | 30 | 30 | 35 | 30 |
|---|
| Prec. days | 7 | 6 | 5 | 5 | 6 | 8 | 9 | 9 | 6 | 6 | 9 | 8 |
|---|
| Humidity | 79% | 78% | 76% | 61% | 48% | 57% | 63% | 67% | 67% | 72% | 82% | 82% |
|---|
| Day length | 8 | 10 | 12 | 14 | 16 | 17 | 17 | 15 | 13 | 10 | 8 | 7 |
|---|
| Sun hours | 2 | 4 | 6 | 8 | 9 | 11 | 10 | 8 | 6 | 3 | 2 | 2 |
|---|
|
| Oymyakon (750 meters) |
|---|
Oymyakon, location on the map |
|---|
| Jan | Feb | Mar | Apr | May | Jun | Jul | Aug | Sep | Oct | Nov | Dec |
|---|
| Min temp. | -50 | -48 | -40 | -24 | -4 | 4 | 7 | 3 | -3 | -20 | -39 | -48 |
|---|
| Max temp. | -43 | -36 | -20 | -3 | 10 | 20 | 23 | 19 | 9 | -9 | -30 | -42 |
|---|
| Precip. | 5 | 5 | 5 | 5 | 15 | 35 | 40 | 40 | 25 | 15 | 15 | 5 |
|---|
| Prec. days | 1 | 1 | 2 | 2 | 4 | 7 | 8 | 8 | 6 | 4 | 4 | 2 |
|---|
| Humidity | 75% | 74% | 72% | 68% | 60% | 59% | 65% | 70% | 73% | 79% | 77% | 74% |
|---|
| Day length | 6 | 9 | 12 | 15 | 18 | 20 | 19 | 16 | 13 | 10 | 7 | 5 |
|---|
| Sun hours | 1 | 4 | 8 | 9 | 9 | 10 | 10 | 8 | 5 | 4 | 2 | 0 |
|---|
|
| Petropavlovsk |
|---|
Petropavlovsk, location on the map |
|---|
| Jan | Feb | Mar | Apr | May | Jun | Jul | Aug | Sep | Oct | Nov | Dec |
|---|
| Min temp. | -9 | -9 | -6 | -2 | 2 | 7 | 10 | 11 | 8 | 3 | -3 | -7 |
|---|
| Max temp. | -4 | -4 | -1 | 3 | 8 | 14 | 17 | 17 | 14 | 8 | 2 | -3 |
|---|
| Precip. | 115 | 65 | 100 | 95 | 60 | 55 | 60 | 80 | 105 | 150 | 150 | 105 |
|---|
| Prec. days | 10 | 8 | 9 | 9 | 7 | 7 | 7 | 9 | 8 | 9 | 9 | 9 |
|---|
| Humidity | 71% | 68% | 68% | 72% | 75% | 79% | 84% | 83% | 79% | 74% | 70% | 71% |
|---|
| Day length | 8 | 10 | 12 | 14 | 16 | 17 | 16 | 15 | 13 | 11 | 9 | 8 |
|---|
| Sun hours | 3 | 4 | 6 | 6 | 6 | 6 | 6 | 6 | 6 | 5 | 4 | 3 |
|---|
| Sea temp | 1 | 1 | 1 | 1 | 3 | 6 | 10 | 12 | 11 | 8 | 5 | 3 |
|---|
| Pevek |
|---|
Pevek, location on the map |
|---|
| Jan | Feb | Mar | Apr | May | Jun | Jul | Aug | Sep | Oct | Nov | Dec |
|---|
| Min temp. | -29 | -30 | -26 | -19 | -6 | 2 | 6 | 5 | 2 | -7 | -18 | -26 |
|---|
| Max temp. | -22 | -23 | -17 | -10 | 1 | 11 | 13 | 11 | 6 | -3 | -12 | -20 |
|---|
| Precip. | 20 | 15 | 10 | 10 | 10 | 20 | 35 | 35 | 25 | 20 | 15 | 15 |
|---|
|
|
|
|
|
| Surgut |
|---|
Surgut, location on the map |
|---|
| Jan | Feb | Mar | Apr | May | Jun | Jul | Aug | Sep | Oct | Nov | Dec |
|---|
| Min temp. | -23 | -22 | -14 | -7 | 2 | 10 | 14 | 11 | 5 | -3 | -15 | -22 |
|---|
| Max temp. | -16 | -14 | -5 | 2 | 11 | 19 | 22 | 18 | 11 | 2 | -8 | -14 |
|---|
| Precip. | 30 | 20 | 20 | 30 | 40 | 65 | 75 | 80 | 65 | 50 | 45 | 30 |
|---|
| Prec. days | 10 | 7 | 7 | 8 | 8 | 11 | 9 | 12 | 12 | 12 | 12 | 10 |
|---|
| Humidity | 81% | 80% | 74% | 68% | 63% | 64% | 66% | 76% | 79% | 84% | 85% | 82% |
|---|
| Day length | 6 | 9 | 12 | 15 | 18 | 19 | 18 | 16 | 13 | 10 | 7 | 6 |
|---|
| Sun hours | 1 | 3 | 5 | 7 | 8 | 9 | 10 | 7 | 5 | 2 | 2 | 1 |
|---|
|
| Tiksi |
|---|
Tiksi, location on the map |
|---|
| Jan | Feb | Mar | Apr | May | Jun | Jul | Aug | Sep | Oct | Nov | Dec |
|---|
| Min temp. | -33 | -34 | -31 | -23 | -9 | 0 | 5 | 5 | -1 | -14 | -26 | -31 |
|---|
| Max temp. | -26 | -27 | -23 | -13 | -2 | 7 | 13 | 11 | 4 | -7 | -19 | -25 |
|---|
| Precip. | 30 | 20 | 10 | 10 | 15 | 30 | 50 | 50 | 30 | 15 | 20 | 45 |
|---|
| Prec. days | 6 | 4 | 4 | 2 | 4 | 7 | 8 | 9 | 7 | 5 | 5 | 7 |
|---|
| Humidity | 82% | 82% | 83% | 83% | 85% | 82% | 83% | 83% | 82% | 83% | 82% | 81% |
|---|
| Day length | 0 | 7 | 12 | 17 | 23 | 24 | 24 | 19 | 14 | 8 | 2 | 0 |
|---|
| Sun hours | 0 | 1 | 6 | 9 | 6 | 8 | 8 | 4 | 3 | 2 | 0 | 0 |
|---|
| Sea temp | -2 | -2 | -2 | -2 | -1 | 1 | 2 | 3 | 3 | 0 | -1 | -1 |
|---|
| Tomsk |
|---|
Tomsk, location on the map |
|---|
| Jan | Feb | Mar | Apr | May | Jun | Jul | Aug | Sep | Oct | Nov | Dec |
|---|
| Min temp. | -22 | -19 | -12 | -3 | 5 | 11 | 14 | 11 | 5 | -1 | -11 | -19 |
|---|
| Max temp. | -14 | -9 | -1 | 8 | 18 | 23 | 25 | 22 | 15 | 7 | -4 | -11 |
|---|
| Precip. | 35 | 25 | 30 | 35 | 45 | 65 | 70 | 70 | 55 | 50 | 55 | 50 |
|---|
| Prec. days | 10 | 8 | 8 | 8 | 8 | 11 | 8 | 10 | 10 | 11 | 13 | 14 |
|---|
| Humidity | 81% | 78% | 72% | 65% | 61% | 70% | 76% | 79% | 79% | 80% | 83% | 82% |
|---|
| Day length | 8 | 10 | 12 | 14 | 16 | 18 | 17 | 15 | 13 | 10 | 8 | 7 |
|---|
| Sun hours | 2 | 4 | 5 | 7 | 8 | 10 | 10 | 8 | 6 | 3 | 2 | 1 |
|---|
|
| Ulan Ude (500 meters) |
|---|
Ulan Ude, location on the map |
|---|
| Jan | Feb | Mar | Apr | May | Jun | Jul | Aug | Sep | Oct | Nov | Dec |
|---|
| Min temp. | -28 | -24 | -14 | -3 | 4 | 11 | 14 | 12 | 4 | -4 | -14 | -24 |
|---|
| Max temp. | -18 | -11 | 0 | 10 | 19 | 25 | 27 | 24 | 17 | 7 | -5 | -15 |
|---|
| Precip. | 5 | 0 | 5 | 5 | 20 | 35 | 65 | 65 | 25 | 10 | 10 | 10 |
|---|
| Prec. days | 1 | 1 | 1 | 2 | 4 | 6 | 8 | 8 | 5 | 2 | 3 | 3 |
|---|
| Humidity | 73% | 72% | 62% | 47% | 45% | 52% | 60% | 66% | 65% | 65% | 74% | 76% |
|---|
| Day length | 8 | 10 | 12 | 14 | 16 | 17 | 16 | 15 | 13 | 11 | 9 | 8 |
|---|
| Sun hours | 4 | 6 | 7 | 8 | 9 | 10 | 9 | 8 | 7 | 5 | 4 | 3 |
|---|
|
| Verkhoyansk |
|---|
Verkhoyansk, location on the map |
|---|
| Jan | Feb | Mar | Apr | May | Jun | Jul | Aug | Sep | Oct | Nov | Dec |
|---|
| Min temp. | -48 | -47 | -38 | -22 | -2 | 7 | 10 | 6 | -2 | -19 | -37 | -46 |
|---|
| Max temp. | -42 | -37 | -20 | -3 | 10 | 20 | 24 | 19 | 8 | -9 | -30 | -40 |
|---|
| Precip. | 5 | 5 | 5 | 5 | 15 | 30 | 35 | 30 | 20 | 10 | 10 | 5 |
|---|
| Prec. days | 2 | 1 | 2 | 1 | 4 | 6 | 7 | 6 | 5 | 4 | 4 | 2 |
|---|
| Humidity | 74% | 74% | 69% | 63% | 58% | 57% | 61% | 69% | 74% | 78% | 77% | 75% |
|---|
| Day length | 4 | 8 | 12 | 16 | 20 | 24 | 22 | 17 | 13 | 9 | 5 | 1 |
|---|
| Sun hours | 0 | 3 | 7 | 9 | 10 | 12 | 11 | 7 | 4 | 3 | 1 | 0 |
|---|
|
| Vladivostok |
|---|
Vladivostok, location on the map |
|---|
| Jan | Feb | Mar | Apr | May | Jun | Jul | Aug | Sep | Oct | Nov | Dec |
|---|
| Min temp. | -15 | -11 | -4 | 2 | 7 | 11 | 16 | 18 | 13 | 6 | -4 | -12 |
|---|
| Max temp. | -8 | -4 | 3 | 10 | 15 | 18 | 22 | 23 | 20 | 13 | 3 | -5 |
|---|
| Precip. | 10 | 15 | 25 | 45 | 95 | 105 | 155 | 175 | 105 | 65 | 35 | 20 |
|---|
| Prec. days | 2 | 2 | 4 | 6 | 10 | 12 | 13 | 11 | 7 | 6 | 4 | 3 |
|---|
| Humidity | 58% | 57% | 60% | 67% | 76% | 87% | 92% | 87% | 77% | 65% | 60% | 60% |
|---|
| Day length | 9 | 10 | 12 | 13 | 15 | 15 | 15 | 14 | 12 | 11 | 10 | 9 |
|---|
| Sun hours | 6 | 6 | 7 | 6 | 5 | 4 | 4 | 5 | 7 | 6 | 5 | 5 |
|---|
| Sea temp | 2 | 1 | 1 | 3 | 7 | 13 | 18 | 21 | 19 | 14 | 9 | 4 |
|---|
| Yakutsk |
|---|
Yakutsk, location on the map |
|---|
| Jan | Feb | Mar | Apr | May | Jun | Jul | Aug | Sep | Oct | Nov | Dec |
|---|
| Min temp. | -40 | -38 | -27 | -11 | 1 | 10 | 13 | 9 | 1 | -11 | -30 | -40 |
|---|
| Max temp. | -34 | -28 | -13 | 2 | 14 | 23 | 26 | 22 | 12 | -3 | -23 | -34 |
|---|
| Precip. | 10 | 10 | 5 | 10 | 20 | 30 | 40 | 35 | 30 | 20 | 15 | 10 |
|---|
| Prec. days | 3 | 3 | 2 | 2 | 5 | 5 | 7 | 6 | 6 | 6 | 5 | 2 |
|---|
| Humidity | 76% | 76% | 70% | 60% | 54% | 57% | 62% | 67% | 72% | 78% | 78% | 76% |
|---|
| Day length | 6 | 9 | 12 | 15 | 18 | 20 | 19 | 16 | 13 | 10 | 7 | 5 |
|---|
| Sun hours | 1 | 4 | 8 | 10 | 9 | 12 | 11 | 8 | 6 | 3 | 2 | 0 |
|---|
|
| Yekaterinburg (230 meters) |
|---|
Yekaterinburg, location on the map |
|---|
| Jan | Feb | Mar | Apr | May | Jun | Jul | Aug | Sep | Oct | Nov | Dec |
|---|
| Min temp. | -19 | -18 | -11 | -2 | 4 | 10 | 12 | 10 | 4 | -1 | -10 | -16 |
|---|
| Max temp. | -10 | -7 | 1 | 10 | 18 | 22 | 24 | 21 | 15 | 7 | -3 | -8 |
|---|
| Precip. | 25 | 20 | 15 | 30 | 45 | 75 | 80 | 65 | 55 | 40 | 30 | 25 |
|---|
| Prec. days | 7 | 5 | 4 | 6 | 8 | 10 | 10 | 10 | 9 | 9 | 8 | 6 |
|---|
| Humidity | 78% | 75% | 70% | 62% | 57% | 66% | 71% | 76% | 77% | 77% | 80% | 80% |
|---|
| Day length | 8 | 10 | 12 | 14 | 16 | 18 | 17 | 15 | 13 | 10 | 8 | 7 |
|---|
| Sun hours | 2 | 3 | 5 | 7 | 8 | 9 | 9 | 7 | 5 | 3 | 2 | 1 |
|---|
|
| Yuzhno Sakhalinsk |
|---|
Yuzhno Sakhalinsk, location on the map |
|---|
| Jan | Feb | Mar | Apr | May | Jun | Jul | Aug | Sep | Oct | Nov | Dec |
|---|
| Min temp. | -16 | -17 | -11 | -3 | 3 | 8 | 12 | 14 | 9 | 2 | -5 | -13 |
|---|
| Max temp. | -6 | -5 | 0 | 7 | 13 | 18 | 21 | 22 | 19 | 13 | 4 | -4 |
|---|
| Precip. | 55 | 40 | 55 | 60 | 65 | 55 | 90 | 115 | 110 | 100 | 80 | 75 |
|---|
| Prec. days | 9 | 8 | 9 | 8 | 8 | 7 | 8 | 9 | 10 | 11 | 11 | 12 |
|---|
| Humidity | 80% | 78% | 75% | 74% | 76% | 83% | 86% | 86% | 82% | 78% | 79% | 81% |
|---|
| Day length | 9 | 10 | 12 | 14 | 15 | 16 | 15 | 14 | 12 | 11 | 9 | 9 |
|---|
| Sun hours | 4 | 6 | 6 | 7 | 7 | 6 | 5 | 5 | 6 | 5 | 4 | 4 |
|---|
| Sea temp | 1 | 1 | 1 | 2 | 5 | 10 | 14 | 18 | 16 | 12 | 7 | 3 |
|---|
See also the
temperatures month by month