Select units of measurement for the temperature and rainfall tables (metric or imperial).
Average weather, temperature, rainfall, sunshine hours

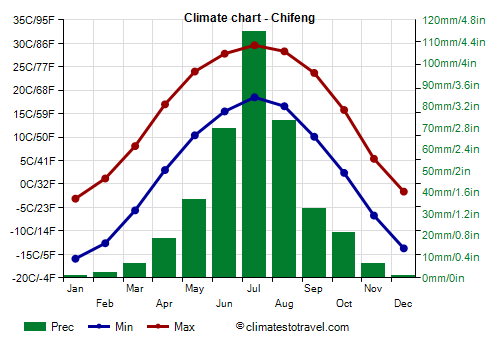
The climate of Chifeng is
continental semi-arid, with cold, dry winters and hot, rainy summers.
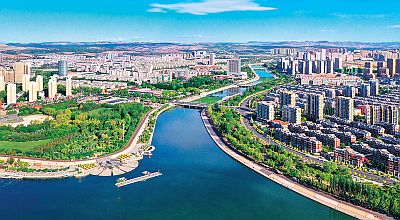
Chifeng (Ulankhad in Mongolian) is a city of 4,000,000 inhabitants (including the metropolitan area) located in the northeast of China, in the autonomous region of
Inner Mongolia, 600 meters (2,000 feet) above sea level and at 42 degrees north latitude. The capital, Beijing, is located 335 km (210 mi) to the southwest.

In
winter, from December to February, the temperature is several degrees below freezing: the average in January is about -10 °C. The sun shines quite often even in this season, and due to the dry climate, snowfall is rare. The wind can bring dust and sand from Mongolia's deserts.
During cold spells, temperatures can drop to -25 °C (-13 °F) or below. In January 2021, it dropped to -29.5 °C (-21 °F), the lowest since decades.
Summer, from June to August, is hot, with an average of 24 °C (75 °F) in July, and is also quite rainy, due to the Asian monsoon. However, there can be quite cool periods, especially in June and in the second half of August.
Despite the altitude, there can be very hot spells in good weather, with highs of 35 °C (95 °F) or higher. In July 2000, the temperature reached 40.4 °C (104.7 °F).
Spring, from March to May, is characterized by clashes of air masses, which can cause gusts of wind and sudden changes in temperature. Sometimes the temperature can exceed 30 °C (86 °F) already in April and 35 °C (95 °F) in May. On the other hand,
autumn, from September to November, is a quieter season, although the temperature drops rapidly.
Chifeng - Climate data
In Chifeng, the
average temperature of the coldest month (January) is of
-9.5 °C, that of the warmest month (July) is of
24 °C. Here are the average temperatures.
Chifeng - Average temperatures (1991-2020) |
| Month | Min | Max | Mean |
|---|
| January | -15.9 | -3.1 | -9.5 |
|---|
| February | -12.6 | 1.2 | -5.7 |
|---|
| March | -5.6 | 8.1 | 1.2 |
|---|
| April | 3 | 17 | 10 |
|---|
| May | 10.4 | 24 | 17.2 |
|---|
| June | 15.5 | 27.8 | 21.6 |
|---|
| July | 18.5 | 29.6 | 24 |
|---|
| August | 16.6 | 28.3 | 22.5 |
|---|
| September | 10.1 | 23.7 | 16.9 |
|---|
| October | 2.4 | 15.8 | 9.1 |
|---|
| November | -6.7 | 5.4 | -0.6 |
|---|
| December | -13.7 | -1.6 | -7.6 |
|---|
| Year | 1.9 | 14.8 | 8.3 |
|---|
amounts to
385 millimeters per year: it is therefore quite scarce. It ranges from
1.2 millimeters in the driest month (January) to
114.6 millimeters in the wettest one (July). Here is the average precipitation.
Chifeng - Average precipitation| Month | Days |
|---|
| January | 1 | 0 |
|---|
| February | 2 | 1 |
|---|
| March | 7 | 1 |
|---|
| April | 18 | 3 |
|---|
| May | 37 | 5 |
|---|
| June | 70 | 9 |
|---|
| July | 115 | 10 |
|---|
| August | 73 | 7 |
|---|
| September | 32 | 5 |
|---|
| October | 21 | 3 |
|---|
| November | 7 | 2 |
|---|
| December | 1 | 0 |
|---|
| Year | 385 | 45 |
|---|
There are on average around 2960
sunshine hours per year. Here are the average hours of sunshine per day.
Chifeng - Sunshine hours| Month | Average | Total |
|---|
| January | 7 | 215 |
|---|
| February | 8 | 220 |
|---|
| March | 8.5 | 260 |
|---|
| April | 9 | 260 |
|---|
| May | 9.5 | 285 |
|---|
| June | 9 | 265 |
|---|
| July | 8.5 | 265 |
|---|
| August | 9 | 275 |
|---|
| September | 8.5 | 255 |
|---|
| October | 8 | 245 |
|---|
| November | 7 | 205 |
|---|
| December | 6.5 | 200 |
|---|
| Year | 8.1 | 2960 |
|---|