Select units of measurement for the temperature and rainfall tables (metric or imperial).
Average weather, temperature, rainfall, sunshine hours

The climate of Nanyang is
temperate, with cold, dry winters and hot, humid and rainy summers.
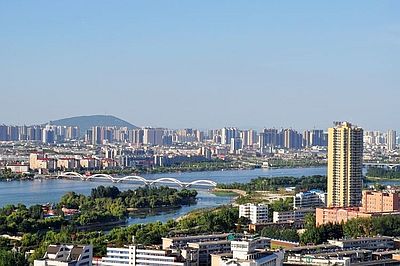
The city is located in central-eastern China, in the Henan province, at 33 degrees north latitude. To the north of the city are the Funiu Mountains, while 90 km (55 mi) to the east is the Banqiao Dam.
Winter, from December to February, is quite cold: the average January temperature is 2.3 °C (36 °F). There may be very cold periods, with temperatures around freezing even during the day, and with some chance of snow. The temperature dropped to -17.5 °C (0.5 °F) in December 1991, while on other occasions it dropped to -13/-14 °C (7/8.5 °F).
In other situations, instead, the temperature becomes mild, around 18 °C (64 °F).
At night, fog can form.
Spring, from March to May, is initially mild, and becomes gradually warmer. Sometimes it can already get hot: in late April, the temperature can sometimes exceed 30 °C (86 °F), and in May, 35 °C (95 °F). Spring is a more unstable season than autumn.
Summer, from June to September, is hot and muggy. Both the heat island effect of the big city and the humidity make the heat uncomfortable, especially in July and August.
The periods of good weather can be sweltering, with highs around 37/38 °C (99/100 °F) or more and tropical nights. In June 2022, the temperature reached 40.5 °C (104.9 °F), and the average maximum of the month was 36.9 °C (98.4 °F).
Autumn, in October and November, is initially mild, and gradually becomes cooler, and then quite cold at night by November.

Best Time
To visit Nanyang you can choose spring and autumn, and in particular the months of April and October, to avoid the cold of winter as well as the heat and rains of summer. In spring, you can admire the roses in bloom in the city parks.
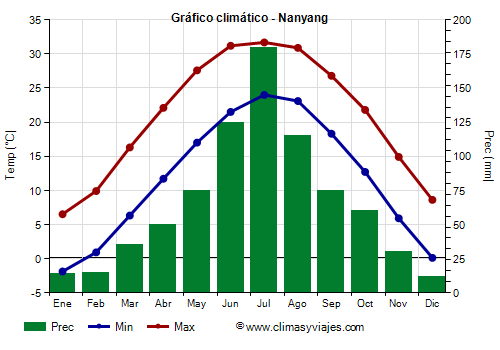
Nanyang - Climate data
In Nanyang, the
average temperature of the coldest month (January) is of
2.3 °C, that of the warmest month (July) is of
27.8 °C. Here are the average temperatures.
Nanyang - Average temperatures (2000-2020) |
| Month | Min | Max | Mean |
|---|
| January | -1.9 | 6.5 | 2.3 |
|---|
| February | 0.9 | 9.9 | 5.4 |
|---|
| March | 6.3 | 16.3 | 11.3 |
|---|
| April | 11.7 | 22.1 | 16.9 |
|---|
| May | 17 | 27.6 | 22.3 |
|---|
| June | 21.5 | 31.2 | 26.4 |
|---|
| July | 24 | 31.7 | 27.8 |
|---|
| August | 23.1 | 30.9 | 27 |
|---|
| September | 18.3 | 26.8 | 22.6 |
|---|
| October | 12.7 | 21.8 | 17.2 |
|---|
| November | 5.9 | 14.9 | 10.4 |
|---|
| December | 0.1 | 8.6 | 4.4 |
|---|
| Year | 11.7 | 20.7 | 16.2 |
|---|
amounts to
780 millimeters per year: so, it is at an intermediate level. It ranges from
11.5 millimeters in the driest month (December) to
180 millimeters in the wettest one (July). Here is the average precipitation.
Nanyang - Average precipitation| Month | Days |
|---|
| January | 14 | 4 |
|---|
| February | 15 | 5 |
|---|
| March | 35 | 8 |
|---|
| April | 50 | 8 |
|---|
| May | 75 | 10 |
|---|
| June | 125 | 10 |
|---|
| July | 180 | 12 |
|---|
| August | 115 | 10 |
|---|
| September | 75 | 9 |
|---|
| October | 60 | 9 |
|---|
| November | 30 | 6 |
|---|
| December | 12 | 4 |
|---|
| Year | 780 | 95 |
|---|