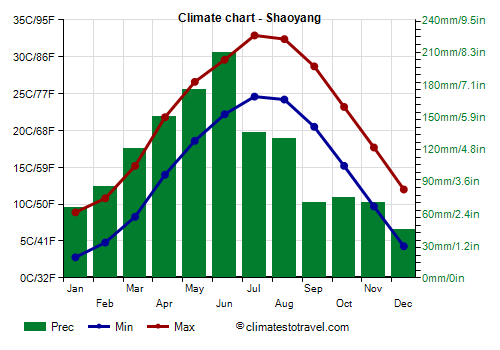
Select units of measurement for the temperature and rainfall tables (metric or imperial).
Average weather, temperature, rainfall, sunshine hours

The climate of Shaoyang is
temperate humid, with quite mild winters and very hot, muggy and rainy summers.
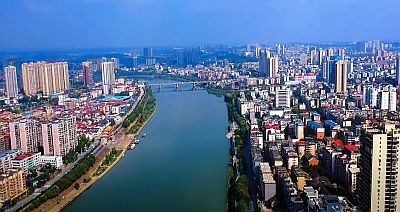
The city, formerly known as Baoqing, is located in southern China's Hunan province, at 27 degrees north latitude and 250 meters (800 feet) above sea level. The Zi River flows north through the city, then flows into Lake Dongting.
In the north there are mountains that reach 1,400 meters (4,600 feet), while in the west there are others that reach 1,750 meters (5,700 feet).
From January to June, the sky is often cloudy and the rains are frequent, but at first they are quite light, then they gradually become more abundant. In July and August, the rains become less frequent, and these are also the sunniest months of the year. The rains continue with moderate frequency until December.
In
winter there are mild periods, but also quite cold periods, in which fog forms. In addition, there can sometimes be very cold periods, with snow and frost. In January 1977 the temperature dropped to -10 °C (14 °F), while in December 1991 it dropped to -7 °C (19.5 °F). In general, however, the temperature reaches -5 °C (23 °F) in the coldest periods.
Summer is particularly hot and humid. On the hottest days, the temperature can reach 39/40 °C (102/104 °F).

Best Time
It is not easy to find the best time to visit Shaoyang. Being that the spring is very rainy and with little sunshine, you can choose autumn, especially from late September to early November, since it is the least rainy period of the year, and it is generally mild or pleasantly warm. It must be said that in autumn, the arrival of the remains of typhoons cannot be excluded, although the sea, from which they come, is far away.
Shaoyang - Climate data
In Shaoyang, the
average temperature of the coldest month (January) is of
5.8 °C, that of the warmest month (July) is of
28.8 °C. Here are the average temperatures.
Shaoyang - Average temperatures (1981-2010) |
| Month | Min | Max | Mean |
|---|
| January | 2.8 | 8.9 | 5.8 |
|---|
| February | 4.8 | 10.8 | 7.8 |
|---|
| March | 8.3 | 15.2 | 11.8 |
|---|
| April | 14 | 21.8 | 17.9 |
|---|
| May | 18.6 | 26.6 | 22.6 |
|---|
| June | 22.2 | 29.6 | 25.9 |
|---|
| July | 24.6 | 32.9 | 28.8 |
|---|
| August | 24.2 | 32.4 | 28.3 |
|---|
| September | 20.5 | 28.7 | 24.6 |
|---|
| October | 15.2 | 23.2 | 19.2 |
|---|
| November | 9.7 | 17.7 | 13.7 |
|---|
| December | 4.3 | 12 | 8.2 |
|---|
| Year | 14.1 | 21.7 | 17.9 |
|---|
amounts to
1330 millimeters per year: it is therefore quite abundant. It ranges from
45 millimeters in the driest month (December) to
210 millimeters in the wettest one (June). Here is the average precipitation.
Shaoyang - Average precipitation| Month | Days |
|---|
| January | 65 | 15 |
|---|
| February | 85 | 15 |
|---|
| March | 120 | 19 |
|---|
| April | 150 | 18 |
|---|
| May | 175 | 17 |
|---|
| June | 210 | 15 |
|---|
| July | 135 | 11 |
|---|
| August | 130 | 12 |
|---|
| September | 70 | 9 |
|---|
| October | 75 | 12 |
|---|
| November | 70 | 10 |
|---|
| December | 45 | 10 |
|---|
| Year | 1330 | 162 |
|---|