Select units of measurement for the temperature and rainfall tables (metric or imperial).
Average weather, temperature, rainfall, sunshine
Mexico, a vast country in North America crossed by the Tropic of Cancer in the central part, has
different types of climate, however, it is generally arid on the west coast and in the central-northern highlands, it is moderately rainy in the mountain ranges and in the southern plateaus, while it's very rainy in some tropical southern areas. Summer is the rainiest season almost everywhere.
Precipitation is scarce in the central-north, where it is generally less than 500 millimeters (20 inches) per year, while it is more abundant in the central-south, where it generally exceeds 1,000 mm (40 in). In the mountains of the south, in Chiapas, it even exceeds 3,000 mm (118 in) per year.
In winter, the
temperature increases gradually from north to south, to the point that the south has a purely tropical climate.
Altitude plays an important role as well: there are many cities located at high altitude, including the capital, where the climate is cooler. And so, the average January temperature is 9 °C (48 °F) in Ciudad Juárez, 14 °C (57 °F) in Mexico City, 23.5 °C (74 °F) in Cancún and 26 °C (79 °F) in Acapulco.
During
winter, the "
Norte", a cold wind from the United States, able to cause sudden drops in temperature, can blow, especially in the center-north. Because of this wind, the northern inland areas (and a little less the northern coastal areas), during winter may experience cold waves, especially in hilly and mountainous areas.
In
summer, it is very hot in the central-northern inland areas, where there are deserts and the temperature can reach 45 °C (113 °F), while in the center and south there is tropical heat, at least at low altitudes.
Index
- The mild coast - Tijuana, Rosarito, Ensenada
- Deserts - Sonoran desert (Mexicali, Hermosillo), Chihuahuan Desert (Ciudad Juárez, Torréon, Saltillo)
- Eastern Plains - Nuevo Laredo, Matamoros, Tampico
- Tierras frias - Mexico City, Puebla
- Tierras templadas - Guadalajara, Oaxaca
- Tierras calientes - Veracruz, Yucatán, Acapulco, Cancún
- Mountains
- Hurricanes
- When to go
- What to pack
- Climate data
The mild coast
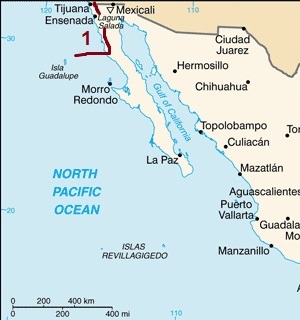
In the peninsula of Baja California, in practice a continuation of California, the climate is
very mild on the west coast, where daytime temperatures range from 19/20 degrees Celsius (66/68 °F) in winter to 24/25 °C (75/77 °F) in summer in the northern part. The sun shines throughout the year, and the rare rains fall from November to March. Rainfall totals around 200/250 millimeters (7.8/10 inches) per year.
Here too, as in California, a
cold current flows, which makes the sea cool and causes a bit of fog, but in return it provides a lot of sun, little rain and a pleasant climate. However, when the wind blows from the interior, the temperatures can suddenly increase, even surpassing 40 °C (104 °F).
A city that is located in this area is
Tijuana, just south of the border with the United States and a short distance from the greater San Diego area. At the airport, which is located 15 km (9 mi) away from the coast, the maximum temperatures in the warmest months, August and September, are 27 °C (80.5 °F).
The rainfall in Tijuana is scarce and amounts to 230 mm (9 in) per year. It follows the Mediterranean pattern, in fact it is concentrated in autumn and winter.
In this area, the sun shines all year round, although fog can sometimes form in spring and summer, especially in the morning.
The temperature of the sea in this part of the coast is very cool even in summer.
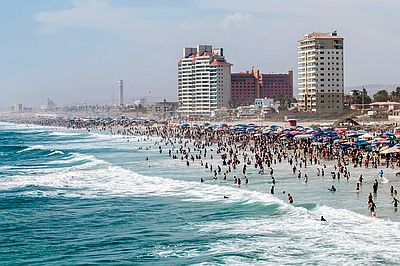
A little further south, in
Playas de Rosarito, temperatures are even milder, given that the city is located directly on the coast: the maximums go from around 20 °C (68 °F) in winter to 25 °C (77 °F) in summer.
South of Rosarito we find
Ensenada.
More to the south, the sea becomes progressively warmer. In the southern part of the state of Baja California, the sea temperature reaches 21/22 °C (70/72 °F) between August and October, while in the state of Baja California Sur, the sea is decidedly warmer.
East of the coast, in the mountain ranges of
Sierra Juárez and San Pedro Mártir, the winter temperature decreases with altitude, and there are frequent night frosts. On the contrary, owing to the distance from the sea (in which, as mentioned, a cool current flows), the summer is hot, although above 1,000 meters (3,300 feet), nights get cool.
The deserts
In the inland areas of north-central Mexico, but also in Baja California, in the northwest, there are
arid areas, semi-desert or desert.
Sonoran desert
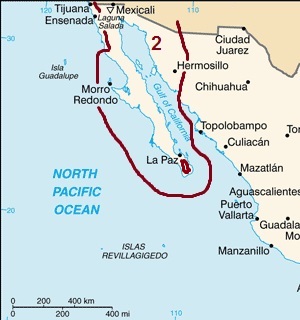
The Sonoran Desert, the westernmost of the Mexican deserts, is characterized by an increase in rainfall in the latter part of the summer, a kind of "
little monsoon" from July to mid-October, which may bring some thunderstorms and an increase in humidity. The central-southern part of Baja California (administratively divided in the states of
Baja California and
Baja California Sur) can be included in this area, although the climate is milder along the west coast than in interior and along the east coast overlooking the Gulf of California.
In fact, continuing south on the aforementioned
west coast, the temperature rises gradually, to the point that highs in Baja California Sur reach 20/22 °C (68/72 °F) in winter and 30 °C (86 °F) in summer in the northern part, and 25 °C (77 °F) in winter and 32 °C (90 °F) in summer in the far south (see
Todos Santos).
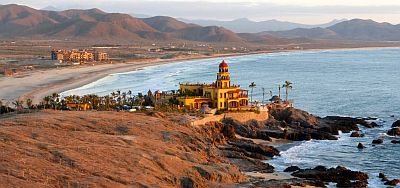
On the eastern side, the
Gulf of California (see
San Felipe) is not affected by the cold current, and being that it's a narrow and closed gulf, it becomes very hot in summer. Here, the daytime temperatures in summer are around 35/36 °C (95/97 °F), while in winter they are around 20 °C (68 °F) in the north, 22 °C (72 °F) in the center, and 25 °C (77 °F) in the south.
Baja California is a barren, almost desert peninsula: along the coasts, annual precipitation is around 100/150 mm (4/6 in). But in the hills of Baja California Sur, the little monsoon brings additional rainfall, so much so that rainfall exceeds 400 mm (16 in) per year. This area, known as
Sierra de la Laguna, is covered by woods (and therefore should be excluded from the desert area, as indicated by the small circle on the map).
In the little monsoon season, from late June to October, and with a maximum in September, Baja California Sur (more rarely Baja California) can be affected by
low pressure areas and tropical cyclones which form in the Pacific Ocean off the southern coast of Mexico. These disturbances, usually less intense than those that form in the Gulf of Mexico, can also penetrate the continent, affecting the northern part of the state of Sinaloa and the whole of the state of Sonora.
In the north-east of the state of Baja California, we find the
Yuma Desert, where the city of
Mexicali is located: it is an area of reclaimed lands and recent settlements, where the temperatures in summer reach extremely high values: the records are above 50 °C (122 °F)!
This is the hottest place in Mexico as well as one of the hottest places in the world. Rainfall is very low, below 100 mm (4 in) per year, and the increase between mid-summer and autumn is barely perceptible.
Southeast of this desert, we find the
Altar Desert, a sand desert whose appearance resembles the vast Saharan areas covered with dunes.
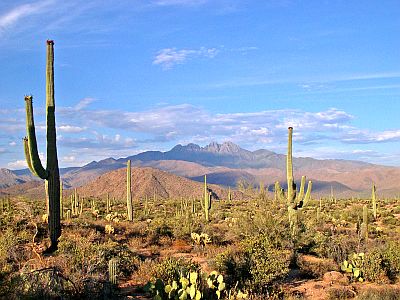
The western area of the state of Sonora is part of the Sonoran Desert itself, and as we said with regard to Baja California Sur, it experiences an increase in precipitation from July to October. The
wet winds from July to October lower a bit the temperature, to the point that the hottest month is often June, but they also raise relative humidity in the following months.
In this area, we find the important city of
Hermosillo, which has a dry winter, pleasantly warm during the day (even though nights can be cold), and a very hot summer, with average highs around 40 °C (104 °F) in June.
From July to October, the little monsoon brings some rains and thunderstorms, sometimes strong, which, however, do not last long, so that the sun will return after not long. The rainiest month is August, with 100 mm (4 in) on average. Relative humidity increases as well, going from 33% in June, to 55% in July, and to 51% in August and September, thus making the heat sweltering.
In Hermosillo the sun shines all year round, however, there is a slight decrease in the hours of sunshine from July to September.
Sierra Madre Occidental
The mountain range called
Sierra Madre Occidental, which separates the states of Sonora and Chihuahua, and continues south to the states of Sinaloa, Durango and Nayarit, experiences a period of monsoon rains quite long (mid-June to early October) and intense, so much so that precipitation exceeds 400 mm (16 in) per year (July is usually the rainiest month), so the climate of these mountains is
semi-arid rather than desert.
Above 1,000 meters (3,300 feet), rainfall is even higher, and it exceeds 700/800 mm (27/31 in), so the landscape is
green. In the southern part of the Sierra Madre Occidental, even winter is quite rainy, and rainfall exceeds 1,000 mm (40 in) per year.
Chihuahuan Desert
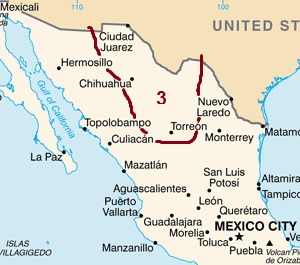
To the east of the Sierra Madre Occidental and to the west of the Sierra Madre Oriental, ie between the two ranges, we find the
Chihuahuan Desert, an area dominated by highlands, and located in the states of Chihuahua and Coahuila and in north-eastern Durango. Here the climate is characterized by a wide daily temperature range, and also by a humid period from mid-June to mid-October, when the sun frequently shines, but it alternates with rains and thunderstorms. Winter is sunny and dry, with possible night frosts. Summer is hot, but because of the
altitude, the summer heat is less intense than in the lower areas of the Sonoran Desert. However, sometimes the temperature can reach or exceed 40 °C (104 °F).
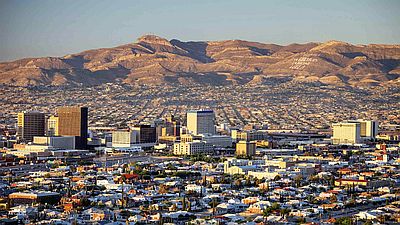
An important city of this region is
Ciudad Juárez, located in the far north, at 1,100 meters (3,600 feet) above sea level, on the border with Texas. Here, the daily average temperature ranges from 9 °C (48 °F) in January to 29 °C (84 °F) in July. During winter, cold spells can be intense especially in the north: in Ciudad Juárez, the temperature can drop below -15 °C (5 °F) in the worst moments.
Average annual precipitation in Juárez is 245 mm (9.7 in), with August as the rainiest month.
The sun shines all year round, but here too, as in the Sonoran desert, the sunniest month is June.
Other cities of the area are
Chihuahua,
Torréon and
Saltillo.
Eastern plains
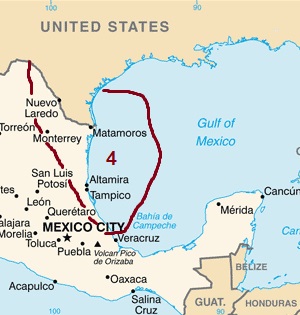
In the eastern area, overlooking the Gulf of Mexico (including the state of Tamaulipas, the east of Nuevo León, the south-east of San Luis Potosi, the north-east of Hidalgo, and the north of Puebla and Veracruz), along the coast, and in plains and hills below 500 meters (1,600 feet) of altitude,
winter is very mild, sometimes pleasantly warm, but we can not exclude some short cold spells, while summer is hot and humid. Annual rainfall generally ranges from 500 to 1,000 mm (20 to 40 in) and increases gradually from north to south and near the highlands, where it even exceeds 1,000 mm (40 in) per year. The rainy period goes from June to October.
Along the border with the United States, we find cities like Nuevo Laredo, Reynosa and Matamoros. To the west, we find
Monterrey, 500 meters (1,600 feet) above sea level and 280 km (175 mi) away from the coast.
Another city is
Tampico, located on the coast, which has an average of 19.5 °C (67 °F) in January and of 29 °C (84.3 °F) in August. Tampico receives 1,150 mm (45 in) of rain per year, including more than 100 mm (4 in) per month from June to October.
Near Tampico, the sea in the Gulf of Mexico is warm enough to swim in all year round, although in winter, the water temperature drops to 22.5 °C (72.5 °F).
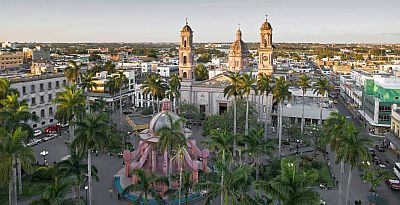
Let us now talk about
central and southern Mexico, where the difference between winter and summer decreases because of the low latitude, and the temperature varies mainly with altitude; in this area, we can distinguish among the
tierras calientes from sea level to 1,000 meters (3,300 feet), the
tierras templadas between 1,000 and 2,000 meters (3,300 and 6,600 feet), and the
tierras frías above 2,000 meters (6,600 feet).
Tierras frías
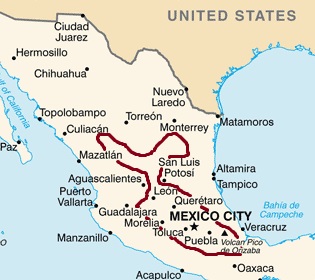
In the plateau of the the center-south above 1,800 meters (5,900 feet), there is a considerable
difference in temperature between day and night, especially in the dry season. The tropical sun's rays are very strong, even if the temperature is not so high. As for the
rains, there is a dry season from November to April and a rainy season from May to October.
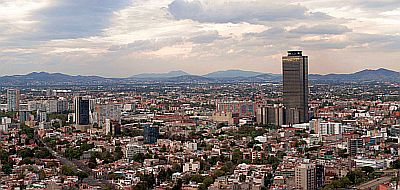
The huge federal capital,
Mexico City, is located in the southern part of the plateau, at an altitude of 2,200 meters (7,200 ft). The city is polluted, and it's wrapped in an almost constant haze.
Winter is dry and sunny, with cold nights. In January and February, lows are around 7/8 °C (45/46 °F), but sometimes they can drop a few degrees below freezing (0 °C or 32 °F), while days are pleasant, with highs around 22/24 °C (72/75 °F).
In
spring, the temperature rises gradually until April and May, which are the months with the highest daytime temperatures, around 27 °C (81 °F), while night-time temperatures are still pretty cool, around 11/12 °C (52/54 °F).
In June, owing to the summer monsoon, which brings
clouds and rains from June to September, the daytime temperature does not increase any further, in fact it drops by a few degrees, to around 24/25 °C (75/77 °F).
Rainfall amounts to 700 mm (28 in) per year, with a maximum in July and August.
To the southeast of Mexico City we find
Puebla, which has a similar climate.
Tierras templadas
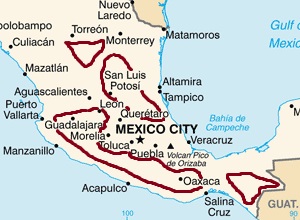
In the areas of south-central Mexico that are located at intermediate altitudes, the average temperatures are mild, although sometimes it can get cold on winter nights, while sometimes during the day it can get hot.
In this area, we can mention a city like
Guadalajara, at 1,500 meters (5,000 feet) above sea level, in the state of Jalisco. The average temperature ranges from 15.5 °C (60 °F) in January to 24 °C (75 °F) in June. Rainfall amounts to 970 mm (38 in) per year, with a long dry period, and a rainy season from June to early October.
In the southern highlands (see
Oaxaca), the temperature in winter is slightly higher and the rainy season is a bit longer.
Tierras calientes
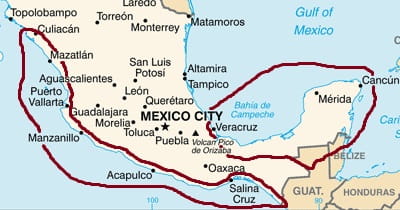
In the plains and hills of the south, in the so-called
Tierras calientes, the climate is
hot all year round, with a dry season (December to April or November to May, depending on area) and a rainy season (May to November or June to October). The warmest period is the one that precedes the rainy season, usually the months of April and May.
But later, with the arrival of the
rains, the humidity increases, and so does the feeling of sultriness. Usually, the rains occur in the form of thunderstorms, sometimes strong, in the afternoon.
The rains tend to become more abundant as you move south. In the interior of the southern states, precipitation exceeds 2,000 mm (80 in) per year, but in some cases it even exceeds 3,000 mm (120 in). The south of the state of Veracruz, the south-east of Oaxaca, the state of Tabasco and the northern part of Chiapas (see
Palenque, Yaxchilan) are very rainy areas: here there are moderate rains even in winter, and therefore there is no real dry season.
The hottest part in winter is the southern coast, exposed to the Pacific ocean, where we find cities such as
Manzanillo, Acapulco,
Puerto Escondido and
Salina Cruz.
In
Acapulco, along the coast of the state of Guerrero, the climate is hot all year round, but the dry season, from November to May, is sunny and it almost never rains.
The mountains located north of the city protect this coast from cold winds (while this does not happen on the coast on the Gulf of Mexico, see below). However, in the rainy season, from June to October, the rains are abundant and sometimes torrential.
The sea is always warm, not going below 28 °C (82 °F) in winter.
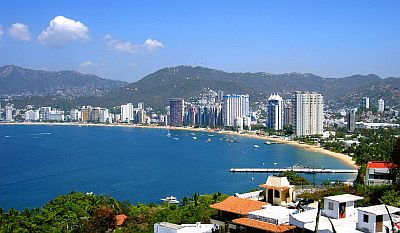
Here, and in general along the southern coast of Mexico, during the rainy season, tropical cyclones can form, called
cordonazos, which are able to cause gale force winds and heavy rains. Traditionally,
El cordonazo de San Francisco is a storm that occurs on October 4, i.e. the day of St. Francis.
Further north, in
Puerto Vallarta, in the state of Jalisco, the climate is similar to that of Acapulco, but winter nights are cooler, and they can occasionally get pretty cool, around 10 °C (50 °F); this can still happen, though more rarely, in March and April.
Yucatán
In the east, in the
Yucatán Peninsula (in the states of Campeche, Yucatán and Quintana Roo), the climate is generally warm to hot all year round, but winter is not as dry and sunny as on the south coast: the months of December and January, when highs are around 28/30 °C (82/86 °F), are quite rainy.
In addition, from December to March, sometimes the cold wind from the United States, the
Norte, can blow, and in these cases, the minimum temperature can drop to 10 °C (50 °F) or even below.
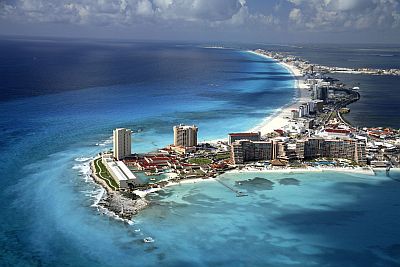
In
Cancún, on the north-eastern coast of the peninsula, daytime temperatures are around 28 °C (82 °F) in winter, from December to February.
In Cancun, the least rainy period runs from February to April, and the driest month is April, so it is an advisable destination for the Easter holidays, when the Norte is less likely to blow. The
rainy season runs from May to November and is a hot and sultry period. The rains are abundant especially in June, and between September and mid-November. However, the sun still shines quite often, in fact the rains generally occur in the form of downpours or thunderstorms, so they don't last long.
The Gulf of Mexico in Cancun and the Riviera Maya is warm enough to swim in all year round.
A similar situation is found in Isla Mujeres and the
Mayan Riviera south of Cancun (see
Puerto Morelos,
Playa del Carmen,
Cozumel,
Tulum,
Chetumal etc..): here, March and April are the driest and sunniest months, and April is the best month.
During the rainy season, the Yucatán and the coastal area bordering the Gulf of Mexico can be affected by
hurricanes, especially in the period from August to October; however, the hurricane season runs from June to November. Hurricanes come from the south or east, and sometimes can be destructive.
Mountains
In the high mountains and volcanoes of south-central Mexico, the climate is Alpine, although, given the low latitude, this happens at very high altitudes.
For example, on the
Nevado de Toluca volcano, southwest of Mexico City, at 4,300 meters (14,100 ft) above sea level, the monthly average temperature ranges from 2 °C (35.5 °F) in January to 5 °C (41 °F) in April and May, which are the warmest months.
The rainy season runs from May to October, and July and August are the rainiest months, but with these temperatures it can snow even in summer.
The three highest volcanoes of Mexico, Citlaltépetl, Popocatepetl and Iztaccihuatl, exceed 5,000 meters (16,400 ft), and at the highest elevations, perennial glaciers are found.
Hurricanes
As mentioned, Mexico may be affected by
tropical cyclones, either by those coming from the east, i.e. from the Caribbean Sea and the Gulf of Mexico, which affect the east coast and the Yucatán, and by those that are formed on the Pacific and affect the western and southern coasts. The hurricane season runs
from June to November, although they are more likely from August to October.
Cyclones can penetrate inland for many kilometers (or miles), even though they tend to weaken as they move away from the sea.
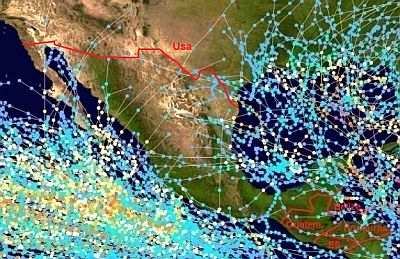
In this image, we can see the trajectories followed by the tropical cyclones that have affected Mexico from 1980 to 2005 (the dots refer to the eye of the cyclone, so the affected area is larger).
When to go
The best periods to explore the
northern regions of Mexico (coasts and deserts) are
spring and autumn, in March-April and September-October, and in particular, you can choose October.
In the
tierras frìas too,
spring and autumn are the best periods, even though the main purpose in this area is to avoid the summer rains; therefore, you can also avoid the month September, which is still a rainy month. You can go to the
tierras frìas in winter as well, bearing in mind that it can get cold at night.
You can go to the
tierras calientes from
December to February, to avoid both the heat and the rains of summer, and because in some areas the months of October and November are still very rainy. In spring, in April and May, the rains have not arrived yet, but the weather is usually hot.
As regards to the
sea, the southern coast (see Acapulco) is warm and sunny in winter (eg Christmas and New Year), with a warm sea, around 28 °C (82 °F), so it's recommended for a beach holiday. The good season in Acapulco is long, from November to April.
The coasts of the
Gulf of Mexico and Yucatán (see Veracruz, Cancun), do not have an ideal climate in winter, at least for a beach holiday: the sky is often cloudy, sometimes it can rain, and the
Norte can bring a bit of cool weather.
Spring is a better season, from March to May, with a preference for April: in March, sometimes a bit of cool air can still arrive, especially in the first half of the month, while in May it begins to get hot, with the first thunderstorms.
Spring is fine also in Cabo San Lucas and the southern part of
Baja California. On the northern coast of Baja California, where the air is mild even in summer, you can sunbathe, even though the water is quite cold.
What to pack
In
winter: for the Chihuahuan desert and the mountains, bring warm clothes, a jacket, a hat, gloves. For Baja California, the eastern plains and the
tierras templadas, bring clothes for spring and autumn. For Mexico City and the
tierras frìas, bring clothes for spring and autumn during the day, but also a warm jacket and a hat for the evening. For the highest mountains, bring warm clothes, such as a down jacket, gloves, a beanie.
For the
tierras calientes, light clothing, a sweatshirt for the evening in Yucatan and Riviera Maya. When going to the reef, you can bring snorkeling equipment, including water shoes or rubber-soled shoes.
In
summer: bring light clothing, sunglasses, sunscreen, a light raincoat. For the Chihuahuan Desert, add a sweatshirt for the evening. For Mexico City and the
tierras frìas, add a sweatshirt or sweater for the evening, a jacket and an umbrella. For the highest mountains, warm clothes, a warm jacket, a wind jacket, gloves, a hat, hiking shoes.
Climate data - Mexico
| Acapulco |
|---|
Acapulco, location on the map |
|---|
| Jan | Feb | Mar | Apr | May | Jun | Jul | Aug | Sep | Oct | Nov | Dec |
|---|
| Min temp. | 22 | 22 | 22 | 22 | 24 | 25 | 25 | 25 | 25 | 25 | 24 | 23 |
|---|
| Max temp. | 30 | 30 | 30 | 30 | 31 | 32 | 32 | 32 | 31 | 31 | 31 | 31 |
|---|
| Precip. | 15 | 5 | 0 | 5 | 25 | 265 | 245 | 295 | 310 | 140 | 20 | 10 |
|---|
| Prec. days | 1 | 0 | 0 | 0 | 3 | 12 | 12 | 14 | 14 | 8 | 2 | 1 |
|---|
| Humidity | 72% | 72% | 72% | 72% | 73% | 75% | 75% | 77% | 78% | 78% | 76% | 74% |
|---|
| Day length | 11 | 12 | 12 | 12 | 13 | 13 | 13 | 13 | 12 | 12 | 11 | 11 |
|---|
| Sun hours | 9 | 9 | 9 | 9 | 8 | 7 | 7 | 7 | 6 | 8 | 9 | 8 |
|---|
| Sea temp | 29 | 28 | 28 | 28 | 29 | 30 | 30 | 30 | 30 | 30 | 30 | 29 |
|---|
| Cabo San Lucas |
|---|
Cabo San Lucas, location on the map |
|---|
| Jan | Feb | Mar | Apr | May | Jun | Jul | Aug | Sep | Oct | Nov | Dec |
|---|
| Min temp. | 15 | 16 | 17 | 19 | 22 | 25 | 27 | 26 | 25 | 23 | 19 | 16 |
|---|
| Max temp. | 26 | 27 | 28 | 30 | 32 | 33 | 34 | 34 | 33 | 33 | 30 | 26 |
|---|
| Precip. | 10 | 5 | 0 | 0 | 0 | 0 | 15 | 50 | 80 | 30 | 10 | 15 |
|---|
| Prec. days | 1 | 0 | 0 | 0 | 0 | 0 | 1 | 3 | 3 | 2 | 1 | 1 |
|---|
| Humidity | 52% | 49% | 45% | 42% | 41% | 46% | 52% | 59% | 65% | 58% | 57% | 56% |
|---|
| Day length | 11 | 11 | 12 | 13 | 13 | 14 | 13 | 13 | 12 | 12 | 11 | 11 |
|---|
| Sun hours | 7 | 8 | 8 | 8 | 9 | 8 | 7 | 7 | 7 | 8 | 8 | 7 |
|---|
| Sea temp | 23 | 22 | 22 | 22 | 23 | 24 | 27 | 29 | 29 | 28 | 27 | 25 |
|---|
| Cancun |
|---|
Cancun, location on the map |
|---|
| Jan | Feb | Mar | Apr | May | Jun | Jul | Aug | Sep | Oct | Nov | Dec |
|---|
| Min temp. | 19 | 19 | 20 | 22 | 24 | 25 | 24 | 24 | 24 | 23 | 21 | 20 |
|---|
| Max temp. | 28 | 28 | 29 | 30 | 32 | 32 | 33 | 33 | 32 | 31 | 29 | 28 |
|---|
| Precip. | 65 | 55 | 35 | 40 | 110 | 185 | 130 | 150 | 225 | 185 | 85 | 80 |
|---|
| Prec. days | 6 | 5 | 3 | 3 | 7 | 12 | 12 | 13 | 14 | 13 | 7 | 7 |
|---|
| Humidity | 78% | 77% | 74% | 74% | 75% | 79% | 78% | 79% | 82% | 82% | 80% | 79% |
|---|
| Day length | 11 | 12 | 12 | 13 | 13 | 13 | 13 | 13 | 12 | 12 | 11 | 11 |
|---|
| Sun hours | 7 | 7 | 8 | 8 | 8 | 8 | 8 | 8 | 7 | 7 | 7 | 7 |
|---|
| Sea temp | 26 | 26 | 26 | 27 | 28 | 28 | 29 | 29 | 29 | 29 | 28 | 27 |
|---|
| Ciudad Juárez (1,150 meters) |
|---|
Ciudad Juárez, location on the map |
|---|
| Jan | Feb | Mar | Apr | May | Jun | Jul | Aug | Sep | Oct | Nov | Dec |
|---|
| Min temp. | 1 | 4 | 7 | 11 | 17 | 21 | 22 | 21 | 18 | 11 | 4 | 2 |
|---|
| Max temp. | 16 | 19 | 23 | 27 | 32 | 37 | 36 | 35 | 32 | 27 | 21 | 16 |
|---|
| Precip. | 10 | 10 | 5 | 5 | 10 | 25 | 40 | 50 | 40 | 15 | 10 | 20 |
|---|
| Prec. days | 4 | 3 | 2 | 2 | 3 | 4 | 8 | 9 | 6 | 5 | 3 | 4 |
|---|
|
| Day length | 10 | 11 | 12 | 13 | 14 | 14 | 14 | 13 | 12 | 11 | 10 | 10 |
|---|
| Sun hours | 8 | 9 | 11 | 12 | 12 | 13 | 12 | 11 | 10 | 10 | 9 | 8 |
|---|
|
| Guadalajara (1,550 meters) |
|---|
Guadalajara, location on the map |
|---|
| Jan | Feb | Mar | Apr | May | Jun | Jul | Aug | Sep | Oct | Nov | Dec |
|---|
| Min temp. | 6 | 8 | 9 | 11 | 14 | 16 | 16 | 16 | 16 | 14 | 9 | 7 |
|---|
| Max temp. | 25 | 27 | 30 | 32 | 33 | 31 | 28 | 28 | 28 | 28 | 26 | 25 |
|---|
| Precip. | 20 | 5 | 5 | 5 | 20 | 185 | 275 | 220 | 165 | 50 | 15 | 10 |
|---|
| Prec. days | 2 | 1 | 1 | 1 | 3 | 14 | 21 | 19 | 15 | 6 | 2 | 2 |
|---|
| Humidity | 56% | 50% | 46% | 42% | 46% | 63% | 73% | 75% | 75% | 68% | 61% | 60% |
|---|
| Day length | 11 | 12 | 12 | 13 | 13 | 13 | 13 | 13 | 12 | 12 | 11 | 11 |
|---|
| Sun hours | 7 | 8 | 8 | 9 | 9 | 7 | 6 | 7 | 6 | 7 | 8 | 6 |
|---|
|
| Hermosillo (200 meters) |
|---|
Hermosillo, location on the map |
|---|
| Jan | Feb | Mar | Apr | May | Jun | Jul | Aug | Sep | Oct | Nov | Dec |
|---|
| Min temp. | 8 | 10 | 12 | 15 | 19 | 24 | 27 | 27 | 25 | 19 | 13 | 8 |
|---|
| Max temp. | 26 | 27 | 31 | 33 | 37 | 41 | 40 | 39 | 38 | 35 | 30 | 25 |
|---|
| Precip. | 15 | 15 | 5 | 5 | 5 | 10 | 100 | 100 | 70 | 20 | 15 | 30 |
|---|
| Prec. days | 3 | 2 | 1 | 1 | 0 | 1 | 10 | 9 | 6 | 2 | 2 | 3 |
|---|
| Humidity | 43% | 41% | 33% | 28% | 26% | 30% | 45% | 52% | 52% | 42% | 40% | 46% |
|---|
| Day length | 10 | 11 | 12 | 13 | 14 | 14 | 14 | 13 | 12 | 11 | 11 | 10 |
|---|
| Sun hours | 6 | 6 | 7 | 8 | 10 | 9 | 9 | 9 | 8 | 8 | 7 | 6 |
|---|
|
| Mexicali |
|---|
Mexicali, location on the map |
|---|
| Jan | Feb | Mar | Apr | May | Jun | Jul | Aug | Sep | Oct | Nov | Dec |
|---|
| Min temp. | 7 | 9 | 12 | 14 | 18 | 22 | 26 | 27 | 24 | 17 | 11 | 7 |
|---|
| Max temp. | 21 | 23 | 27 | 30 | 35 | 40 | 41 | 41 | 39 | 33 | 26 | 20 |
|---|
| Precip. | 10 | 10 | 10 | 0 | 0 | 0 | 5 | 10 | 10 | 10 | 5 | 15 |
|---|
| Prec. days | 2 | 2 | 2 | 1 | 0 | 0 | 1 | 2 | 1 | 1 | 1 | 2 |
|---|
| Humidity | 51% | 49% | 43% | 38% | 35% | 32% | 39% | 41% | 39% | 39% | 43% | 51% |
|---|
| Day length | 10 | 11 | 12 | 13 | 14 | 14 | 14 | 13 | 12 | 11 | 10 | 10 |
|---|
| Sun hours | 9 | 10 | 11 | 12 | 12 | 13 | 12 | 12 | 11 | 10 | 9 | 9 |
|---|
|
| Mexico City (2,250 meters) |
|---|
Mexico City, location on the map |
|---|
| Jan | Feb | Mar | Apr | May | Jun | Jul | Aug | Sep | Oct | Nov | Dec |
|---|
| Min temp. | 7 | 8 | 10 | 12 | 13 | 14 | 13 | 13 | 13 | 11 | 9 | 7 |
|---|
| Max temp. | 22 | 24 | 26 | 27 | 27 | 25 | 24 | 24 | 23 | 23 | 22 | 22 |
|---|
| Precip. | 10 | 5 | 10 | 25 | 55 | 110 | 160 | 150 | 120 | 45 | 15 | 5 |
|---|
| Prec. days | 1 | 2 | 3 | 4 | 11 | 13 | 17 | 17 | 15 | 7 | 2 | 2 |
|---|
| Humidity | 45% | 40% | 37% | 38% | 44% | 56% | 62% | 62% | 65% | 59% | 53% | 47% |
|---|
| Day length | 11 | 12 | 12 | 13 | 13 | 13 | 13 | 13 | 12 | 12 | 11 | 11 |
|---|
| Sun hours | 8 | 8 | 9 | 8 | 7 | 6 | 6 | 6 | 5 | 6 | 8 | 8 |
|---|
|
| Nevado de Toluca (4,300 meters) |
|---|
Nevado de Toluca, location on the map |
|---|
| Jan | Feb | Mar | Apr | May | Jun | Jul | Aug | Sep | Oct | Nov | Dec |
|---|
| Min temp. | -3 | -2 | -1 | 0 | 0 | 1 | 1 | 0 | 1 | 0 | -1 | -2 |
|---|
| Max temp. | 7 | 8 | 9 | 10 | 10 | 9 | 8 | 8 | 8 | 8 | 7 | 7 |
|---|
| Precip. | 15 | 15 | 15 | 60 | 115 | 205 | 240 | 230 | 210 | 90 | 25 | 15 |
|---|
| Prec. days | 3 | 3 | 3 | 7 | 14 | 20 | 25 | 23 | 21 | 13 | 5 | 3 |
|---|
|
|
|
|
| Puerto Vallarta |
|---|
Puerto Vallarta, location on the map |
|---|
| Jan | Feb | Mar | Apr | May | Jun | Jul | Aug | Sep | Oct | Nov | Dec |
|---|
| Min temp. | 17 | 17 | 17 | 19 | 22 | 25 | 25 | 25 | 25 | 24 | 21 | 18 |
|---|
| Max temp. | 27 | 27 | 27 | 28 | 30 | 31 | 32 | 32 | 32 | 32 | 30 | 28 |
|---|
| Precip. | 35 | 5 | 0 | 0 | 15 | 190 | 330 | 310 | 370 | 95 | 20 | 25 |
|---|
| Prec. days | 2 | 1 | 1 | 0 | 1 | 11 | 16 | 15 | 16 | 5 | 1 | 2 |
|---|
| Humidity | 77% | 77% | 75% | 75% | 75% | 77% | 78% | 80% | 81% | 78% | 76% | 77% |
|---|
| Day length | 11 | 12 | 12 | 13 | 13 | 13 | 13 | 13 | 12 | 12 | 11 | 11 |
|---|
| Sun hours | 8 | 8 | 9 | 9 | 9 | 8 | 6 | 7 | 6 | 7 | 8 | 7 |
|---|
| Sea temp | 25 | 24 | 24 | 25 | 26 | 28 | 29 | 30 | 30 | 30 | 28 | 26 |
|---|
| Tampico |
|---|
Tampico, location on the map |
|---|
| Jan | Feb | Mar | Apr | May | Jun | Jul | Aug | Sep | Oct | Nov | Dec |
|---|
| Min temp. | 16 | 17 | 20 | 22 | 25 | 26 | 25 | 26 | 25 | 23 | 20 | 17 |
|---|
| Max temp. | 23 | 24 | 27 | 29 | 31 | 32 | 32 | 32 | 31 | 30 | 27 | 24 |
|---|
| Precip. | 25 | 20 | 15 | 25 | 55 | 180 | 145 | 160 | 280 | 145 | 45 | 45 |
|---|
| Prec. days | 6 | 5 | 4 | 4 | 5 | 10 | 12 | 12 | 15 | 10 | 7 | 7 |
|---|
| Humidity | 78% | 77% | 76% | 76% | 76% | 75% | 76% | 75% | 77% | 75% | 76% | 76% |
|---|
| Day length | 11 | 11 | 12 | 13 | 13 | 14 | 13 | 13 | 12 | 12 | 11 | 11 |
|---|
| Sun hours | 4 | 5 | 6 | 6 | 7 | 8 | 7 | 8 | 6 | 6 | 5 | 4 |
|---|
| Sea temp | 23 | 22 | 23 | 25 | 27 | 28 | 29 | 29 | 29 | 28 | 26 | 24 |
|---|
| Tijuana |
|---|
Tijuana, location on the map |
|---|
| Jan | Feb | Mar | Apr | May | Jun | Jul | Aug | Sep | Oct | Nov | Dec |
|---|
| Min temp. | 9 | 9 | 10 | 12 | 14 | 15 | 17 | 18 | 17 | 15 | 11 | 9 |
|---|
| Max temp. | 20 | 19 | 20 | 21 | 22 | 24 | 26 | 27 | 27 | 25 | 22 | 19 |
|---|
| Precip. | 45 | 35 | 45 | 20 | 5 | 0 | 0 | 0 | 5 | 10 | 35 | 35 |
|---|
| Prec. days | 6 | 5 | 6 | 3 | 1 | 1 | 0 | 0 | 1 | 2 | 4 | 4 |
|---|
| Humidity | 64% | 67% | 70% | 68% | 71% | 72% | 73% | 72% | 71% | 65% | 62% | 63% |
|---|
| Day length | 10 | 11 | 12 | 13 | 14 | 14 | 14 | 13 | 12 | 11 | 10 | 10 |
|---|
| Sun hours | 7 | 8 | 8 | 8 | 8 | 8 | 10 | 9 | 9 | 8 | 8 | 8 |
|---|
| Sea temp | 15 | 15 | 15 | 16 | 17 | 18 | 20 | 20 | 20 | 19 | 18 | 16 |
|---|
| Torreon (1,150 meters) |
|---|
Torreon, location on the map |
|---|
| Jan | Feb | Mar | Apr | May | Jun | Jul | Aug | Sep | Oct | Nov | Dec |
|---|
| Min temp. | 7 | 9 | 12 | 16 | 19 | 21 | 20 | 20 | 19 | 15 | 10 | 7 |
|---|
| Max temp. | 22 | 25 | 26 | 32 | 35 | 35 | 34 | 34 | 32 | 30 | 26 | 23 |
|---|
| Precip. | 20 | 5 | 5 | 15 | 20 | 35 | 25 | 25 | 20 | 10 | 10 | 15 |
|---|
| Prec. days | 3 | 1 | 1 | 2 | 3 | 4 | 6 | 5 | 5 | 3 | 2 | 2 |
|---|
|
|
| Sun hours | 6 | 6 | 7 | 8 | 9 | 10 | 9 | 9 | 7 | 8 | 7 | 6 |
|---|
|
See also the
temperatures month by month