Select units of measurement for the temperature and rainfall tables (metric or imperial).
Average weather, temperature, rainfall, sunshine
In Guatemala, a Central American country extended from 13 to 18 degrees north latitude, there is a
tropical climate, hot all year round in the lowlands, while in mountainous areas, it becomes cooler with increasing altitude.
In almost all of Guatemala, there is a
dry season from late November to mid-April, when the northeast trade winds blow, and a rainy season from May to October.
Geographically, the country is divided into
three zones: in the north, there's an area almost entirely occupied by plains (departments of Petén, north of Alta Verapaz, and Izabal), with a short stretch of coastline on the Gulf of Honduras (Caribbean Sea); in the center, there's a large mountainous area, where the capital is also located; and finally, in the south, we find a thin flat strip south of the mountains, overlooking the Pacific Ocean.
From December to March, Guatemala can be reached by
cool air masses from the United States, and in these cases, the temperature at night can drop below 10 °C (50 °F) in Guatemala City, and around 13/15 °C (55/59 °F) in the plains.
The climate in detail
North
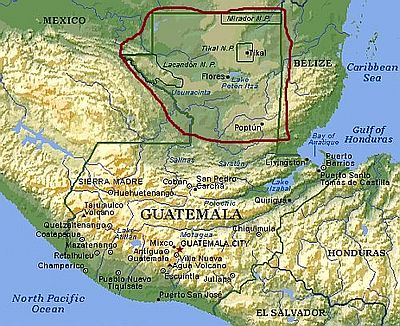
Flores
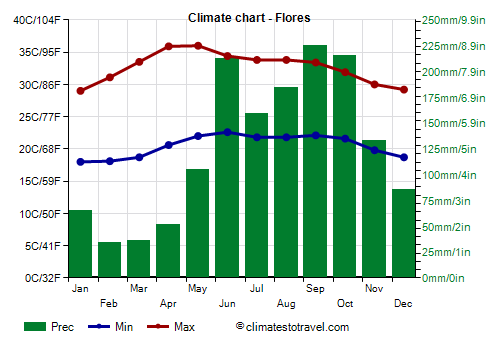
In the north, in Flores, the capital of the Petén Department, highs in December and January are around 28 °C (82.5 °F), but sometimes, cool air from the north can lower the night temperature to 10/12 °C (50/54 °F).
In February, the temperature rises and a
very hot period begins.
From March to May, the temperature can reach 40 °C (104 °F).
From June to October, the temperature drops a bit, but the heat becomes definitely sultry, as happens in all the lowland areas of Guatemala in the rainy period.
In Flores, rainfall amounts to 1,500 mm (59 in) per year. The driest period is from February to April.
In this area, we find the Mayan site of
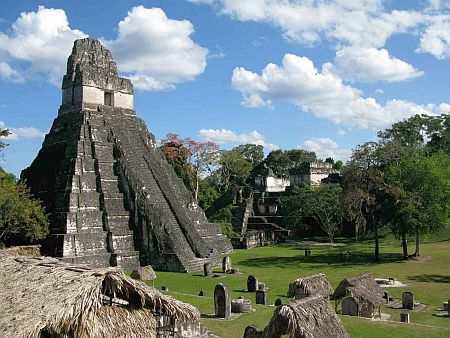
Tikal, surrounded by the forest (the National Park of the same name is a UNESCO World Heritage Site). Here, the best period is from February to April; in December, and partly also in January, it still rains quite a lot. It is also true that December and January are not as hot as the period from March to May, when there can be uncomfortably hot days.
Center-north
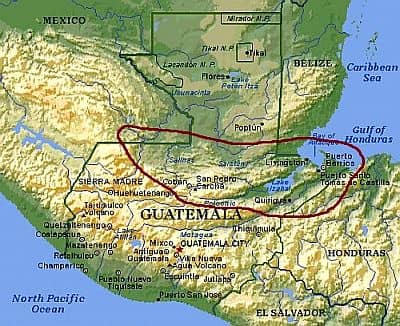
In north-central Guatemala, north of the mountains and near the Gulf of Honduras, unlike in the rest of the country,
it rains all year round; in fact, in winter, the trade winds reach the coast after picking up moisture from the sea, or they are forced to rise when they encounter the first mountain slopes.
Owing to the abundance of rainfall, the climate here can be defined as
equatorial, and in fact, the area is occupied by a rainforest.
Although the rainfall still amounts to about 100 millimeters (4 inches) per month, the best period here is
from February to April, since it goes better than in the rest of the year.
Puerto Barrios
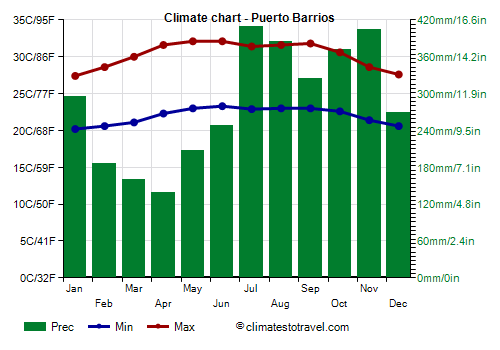
In Puerto Barrios, located in the short coastal stretch of the Caribbean Sea, between Belize and Honduras, the average temperature ranges from 23.5 °C (74.5 °F) in January to around 28 °C (82 °F) from May to August.
In winter, especially in January, there can sometimes be short, slightly cool periods, with highs of 22-23 °C (72-73 °F). In January 2009 and 2018, the night minimum dropped to 14 °C (57 °F). From March to May, on the hottest days of the year, the temperature generally reaches 35/36 °C (95/97 °F).
Rainfall is very abundant and amounts to 3,400 mm (134 in) per year. The least rainy period is from February to April, when it drops below 200 mm (8 in) per month.
The Caribbean Sea is warm enough for swimming all year round.
Hills and mountains
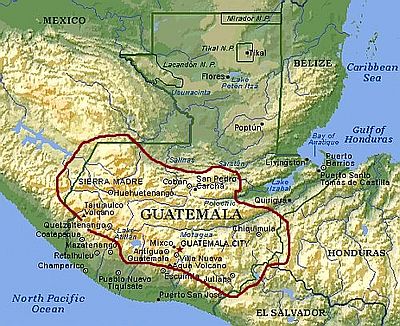
In the central area of Guatemala, occupied by mountains and plateaus, there is a
dry season from December to April, as happens in the south, while the temperatures vary with altitude.
During the rainy season, the rains are usually plentiful, but there are also some
sheltered slopes which experience only moderate rains.
Guatemala City
The capital, Guatemala City, is located in the so-called
tierras templadas, 1,500 meters (5,000 feet) above sea level, and has a
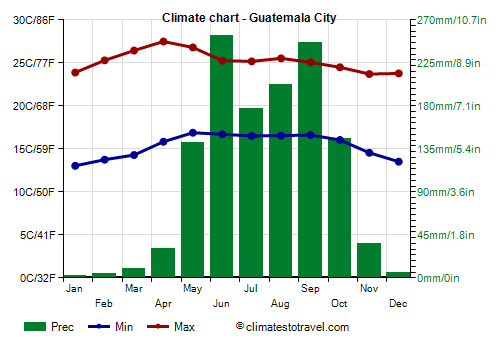
spring-like climate all year round: the average daytime temperatures range from 24 °C (75 °F) from November to January, to 27.5 °C (81.5 °F) in April.
The temperature is rarely too hot, even though it may reach or exceed 30 °C (86 °F) from March to May, before the rains. In May 1998, it reached 33.5 °C (92 °F).
From the end of November to March, cool air from the north can lower the temperature up to 7/8 °C (45/46 °F). The city is also quite windy.
Here too, the rainy season runs from May to October, with frequent and abundant rains from June to September, while from December to mid-April, it rains very rarely.
Although the tropical rains occur mainly in the form of heavy showers and downpours, the amount of
sunshine in the rainy season is not very good, since cloudiness usually begins to develop in the warmest hours. Here are the sunshine hours per day in Guatemala City.
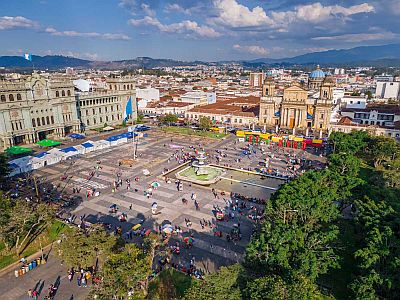
Nearby, at an altitude of 1,545 meters (5,070 feet), is the city of Antigua Guatemala.
Quetzaltenango
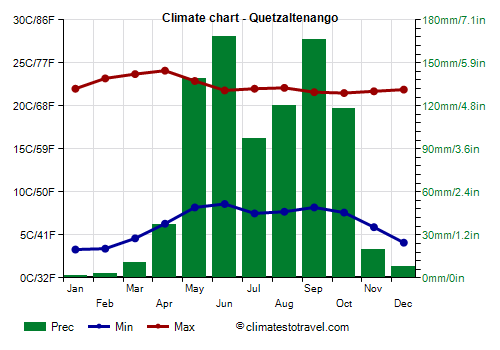
In
Quetzaltenango, located at 2,300 meters (7,500 ft) above sea level, and therefore in the
tierras frìas, the climate is cooler: the average temperature in January is only 13 °C (55.5 °F), with remarkable differences between night and day.
At night, the temperature can drop below freezing from November to April, and from December to February, it can drop to -5 °C (23 °F).
Here too, the warmest days occur from March to May, when the temperature generally reaches 26/27 °C (79/81 °F), but can sometimes reach 29/30 °C (84/86 °F). From April to September, the daily average is 16/17 °C (61/63 °F).
Here too, there is a pronounced rainy season, but the rainfall amounts to just 900 millimeters (35 inches) per year. This happens because the city is located in a valley between the mountains to the north, which reach 3,200 meters (10,500 feet), and the chain of mountains and volcanoes to the south. However, rainfall exceeds 90 mm (3.5 in) per month between May and October.
In Guatemala, there are as many as 37
volcanoes, the highest of which is
Volcán Tajumulco, which stands out with its 4,220 meters (13,845 feet) and is also the highest peak in Central America. Above 3,500 meters (11,500 ft), at night, it can freeze throughout the year.
South
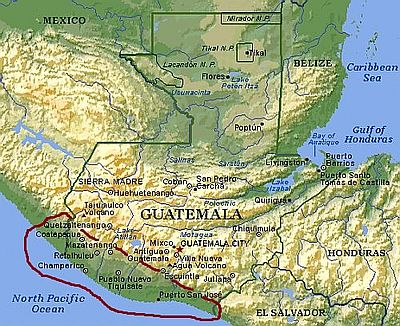
In the south, in the plain and along the Pacific coast, there is
intense heat throughout the year, since in winter, the trade winds warm up as they descend on the leeward side of the mountains.
In the south, the
dry season from late November to mid-April is very evident. From May to October, the rains are more abundant in the area at the foot of the volcanoes: in Mazatenango they amount to 2,500 mm (100 in) per year.
Puerto San José
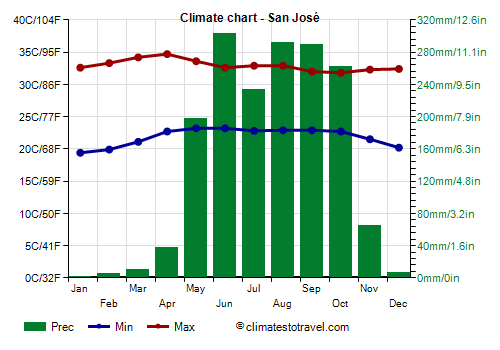
In
Puerto San José, on the south coast, the winter is hot, with highs around 32/33 degrees Celsius (90/91 °F), but sometimes even above; on the positive side, it's sunny and not too humid. In March and April, before the rains, the hottest days occur, with peaks of 36/37 °C (97/99 °F).
In Puerto San José, 1,600 mm (67 in) of rain fall per year, but from December to April it rains very rarely.
The Pacific Ocean too is warm enough to swim in all year round as well: the water temperature is between 27 °C (81 °F) in winter and 30 °C (86 °F) in summer.
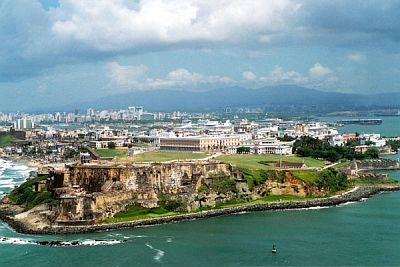
Hurricanes
Guatemala is located in the path of tropical storms and
hurricanes, which may affect the country in the period from June to November, however, they are most likely from August to October.
Usually, they come from the east, from the Caribbean Sea, but sometimes, tropical depressions can also form on the Pacific Ocean, which can especially affect the western part of the country, as early as in mid-May.
Generally, the country is hit less intensively than Honduras; however, tropical storms and cyclones can cause heavy rains, which can trigger landslides and floods.
Some hurricanes that hit the country in the past were Francelia in early September 1969, Fifi in mid-September 1974, Mitch in late October 1998, Keith in early October 2000, Iris in early October 2001, Felix in early September 2007, and Earl in early August 2016.
When to go
The best time to visit Guatemala runs from
December to mid-April on the central plateau and on the southern side, and corresponds only to the period from
February to April along the Caribbean coast and in the Petén Department.
What to pack
In Guatemala City and the
tierras templadas: all year round, bring light clothing, a sweatshirt or sweater and a jacket for the evening; a raincoat or umbrella from May to October.
In
plains and coasts: bring lightweight clothes throughout the year; in the rainy season, a light sweatshirt and a light raincoat for thunderstorms.
When going to the reef, you can bring snorkeling equipment, including water shoes or rubber-soled shoes.
On
high mountains: warm clothes, a jacket, a hat, gloves, and hiking shoes.
Climate data - Guatemala
| Flores |
|---|
|
| Jan | Feb | Mar | Apr | May | Jun | Jul | Aug | Sep | Oct | Nov | Dec |
|---|
| Min temp. | 18 | 18 | 19 | 21 | 22 | 23 | 22 | 22 | 22 | 22 | 20 | 19 |
|---|
| Max temp. | 29 | 31 | 34 | 36 | 36 | 34 | 34 | 34 | 33 | 32 | 30 | 29 |
|---|
| Precip. | 65 | 35 | 35 | 50 | 105 | 215 | 160 | 185 | 225 | 215 | 135 | 85 |
|---|
| Prec. days | 8 | 4 | 4 | 4 | 8 | 15 | 15 | 16 | 17 | 15 | 11 | 9 |
|---|
|
|
| Sun hours | 7 | 8 | 8 | 8 | 8 | 7 | 7 | 8 | 6 | 6 | 6 | 6 |
|---|
|
| Guatemala City (1,500 meters) |
|---|
|
| Jan | Feb | Mar | Apr | May | Jun | Jul | Aug | Sep | Oct | Nov | Dec |
|---|
| Min temp. | 13 | 14 | 14 | 16 | 17 | 17 | 17 | 17 | 17 | 16 | 15 | 14 |
|---|
| Max temp. | 24 | 25 | 26 | 27 | 27 | 25 | 25 | 26 | 25 | 24 | 24 | 24 |
|---|
| Precip. | 5 | 5 | 10 | 30 | 140 | 255 | 180 | 200 | 245 | 145 | 35 | 5 |
|---|
| Prec. days | 1 | 1 | 1 | 4 | 10 | 18 | 14 | 15 | 18 | 12 | 4 | 1 |
|---|
|
|
| Sun hours | 8 | 8 | 8 | 8 | 6 | 5 | 6 | 6 | 5 | 6 | 7 | 7 |
|---|
|
| Puerto Barrios |
|---|
|
| Jan | Feb | Mar | Apr | May | Jun | Jul | Aug | Sep | Oct | Nov | Dec |
|---|
| Min temp. | 20 | 21 | 21 | 22 | 23 | 23 | 23 | 23 | 23 | 23 | 21 | 21 |
|---|
| Max temp. | 27 | 29 | 30 | 32 | 32 | 32 | 31 | 32 | 32 | 31 | 29 | 28 |
|---|
| Precip. | 295 | 185 | 160 | 140 | 210 | 250 | 410 | 385 | 325 | 370 | 405 | 270 |
|---|
| Prec. days | 15 | 12 | 11 | 8 | 12 | 16 | 22 | 20 | 17 | 17 | 17 | 16 |
|---|
|
|
| Sun hours | 6 | 6 | 7 | 8 | 8 | 8 | 8 | 8 | 7 | 6 | 6 | 6 |
|---|
| Sea temp | 27 | 27 | 28 | 28 | 29 | 29 | 29 | 30 | 30 | 29 | 29 | 28 |
|---|
| Quetzaltenango (2,380 meters) |
|---|
|
| Jan | Feb | Mar | Apr | May | Jun | Jul | Aug | Sep | Oct | Nov | Dec |
|---|
| Min temp. | 3 | 3 | 5 | 6 | 8 | 9 | 8 | 8 | 8 | 8 | 6 | 4 |
|---|
| Max temp. | 22 | 23 | 24 | 24 | 23 | 22 | 22 | 22 | 22 | 22 | 22 | 22 |
|---|
| Precip. | 0 | 5 | 10 | 35 | 140 | 170 | 95 | 120 | 165 | 120 | 20 | 10 |
|---|
| Prec. days | 0 | 1 | 2 | 4 | 13 | 18 | 14 | 14 | 19 | 12 | 3 | 1 |
|---|
|
|
| Sun hours | 8 | 9 | 8 | 7 | 5 | 5 | 6 | 6 | 5 | 5 | 7 | 7 |
|---|
|
| San José |
|---|
|
| Jan | Feb | Mar | Apr | May | Jun | Jul | Aug | Sep | Oct | Nov | Dec |
|---|
| Min temp. | 19 | 20 | 21 | 23 | 23 | 23 | 23 | 23 | 23 | 23 | 22 | 20 |
|---|
| Max temp. | 33 | 33 | 34 | 35 | 34 | 33 | 33 | 33 | 32 | 32 | 32 | 32 |
|---|
| Precip. | 0 | 5 | 10 | 40 | 195 | 305 | 235 | 290 | 290 | 260 | 65 | 5 |
|---|
| Prec. days | 0 | 0 | 1 | 3 | 10 | 15 | 13 | 15 | 15 | 13 | 4 | 0 |
|---|
|
|
|
| Sea temp | 27 | 27 | 28 | 29 | 30 | 30 | 30 | 30 | 29 | 29 | 29 | 28 |
|---|
See also the
temperatures month by month