Select units of measurement for the temperature and rainfall tables (metric or imperial).
Average weather, temperature, rainfall, sunshine hours

The climate of Puerto Morelos is
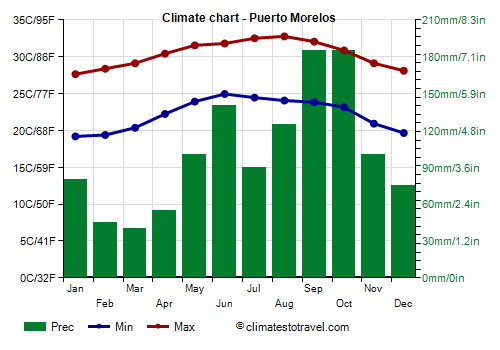
tropical, hot all year round, with a muggy, rainy season from May to October and a cooler, relatively dry season from November to April. However, also in the latter season, rainfall may occur, in addition to wind and cloudiness, especially in December and January.
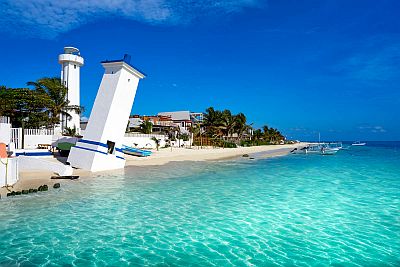
The city is located on the Yucatan coast, 30 km (18 mi) south of Cancún.
Winter is typically warm, but sometimes, from mid-November to mid-March, there can be cool and windy days, when the wind from the United States (
el norte) blows. The temperature can drop to 10/12 °C (50/54 °F) at night, and it can remain around 20/22 °C (68/72 °F) during the day.
From June to November (but with a higher probability from August to October), there is the risk of
hurricanes.
The
average temperature of the coldest month (January) is of 23.5 °C (74.3 °F), that of the hottest period (from June to August) is 28.5 °C (83.5 °F). Here are the average temperatures.
Puerto Morelos - Average temperatures (1991-2020) |
| Month | Min | Max | Mean |
|---|
| January | 19.2 | 27.6 | 23.4 |
|---|
| February | 19.4 | 28.4 | 23.9 |
|---|
| March | 20.4 | 29.1 | 24.7 |
|---|
| April | 22.2 | 30.4 | 26.3 |
|---|
| May | 23.9 | 31.6 | 27.7 |
|---|
| June | 25 | 31.8 | 28.4 |
|---|
| July | 24.5 | 32.5 | 28.5 |
|---|
| August | 24.1 | 32.8 | 28.4 |
|---|
| September | 23.8 | 32 | 27.9 |
|---|
| October | 23.2 | 30.9 | 27 |
|---|
| November | 20.9 | 29.1 | 25 |
|---|
| December | 19.7 | 28.1 | 23.9 |
|---|
| Year | 22.2 | 30.4 | 26.25 |
|---|
amounts to 1,220 millimeters (48 inches) per year: it is therefore quite abundant. It ranges from 40 mm (1.6 in) in the driest month (March) to 185 mm (7.3 in) in the wettest ones (September, October). Here is the average precipitation.
Puerto Morelos - Average precipitation| Month | Days |
|---|
| January | 80 | 6 |
|---|
| February | 45 | 4 |
|---|
| March | 40 | 3 |
|---|
| April | 55 | 3 |
|---|
| May | 100 | 5 |
|---|
| June | 140 | 9 |
|---|
| July | 90 | 8 |
|---|
| August | 125 | 10 |
|---|
| September | 185 | 13 |
|---|
| October | 185 | 12 |
|---|
| November | 100 | 9 |
|---|
| December | 75 | 7 |
|---|
| Year | 1220 | 89 |
|---|
The
sea temperature ranges between 26 °C (79 °F) and 29 °C (84 °F). It is therefore high enough for swimming all year round. Here are the average sea temperatures.
Puerto Morelos - Sea temperature| Month |
|---|
| January | 26 |
|---|
| February | 26 |
|---|
| March | 26 |
|---|
| April | 26.5 |
|---|
| May | 27.5 |
|---|
| June | 28 |
|---|
| July | 28.5 |
|---|
| August | 29 |
|---|
| September | 29 |
|---|
| October | 28.5 |
|---|
| November | 27.5"> |
|---|
| December | 27 |
|---|
| Year | 27.5 |
|---|

Best Time
The
best time to visit Puerto Morelos runs from mid-March to late May, since it is a warm period, relatively dry and with frequent sunshine. In April, a bit of sultriness begins to be felt, and in May, the first thunderstorms can occur. In winter, from December to mid-March, you may very well find a warm and sunny week, but at other times, there may be a few days with wind, clouds and some rain. Until March, when the
Norte can blow, it can be cool at night, so it's better to bring a sweatshirt for the evening.