Select units of measurement for the temperature and rainfall tables (metric or imperial).
Average weather, temperature, rainfall, sunshine hours

The climate of Chetumal is
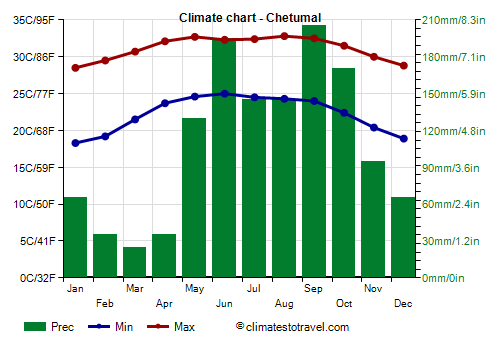
tropical, hot all year round, with a muggy, rainy season from May to October and a cooler, relatively dry season from November to April. However, also in the latter season, rainfall may occur, in addition to wind and cloudiness, especially in December and January.
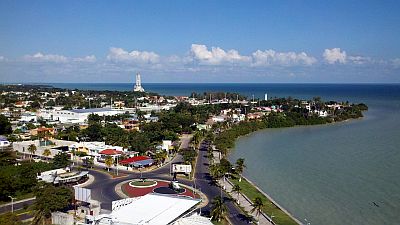
The city is the capital of the state of Quintana Roo and is located in the bay of the same name.
Winter is typically warm, but sometimes, from mid-November to mid-March, there can be cool and windy days, when the wind from the United States (
el norte) blows. The temperature can drop to 10/12 °C (50/54 °F) at night, and it can remain around 20/22 °C (68/72 °F) during the day.
From June to November (but with a higher probability from August to October), there is the risk of
hurricanes.

Best Time
The
best time to visit Chetumal runs from mid-March to late May, since it is a warm period, relatively dry and with frequent sunshine. In April, a bit of sultriness begins to be felt, and in May, the first thunderstorms can occur. In winter, from December to mid-March, you may very well find a warm and sunny week, but at other times, there may be a few days with wind, clouds and some rain. Until March, when the
Norte can blow, it can be cool at night, so it's better to bring a sweatshirt for the evening.
Chetumal - Climate data
In Chetumal, the
average temperature of the coldest month (January) is of
23.4 °C, that of the warmest month (May) is of
28.6 °C. Here are the average temperatures.
Chetumal - Average temperatures (1951-2010) |
| Month | Min | Max | Mean |
|---|
| January | 18.3 | 28.5 | 23.4 |
|---|
| February | 19.2 | 29.5 | 24.4 |
|---|
| March | 21.5 | 30.7 | 26.1 |
|---|
| April | 23.7 | 32.1 | 27.9 |
|---|
| May | 24.6 | 32.7 | 28.6 |
|---|
| June | 25 | 32.3 | 28.6 |
|---|
| July | 24.5 | 32.4 | 28.4 |
|---|
| August | 24.3 | 32.8 | 28.6 |
|---|
| September | 24 | 32.5 | 28.2 |
|---|
| October | 22.4 | 31.5 | 27 |
|---|
| November | 20.4 | 30 | 25.2 |
|---|
| December | 18.9 | 28.8 | 23.8 |
|---|
| Year | 22.2 | 31.2 | 26.65 |
|---|
amounts to
1310 millimeters per year: it is therefore quite abundant. It ranges from
25 millimeters in the driest month (March) to
205 millimeters in the wettest one (September). Here is the average precipitation.
Chetumal - Average precipitation| Month | Days |
|---|
| January | 65 | 9 |
|---|
| February | 35 | 6 |
|---|
| March | 25 | 4 |
|---|
| April | 35 | 4 |
|---|
| May | 130 | 8 |
|---|
| June | 195 | 14 |
|---|
| July | 145 | 14 |
|---|
| August | 145 | 14 |
|---|
| September | 205 | 16 |
|---|
| October | 170 | 14 |
|---|
| November | 95 | 11 |
|---|
| December | 65 | 10 |
|---|
| Year | 1310 | 123 |
|---|
The
sea temperature ranges from
26.5 °C in February to
29.5 °C in September. Here are the average sea temperatures.
Chetumal - Sea temperature| Month |
|---|
| January | 27 |
|---|
| February | 26.5 |
|---|
| March | 27 |
|---|
| April | 27.5 |
|---|
| May | 28.5 |
|---|
| June | 29 |
|---|
| July | 29 |
|---|
| August | 29 |
|---|
| September | 29.5 |
|---|
| October | 29 |
|---|
| November | 28.5"> |
|---|
| December | 27.5 |
|---|
| Year | 28.1 |
|---|
There are on average around 2765
sunshine hours per year. Here are the average hours of sunshine per day.
Chetumal - Sunshine hours| Month | Average | Total |
|---|
| January | 7 | 210 |
|---|
| February | 8 | 235 |
|---|
| March | 8.5 | 260 |
|---|
| April | 9 | 270 |
|---|
| May | 9 | 275 |
|---|
| June | 7.5 | 220 |
|---|
| July | 7.5 | 225 |
|---|
| August | 7.5 | 235 |
|---|
| September | 7 | 205 |
|---|
| October | 7 | 220 |
|---|
| November | 7 | 205 |
|---|
| December | 6.5 | 205 |
|---|
| Year | 7.6 | 2765 |
|---|