Select units of measurement for the temperature and rainfall tables (metric or imperial).
Average weather, temperature, rainfall, sunshine hours

The climate of Palenque is
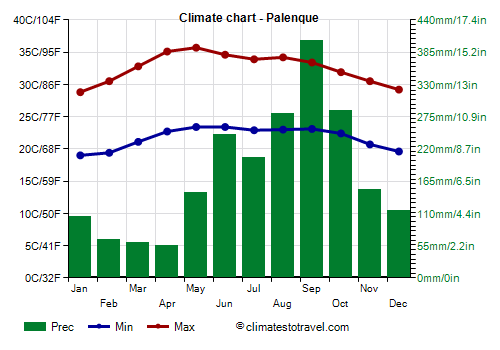
tropical, hot all year round, with a rainy and muggy season from June to October, a relatively cool season from November to February, and a very hot season from March to May, when the highest temperatures of the year are reached, with peaks of more than 40 °C (104 °F).
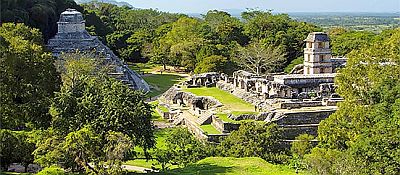
The city is located near the famous Mayan archaeological site, in southeastern Mexico, and in the state of Chiapas. Given the abundance of the rains and the length of the rainy season, the area is covered with forests. In fact, there is no real dry season, although the rains from March to May become quite rare. In some years, it can rain a lot even in the driest period.
On the coldest days of the year, generally in December or January, the night temperature can drop to 12/13 °C (54/55 °F).
From June to November (but with a higher probability from August to October), there is the risk of
hurricanes.
The
average temperature of the coldest month (January) is of 23.9 °C (75 °F), that of the warmest month (May) is of 29.6 °C (85 °F). Here are the average temperatures.
Palenque - Average temperatures|
| Month | Min | Max | Mean |
|---|
| January | 19 | 28.8 | 23.9 |
|---|
| February | 19.4 | 30.5 | 25 |
|---|
| March | 21.1 | 32.8 | 27 |
|---|
| April | 22.7 | 35.1 | 28.9 |
|---|
| May | 23.4 | 35.7 | 29.6 |
|---|
| June | 23.4 | 34.6 | 29 |
|---|
| July | 22.9 | 33.9 | 28.4 |
|---|
| August | 23 | 34.2 | 28.6 |
|---|
| September | 23.1 | 33.4 | 28.2 |
|---|
| October | 22.4 | 31.9 | 27.2 |
|---|
| November | 20.7 | 30.5 | 25.6 |
|---|
| December | 19.6 | 29.2 | 24.4 |
|---|
| Year | 21.7 | 32.6 | 27.1 |
|---|
amounts to 2,115 millimeters (83.3 inches) per year: it is therefore abundant. It ranges from 55 mm (2.2 in) in the driest month (April) to 405 mm (15.9 in) in the wettest (September). Here is the average precipitation.
Palenque - Average precipitation| Month | Days |
|---|
| January | 105 | 10 |
|---|
| February | 65 | 6 |
|---|
| March | 60 | 5 |
|---|
| April | 55 | 4 |
|---|
| May | 145 | 8 |
|---|
| June | 245 | 14 |
|---|
| July | 205 | 14 |
|---|
| August | 280 | 16 |
|---|
| September | 405 | 19 |
|---|
| October | 285 | 15 |
|---|
| November | 150 | 10 |
|---|
| December | 115 | 9 |
|---|
| Year | 2115 | 130 |
|---|
On average, there are around 2,425
sunshine hours per year. Here are the average sunshine hours per day.
Palenque - Sunshine hours| Month | Average | Total |
|---|
| January | 6.5 | 210 |
|---|
| February | 8 | 220 |
|---|
| March | 7.5 | 230 |
|---|
| April | 7 | 205 |
|---|
| May | 7 | 210 |
|---|
| June | 6 | 175 |
|---|
| July | 6.5 | 200 |
|---|
| August | 7 | 210 |
|---|
| September | 5.5 | 160 |
|---|
| October | 6.5 | 195 |
|---|
| November | 7 | 205 |
|---|
| December | 6.5 | 200 |
|---|
| Year | 6.7 | 2425 |
|---|

Best Time
The best time to visit Palenque is from December to February, since it is a relatively dry and not too hot period.