Select units of measurement for the temperature and rainfall tables (metric or imperial).
Average weather, temperature, rainfall, sunshine hours

The climate of Ensenada is
arid sub-tropical, with very mild, relatively rainy winters and warm, sunny summers.
The city is located on the Pacific coast of Baja California, where a cold sea current flows, making the climate particularly mild and arid (as also happens in San Diego, which has a similar climate). The sun often shines even in winter.
Occasionally, from June to October, but with a higher probability in September, the city may be affected by the remnants of a hurricane coming from the Pacific to the west of Mexico. Typically, the main effects are heavy rainfall or scattered thunderstorms.
The
sea remains a little cold even in summer.

Best Time
Having a great climate, Ensenada can be visited all year round. However, from December to March, it can rain, and it can get a bit cold at night, especially in inland areas. In May and June, there may be morning mists. In summer, but especially in September and October, there can be very hot days, when the wind blows from the desert.
The best time to go to the beach is from July to October, when the sea is less cold.
Ensenada - Climate data
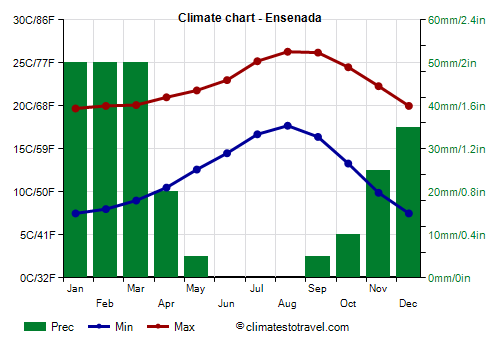
In Ensenada, the
average temperature of the coldest month (January) is of
13.6 °C, that of the warmest month (August) is of
22 °C. Here are the average temperatures.
Ensenada - Average temperatures (1951-2010) |
| Month | Min | Max | Mean |
|---|
| January | 7.5 | 19.7 | 13.6 |
|---|
| February | 8 | 20 | 14 |
|---|
| March | 9 | 20.1 | 14.6 |
|---|
| April | 10.5 | 21 | 15.8 |
|---|
| May | 12.6 | 21.8 | 17.2 |
|---|
| June | 14.5 | 23 | 18.8 |
|---|
| July | 16.7 | 25.2 | 21 |
|---|
| August | 17.7 | 26.3 | 22 |
|---|
| September | 16.4 | 26.2 | 21.3 |
|---|
| October | 13.3 | 24.5 | 18.9 |
|---|
| November | 9.9 | 22.3 | 16.1 |
|---|
| December | 7.5 | 20 | 13.8 |
|---|
| Year | 12 | 22.5 | 17.2 |
|---|
amounts to
260 millimeters per year: it is therefore scarce. It ranges from
0 millimeters in the driest months (June, July, August) to
50 millimeters in the wettest ones (January, February, March) Here is the average precipitation.
Ensenada - Average precipitation| Month | Days |
|---|
| January | 50 | 6 |
|---|
| February | 50 | 6 |
|---|
| March | 50 | 6 |
|---|
| April | 20 | 4 |
|---|
| May | 5 | 2 |
|---|
| June | 0 | 1 |
|---|
| July | 0 | 1 |
|---|
| August | 0 | 1 |
|---|
| September | 5 | 1 |
|---|
| October | 10 | 2 |
|---|
| November | 25 | 3 |
|---|
| December | 35 | 5 |
|---|
| Year | 260 | 37 |
|---|
The
sea temperature ranges from
15.5 °C in January, February to
21 °C in September. Here are the average sea temperatures.
Ensenada - Sea temperature| Month |
|---|
| January | 15.5 |
|---|
| February | 15.5 |
|---|
| March | 16 |
|---|
| April | 16.5 |
|---|
| May | 17.5 |
|---|
| June | 18.5 |
|---|
| July | 20 |
|---|
| August | 20.5 |
|---|
| September | 21 |
|---|
| October | 20 |
|---|
| November | 18"> |
|---|
| December | 16.5 |
|---|
| Year | 18 |
|---|