Select units of measurement for the temperature and rainfall tables (metric or imperial).
Average weather, temperature, rainfall, sunshine
In Jamaica, there is a
tropical climate, hot all year round, with a relatively cool season from December to March and a hot, muggy and rainy season from late April to October.
Jamaica is a Caribbean country located south of Cuba, at 18 degrees north latitude.
Rainfall mainly occurs in the form of downpours or thunderstorms. In almost all of Jamaica, except on the west coast (see Negril), in July there is a relative lull in precipitation, and in any case, there are two peaks in May and October, that is, at the beginning and the end of the period.
The rain pattern is also due to the north-east
trade winds, which are typical of the Tropics, and blow from November to March. Along the northern coast of Jamaica, rainfall ranges between 1,100 and 1,800 millimeters (43 and 70 inches) per year.
The southern coasts and plains are not as rainy as the northern slopes because they are sheltered from the trade winds, either by the Blue Mountains or by the hills of the west-central part of the country, in fact, the Pedro Plains receive about 800 mm (31.5 in) of rain per year.
Instead, the elevations receive a lot of rainfall and are covered with
forests (especially the Blue Mountains in the east and the southern part of the Trelawny Parish in the west).
From December to March, sometimes the island is affected by the
Norte, a cool wind from the United States, which, however, at this latitude does not lower the temperature too much; in fact, it can bring at most a bit of cool weather in the evening and at night.
The
sea in Jamaica is warm enough for swimming all year round, since it ranges from 27 °C (81 °F) in February and March to 29 °C (84 °F) between August and November.
The climate in detail
South coast
Kingston

In
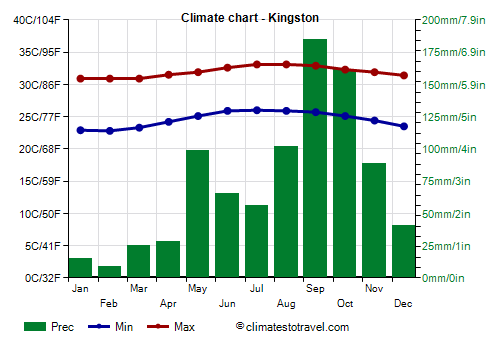
Kingston, the capital, located on the south coast, daytime temperatures reach 31 °C (88 °F) even in the coolest period, from January to March, while in the hottest period, from July to September, they reach 33 °C (91.5 °F).
As we said, being on the south coast, Kingston is not very rainy, in fact it receives 885 mm (35 in) of rain per year. However, in September and October the rainfall exceeds 150 mm (6 in) per month.
Kingston is a sunny city, as it receives around 3,000 hours of sunshine per year. Only in September and October, the rainiest months, there are around 7 and a half hours of sunshine per day, which is still quite a lot.
North coast
As mentioned, on the north coast, exposed to the northeast trade wind, the rainfall pattern is different. In fact, the rains are still abundant in the first months when the trade winds blow, that is, from November to January, when the sea retains the heat of the summer, although they gradually decrease.
Montego Bay

In
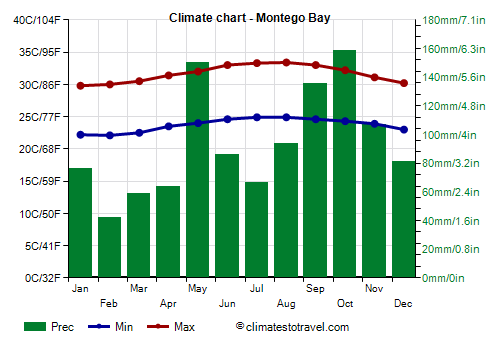
Montego Bay, located on the north coast, in the western part, 1,135 mm (45 in) of rain fall per year, of which 80 mm (3.1 in) in December and 75 mm (3 in) in January.
On the north coast, temperatures are slightly lower than on the south coast, at least in winter. In Montego Bay, highs from December to February are around 30 °C (86 °F).

Hurricanes
Like the rest of the Caribbean, in the period from June to November, Jamaica can be affected by
hurricanes, the tropical cyclones of the Atlantic Ocean, which, however, are more likely between August and October.
Some hurricanes that hit Jamaica in full force, causing great damage, were: the «Jamaica hurricane» of August 1903, Hurricane Charlie in August 1951, Ivan in September 2004, and Dennis in July 2005.
When to go
The best time to visit Jamaica as a whole, whether you intend to visit cities and go on excursions, or to swim and sunbathe, runs
from January to April. In fact, it is the driest and coolest period.
The least rainy months are February and March, while December is still quite rainy in the easternmost region and on the northern slopes of the Blue Mountains (otherwise, in the south December would be fine as well).
In
summer, and in general during the rainy season, the heat is sweltering and annoying, but the breeze blows and the sun shines for a few hours per day. In addition, in Kingston and on the southern coast, in July it usually does not rain much, so if you want to choose the summer, you can go in this month, also because the risk of hurricanes is lower than in August.
What to pack
From
November to April: bring light clothes, sun hat, sunscreen, but also a sweatshirt for the evening. For the mountains, bring a jacket and hiking boots.
From
May to October, bring tropics-friendly, lightweight clothing, and possibly a light sweatshirt and a light raincoat for thunderstorms. Sun hat and sunscreen can be useful too. For the mountains you can add a sweatshirt or sweater.
Climate data - Jamaica
| Kingston |
|---|
|
| Jan | Feb | Mar | Apr | May | Jun | Jul | Aug | Sep | Oct | Nov | Dec |
|---|
| Min temp. | 23 | 23 | 23 | 24 | 25 | 26 | 26 | 26 | 26 | 25 | 24 | 24 |
|---|
| Max temp. | 31 | 31 | 31 | 32 | 32 | 33 | 33 | 33 | 33 | 32 | 32 | 31 |
|---|
| Precip. | 15 | 10 | 25 | 30 | 100 | 65 | 55 | 100 | 185 | 160 | 90 | 40 |
|---|
| Prec. days | 5 | 5 | 5 | 7 | 8 | 7 | 6 | 9 | 11 | 14 | 10 | 6 |
|---|
|
|
| Sun hours | 8 | 9 | 9 | 9 | 8 | 8 | 8 | 8 | 8 | 7 | 8 | 8 |
|---|
| Sea temp | 27 | 27 | 27 | 28 | 28 | 28 | 29 | 29 | 29 | 29 | 29 | 28 |
|---|
| Montego Bay |
|---|
|
| Jan | Feb | Mar | Apr | May | Jun | Jul | Aug | Sep | Oct | Nov | Dec |
|---|
| Min temp. | 22 | 22 | 22 | 24 | 24 | 25 | 25 | 25 | 25 | 24 | 24 | 23 |
|---|
| Max temp. | 30 | 30 | 30 | 31 | 32 | 33 | 33 | 33 | 33 | 32 | 31 | 30 |
|---|
| Precip. | 75 | 40 | 60 | 65 | 150 | 85 | 65 | 95 | 135 | 160 | 105 | 80 |
|---|
| Prec. days | 9 | 8 | 5 | 7 | 12 | 10 | 7 | 10 | 12 | 13 | 11 | 9 |
|---|
|
|
| Sun hours | 8 | 9 | 9 | 9 | 8 | 8 | 9 | 8 | 7 | 7 | 8 | 7 |
|---|
|