Select units of measurement for the temperature and rainfall tables (metric or imperial).
Average weather, temperature, rainfall, sunshine hours

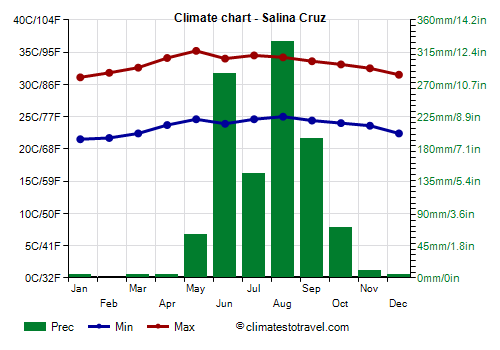
The climate of Salina Cruz is
tropical, hot all year round, with a dry period from December to April and a muggy, rainy period from June to October.
The city is located in the extreme south of Mexico, in the state of Oaxaca. Due to the low latitude (we are at the 16th parallel), the city is hot and sunny even in the middle of winter, however it is
windy, because the north wind is channeled between the mountains. Furthermore, the city is
particularly hot because the prevailing wind comes down from the hills to the north, producing a foehn-type effect.
From June to November (but with a higher probability from August to October), there is the risk of
hurricanes . However, they are generally not violent because we are just north of the area where they are formed, and therefore they are found in their early stages. However, occasionally they can bring heavy rain, as happened with tropical depression Hermine in September 2010.
The
average temperature of the coldest month (January) is of 26.3 °C (79 °F), that of the warmest month (May) is of 29.9 °C (86 °F). Here are the average temperatures.
Salina Cruz - Average temperatures (1981-2000) |
| Month | Min | Max | Mean |
|---|
| January | 21.5 | 31.1 | 26.3 |
|---|
| February | 21.7 | 31.8 | 26.8 |
|---|
| March | 22.4 | 32.6 | 27.5 |
|---|
| April | 23.7 | 34.1 | 28.9 |
|---|
| May | 24.6 | 35.2 | 29.9 |
|---|
| June | 23.9 | 34 | 29 |
|---|
| July | 24.6 | 34.5 | 29.6 |
|---|
| August | 25 | 34.2 | 29.6 |
|---|
| September | 24.4 | 33.6 | 29 |
|---|
| October | 24 | 33.1 | 28.6 |
|---|
| November | 23.6 | 32.5 | 28 |
|---|
| December | 22.4 | 31.5 | 27 |
|---|
| Year | 23.5 | 33.2 | 28.3 |
|---|
amounts to 1,120 millimeters (44.1 inches) per year: it is therefore quite abundant. It ranges from 0 mm (0 in) in the driest month (February) to 330 mm (13 in) in the wettest (August). Here is the average precipitation.
Salina Cruz - Average precipitation| Month | Days |
|---|
| January | 5 | 0 |
|---|
| February | 0 | 0 |
|---|
| March | 5 | 1 |
|---|
| April | 5 | 0 |
|---|
| May | 60 | 3 |
|---|
| June | 285 | 10 |
|---|
| July | 145 | 8 |
|---|
| August | 330 | 9 |
|---|
| September | 195 | 9 |
|---|
| October | 70 | 4 |
|---|
| November | 10 | 1 |
|---|
| December | 5 | 1 |
|---|
| Year | 1120 | 46 |
|---|
On average, there are around 2,670
sunshine hours per year. Here are the average sunshine hours per day.
Salina Cruz - Sunshine hours| Month | Average | Total |
|---|
| January | 8 | 250 |
|---|
| February | 9 | 255 |
|---|
| March | 9 | 280 |
|---|
| April | 7.5 | 230 |
|---|
| May | 7 | 215 |
|---|
| June | 5.5 | 160 |
|---|
| July | 6.5 | 195 |
|---|
| August | 7 | 215 |
|---|
| September | 5 | 155 |
|---|
| October | 7.5 | 225 |
|---|
| November | 8.5 | 250 |
|---|
| December | 7.5 | 240 |
|---|
| Year | 7.3 | 2675 |
|---|
The
sea temperature ranges between 26 °C (79 °F) and 30 °C (86 °F). It is therefore high enough for swimming all year round. Here are the average sea temperatures.
Salina Cruz - Sea temperature| Month |
|---|
| January | 26.5 |
|---|
| February | 26.5 |
|---|
| March | 27 |
|---|
| April | 28 |
|---|
| May | 29 |
|---|
| June | 29.5 |
|---|
| July | 29.5 |
|---|
| August | 30 |
|---|
| September | 29.5 |
|---|
| October | 29 |
|---|
| November | 28"> |
|---|
| December | 27 |
|---|
| Year | 28.3 |
|---|

Best Time
You can go to Salina Cruz from December to April, as it is a dry period and outside the hurricane season.