Select units of measurement for the temperature and rainfall tables (metric or imperial).
Average weather, temperature, rainfall, sunshine hours

The climate of Torreón is
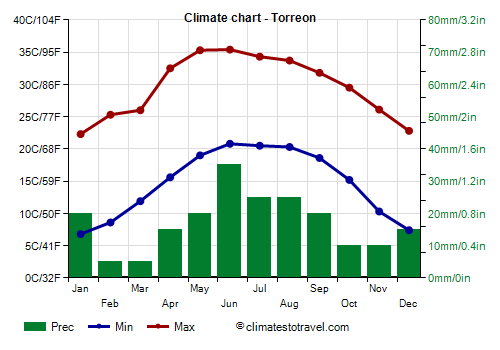
sub-tropical desert, with a very mild winter from December to February and a hot summer from April to September.
The city is located in north-central Mexico, at 25 degrees north latitude, in the state of Coahuila, at 1,150 meters (3,775 feet) above sea level.
We are in the Chihuahuan desert, characterized by cold nights in winter and some rains in summer. During the coldest winter nights of the year, the temperature can drop to 0 °C (32 °F), and occasionally even below. In 2011, it dropped to as low as -8 °C (17.5 °F).
On the hottest days of the year, which generally occur in May or June, the temperature can reach 43/44 °C (109/111 °F).
The
average temperature of the coldest month (January) is of 14.6 °C (58.2 °F), that of the warmest month (June) is of 28.1 °C (82.6 °F). Here are the average temperatures.
Torreon - Average temperatures (1951-2010) |
| Month | Min | Max | Mean |
|---|
| January | 6.8 | 22.3 | 14.6 |
|---|
| February | 8.6 | 25.3 | 17 |
|---|
| March | 11.9 | 26 | 19 |
|---|
| April | 15.6 | 32.5 | 24 |
|---|
| May | 19 | 35.3 | 27.2 |
|---|
| June | 20.8 | 35.4 | 28.1 |
|---|
| July | 20.5 | 34.3 | 27.4 |
|---|
| August | 20.3 | 33.7 | 27 |
|---|
| September | 18.6 | 31.8 | 25.2 |
|---|
| October | 15.2 | 29.5 | 22.4 |
|---|
| November | 10.3 | 26.1 | 18.2 |
|---|
| December | 7.4 | 22.8 | 15.1 |
|---|
| Year | 14.6 | 29.6 | 22.05 |
|---|
amounts to 205 millimeters (8.1 inches) per year: it is therefore scarce. It ranges from 5 mm (0.2 in) in the driest months (February, March) to 35 mm (1.4 in) in the wettest (June). Here is the average precipitation.
Torreon - Average precipitation| Month | Days |
|---|
| January | 20 | 3 |
|---|
| February | 5 | 1 |
|---|
| March | 5 | 1 |
|---|
| April | 15 | 2 |
|---|
| May | 20 | 3 |
|---|
| June | 35 | 4 |
|---|
| July | 25 | 6 |
|---|
| August | 25 | 5 |
|---|
| September | 20 | 5 |
|---|
| October | 10 | 3 |
|---|
| November | 10 | 2 |
|---|
| December | 15 | 2 |
|---|
| Year | 205 | 35 |
|---|
On average, there are around 2,770
sunshine hours per year. Here are the average sunshine hours per day.
Torreon - Sunshine hours| Month | Average | Total |
|---|
| January | 5.5 | 175 |
|---|
| February | 6.5 | 180 |
|---|
| March | 7.5 | 225 |
|---|
| April | 8 | 240 |
|---|
| May | 8.5 | 270 |
|---|
| June | 9.5 | 285 |
|---|
| July | 9.5 | 295 |
|---|
| August | 8.5 | 265 |
|---|
| September | 7 | 210 |
|---|
| October | 7.5 | 235 |
|---|
| November | 7 | 215 |
|---|
| December | 5.5 | 175 |
|---|
| Year | 7.6 | 2770 |
|---|

Best Time
The best time to visit Torreón is from November to March. Winter, from December to February, is generally a mild season, although it can sometimes get cold (especially in December and January). You can therefore choose the months of March and November.