Select units of measurement for the temperature and rainfall tables (metric or imperial).
Average weather, temperature, rainfall, sunshine hours

Playa del Carmen, the most popular resort of the Riviera Maya, located in the Mexican state of Quintana Roo, has a
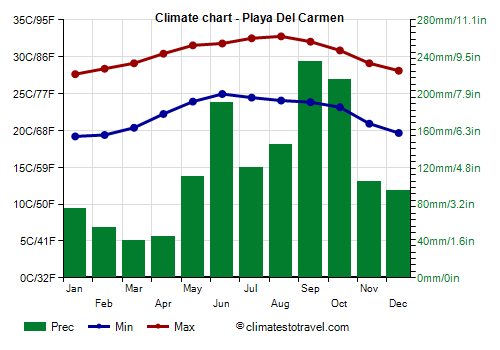
tropical climate, hot all year round, with a relatively cool, dry season from November to February and a hot, muggy and rainy season from June to October. From March to May, before the rainy season, the heat gradually increases.
Here are the average
temperatures.
Playa Del Carmen - Average temperatures (1991-2020) |
| Month | Min | Max | Mean |
|---|
| January | 19.2 | 27.6 | 23.4 |
|---|
| February | 19.4 | 28.4 | 23.9 |
|---|
| March | 20.4 | 29.1 | 24.7 |
|---|
| April | 22.2 | 30.4 | 26.3 |
|---|
| May | 23.9 | 31.6 | 27.7 |
|---|
| June | 25 | 31.8 | 28.4 |
|---|
| July | 24.5 | 32.5 | 28.5 |
|---|
| August | 24.1 | 32.8 | 28.4 |
|---|
| September | 23.8 | 32 | 27.9 |
|---|
| October | 23.2 | 30.9 | 27 |
|---|
| November | 20.9 | 29.1 | 25 |
|---|
| December | 19.7 | 28.1 | 23.9 |
|---|
| Year | 22.2 | 30.4 | 26.25 |
|---|
amounts to 1,400 millimeters (55 inches) per year. In the rainy season, there are two peaks in rainfall: at the beginning (June) and the end (September-October), while the rains diminish a bit in July and August, when they don't reach 150 mm (6 in) per month. In May, November and December, ie before and after the rainy season, there can be showers as well: those of May are due to the increase in temperature, which is already noticeable, while those of November-December are due to the fact that after the summer, the sea is still warm, so the northeast trade winds reach the coast after picking up heat and moisture from the sea. However, the rains fall in the form of downpours or thunderstorms, short and intense, which do not reduce the sunshine hours by much.
Here is the average precipitation.
Playa Del Carmen - Average precipitation| Month | Days |
|---|
| January | 75 | 6 |
|---|
| February | 55 | 5 |
|---|
| March | 40 | 3 |
|---|
| April | 45 | 3 |
|---|
| May | 110 | 7 |
|---|
| June | 190 | 12 |
|---|
| July | 120 | 12 |
|---|
| August | 145 | 13 |
|---|
| September | 235 | 15 |
|---|
| October | 215 | 13 |
|---|
| November | 105 | 7 |
|---|
| December | 95 | 7 |
|---|
| Year | 1430 | 103 |
|---|
Owing to the prevalence of easterly winds all year round (which are a bit cooler in the period from December to March and hotter and more humid from May to October), temperatures in the Riviera Maya do not vary significantly throughout the year, but the tourists who intend to go to the interior of
Yucatán, in search of Mayan archaeological sites, should know that in the period from March to May, that area is really hot.
During winter, from December to mid-March, Playa del Carmen, like the rest of the Riviera, can be reached by a cool wind from the northwest, the
Norte, preceded by clouds and some rain. On these occasions, the temperature can drop to 13/15 °C (55/59 °F) at night and remain around 20/22 °C (68/72 °F) during the day.
In the period from June to November, but especially from August to October, Playa del Carmen, like the rest of the Caribbean area, can be affected by
hurricanes, the tropical cyclones of the North Atlantic Ocean, which rarely affect a given place but are dangerous because they can bring strong winds and heavy rains.

The amount of
sunshine in Playa del Carmen is good from March to May, while it is only decent in the rest of the year. In fact, more or less widespread cloudiness can form, either in the rainy season (June to October) or in the first period of the trade winds (November-December), but also in the period of cold fronts from the United States (December to February, and sometimes the first half of March). Here are the average sunshine hours per day.
Playa Del Carmen - Sunshine hours| Month | Average | Total |
|---|
| January | 6.5 | 200 |
|---|
| February | 7 | 195 |
|---|
| March | 7.5 | 230 |
|---|
| April | 8.5 | 255 |
|---|
| May | 7.5 | 230 |
|---|
| June | 7 | 205 |
|---|
| July | 7 | 220 |
|---|
| August | 7 | 220 |
|---|
| September | 6 | 180 |
|---|
| October | 6 | 195 |
|---|
| November | 6 | 185 |
|---|
| December | 6 | 190 |
|---|
| Year | 6.9 | 2515 |
|---|
The
sea in Playa del Carmen is warm enough to swim in all year round, in fact, the water temperature ranges from 26 °C (79 °F) between January and March to 29 °C (84 °F) in August and September. Here are the average sea temperatures.
Playa Del Carmen - Sea temperature| Month |
|---|
| January | 26 |
|---|
| February | 26 |
|---|
| March | 26 |
|---|
| April | 26.5 |
|---|
| May | 27.5 |
|---|
| June | 28 |
|---|
| July | 28.5 |
|---|
| August | 29 |
|---|
| September | 29 |
|---|
| October | 28.5 |
|---|
| November | 27.5"> |
|---|
| December | 27 |
|---|
| Year | 27.5 |
|---|
Best Time
The
best time to go to Playa del Carmen for a beach holiday runs from mid-March to late May. Generally, you can go from December to May, but keep in mind that from December to mid-March, there can be cool, cloudy and windy days, so it's better to bring a sweatshirt for the evening, especially if you are sensitive to cold; maybe, you can take advantage of these cool days to organize a trip to the Mayan sites.
It should be recalled that in May, the first thunderstorms occur, and in April, and especially in May, heat and humidity increase.
November would be a good month, but there is still some risk of hurricanes, though low. In July and August, it's hot and humid, there are showers and thunderstorms, which, however, alternate with long periods of sunshine, but there is also some risk of tropical storms or hurricanes.