Select units of measurement for the temperature and rainfall tables (metric or imperial).
Average weather, temperature, rainfall, sunshine hours

The climate of Todos Santos is
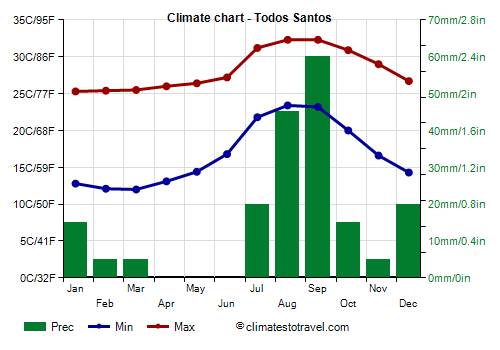
sub-tropical desert, with a mild to pleasantly warm period from December to May, and a sultry and relatively rainy summer from July to October.
The city is located on the southwestern coast of Baja California, in the state of Baja California Sur, on the Tropic of Cancer. We are on the Pacific coast, where a cold sea current flows, but it stops in the summer, so the summer is hot. However, a cool north-west wind blows for many months of the year.
From June to November, but with a higher probability from August to October, the Baja California peninsula can be affected by
hurricanes of the Pacific Ocean, as happened with Hurricane Odile in September 2014. However, hurricanes are rare in June, the month in which they are most frequent is September, and historically they have never occurred in November.
The
sea is pleasantly warm from July to November, while from January to May, it is a bit cool.

Best Time
Todos Santos can be visited from mid-November to May. In the evening you could need a sweater and a light jacket.
Todos Santos - Climate data
In Todos Santos, the
average temperature of the coldest months (February, March) is of
18.8 °C, that of the warmest month (August) is of
27.8 °C. Here are the average temperatures.
Todos Santos - Average temperatures|
| Month | Min | Max | Mean |
|---|
| January | 12.8 | 25.3 | 19 |
|---|
| February | 12.1 | 25.4 | 18.8 |
|---|
| March | 12 | 25.5 | 18.8 |
|---|
| April | 13.1 | 26 | 19.6 |
|---|
| May | 14.4 | 26.4 | 20.4 |
|---|
| June | 16.8 | 27.2 | 22 |
|---|
| July | 21.8 | 31.2 | 26.5 |
|---|
| August | 23.4 | 32.3 | 27.8 |
|---|
| September | 23.2 | 32.3 | 27.8 |
|---|
| October | 20 | 30.9 | 25.4 |
|---|
| November | 16.6 | 29 | 22.8 |
|---|
| December | 14.3 | 26.7 | 20.5 |
|---|
| Year | 16.7 | 28.2 | 22.4 |
|---|
amounts to
195 millimeters per year: it is therefore at a desert level. It ranges from
0 millimeters in the driest months (April, May, June) to
60 millimeters in the wettest one (September). Here is the average precipitation.
Todos Santos - Average precipitation| Month | Days |
|---|
| January | 15 | 2 |
|---|
| February | 5 | 1 |
|---|
| March | 5 | 0 |
|---|
| April | 0 | 0 |
|---|
| May | 0 | 0 |
|---|
| June | 0 | 0 |
|---|
| July | 20 | 2 |
|---|
| August | 45 | 3 |
|---|
| September | 60 | 5 |
|---|
| October | 15 | 2 |
|---|
| November | 5 | 1 |
|---|
| December | 20 | 2 |
|---|
| Year | 195 | 18 |
|---|
The
sea temperature ranges from
21 °C in February, March, April to
28.5 °C in September. Here are the average sea temperatures.
Todos Santos - Sea temperature| Month |
|---|
| January | 22 |
|---|
| February | 21 |
|---|
| March | 21 |
|---|
| April | 21 |
|---|
| May | 22 |
|---|
| June | 23.5 |
|---|
| July | 26 |
|---|
| August | 28 |
|---|
| September | 28.5 |
|---|
| October | 28 |
|---|
| November | 26"> |
|---|
| December | 24 |
|---|
| Year | 24.3 |
|---|
There are on average around 2870
sunshine hours per year. Here are the average hours of sunshine per day.
Todos Santos - Sunshine hours| Month | Average | Total |
|---|
| January | 7.5 | 230 |
|---|
| February | 8 | 230 |
|---|
| March | 8.5 | 255 |
|---|
| April | 8.5 | 255 |
|---|
| May | 9 | 280 |
|---|
| June | 8.5 | 260 |
|---|
| July | 7 | 215 |
|---|
| August | 7 | 220 |
|---|
| September | 7 | 215 |
|---|
| October | 8 | 255 |
|---|
| November | 8 | 245 |
|---|
| December | 7 | 220 |
|---|
| Year | 7.9 | 2870 |
|---|