Select units of measurement for the temperature and rainfall tables (metric or imperial).
Average weather, temperature, rainfall, sunshine
In Hawaii, an archipelago located in the Pacific Ocean, just south of the Tropic of Cancer, there is a
tropical climate, with a hot season from June to October (called
kau in the Hawaiian language) and a relatively cool season (
hooilo) from December to March.
The
trade winds, constant winds blowing from the north-east, strongly influence the climate of these islands, creating microclimates, wet or dry, depending on slope exposure.
The climate in detail
The coasts
Temperatures in Hawaii vary little throughout the year; they tend to be a bit lower on the windward slopes, and a little higher, but with lower humidity, on the leeward slopes. The temperatures vary little also when compared with the averages. This happens both because of the location at tropical latitudes and because of the enormous distance from the continents, from which cold or hot air masses could arrive. At sea level, the highest recorded temperatures are about 35 °C (95 °F), while the lowest are about 11 °C (52 °F).
Rainfall is influenced by the trade winds, so it varies according to slope orientation: you can move from a forest to a desert in a few kilometers (or miles), just by climbing over a hill.
In the following map, we can see a scheme of the situation, relative to the island of O'ahu: the trade winds bring rainfall on the exposed slopes and hot and dry weather on the leeward slopes. This situation also occurs on other islands where elevations are found in the interior, while flat islands such as Ni'ihau and Kaho'olawe are entirely arid.
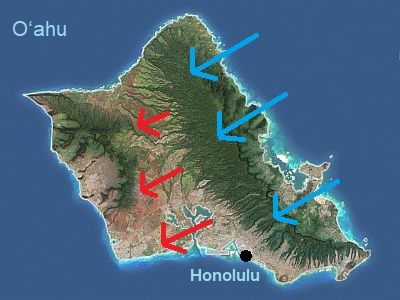 Trade winds on the island of O'ahu
Honolulu

In the capital,
Honolulu, located on the southern side of the island of O'ahu, the daytime temperature ranges from 27 °C (81 °F) between January and March to 30.5/31.5 °C (87/89 °F) between June and October. Being on the leeward side, where the trade winds create a sort of slight down-slope,
foehn-type effect, Honolulu is
one of the warmest places in Hawaii.
Rainfall on the
leeward side is generally lower than 1,000 mm (40 in) per year, with a minimum from May to September and a maximum from December to March: in practice,
it rains especially in winter, when the clash between air masses can produce wet currents from the southwest. In summer, rare downpours occur, when the strongest thunderstorms, produced by the trade winds on the other side, manage to pass over the mountain ridges.
At the Honolulu airport, located on the coast, only 415 mm (16.4 in) of rain fall per year, with a maximum from November to March and a minimum from April to September. However, the amount
varies according to the district: at the university, located near the green hills overlooking the city, it reaches 1,000 mm (40 in) per year, with more abundant rains from November to March, and some extra showers also in summer.
The amount of sunshine in Honolulu is never poor: it is acceptable from November to January and good or very good in the rest of the year, when the sun usually shines. In total there are 3,000 sunshine hours per year.
The
sea in Hawaii is warm enough to swim in all year round, even though it drops to 24/24.5 °C (75/76 °F) from February to April.
Hilo
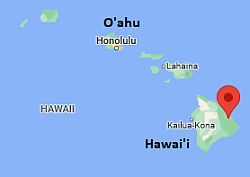 Hilo, where is located

On the
coasts exposed to the north-east, which directly receive the wind from the sea, the temperatures are a bit lower. In
Hilo, located at the foot of the windward side of the island of Hawai'i ("The Big Island"), highs are below 29 °C (84 °F) even in the hottest months.
In addition, on the northeast-facing slopes, it rains all year round, so we can speak of
equatorial climate. In Hilo, 3,050 millimeters (120 inches) of rain fall per year, without there being a dry month: May is the "driest" month with 180 mm (7.3 in) of rain, while the rainiest is November, with 365 mm (14.3 in).
Because of frequent clouds and rains, the sun does not shine very often on the windward side.
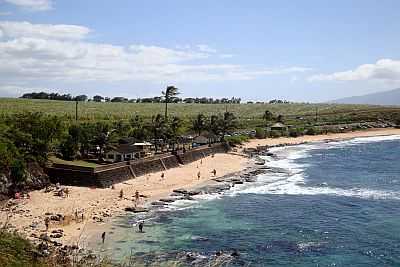 Hookipa Cove
On the coasts exposed to the wind,
higher waves are also formed, so surfers flock to beaches facing north, such as Sprecksville and Ho'okipa Beach on Maui Island.
The mountains
Hawaii are volcanic islands. The highest volcanoes are found on the island of Hawai'i, and are
Mauna Kea, 4,205 meters (13,796 feet) and
Mauna Loa, 4,169 meters (13,679 ft). On the island of Maui, we find
Haleakala (or East Maui Volcano), 3,055 meters (10,023 ft) high. On the other main islands, there are lower volcanoes.
Obviously, as the altitude increases, the climate becomes
gradually colder. Here too, precipitation is more abundant on the slopes exposed to the trade winds than on the leeward ones; moreover, they are more abundant at intermediate levels, since the trade winds only blow from sea level to about 1,800 meters (5,900 ft). So on the highest mountains, above a certain altitude, a
mountain desert is found, which becomes cold above 3,000 meters (9,800 ft).
Mauna Kea
At the
Mauna Kea Observatory, at 4,200 meters (13,800 feet) above sea level, the average temperature in the coldest months is around freezing; however, at night, it can drop below freezing all year round. Unfortunately, there are no reliable recent data, however, from 1977 to 1982, the average minimum in January and February was around -3 °C (27 °F), while coldest record was -11 °C (12 °F).
At this altitude, precipitation is very scarce: from 1972 to 1982 an average of just 190 mm (7.4 inches) per year was recorded, with a maximum of 25 mm (1 inch) in March and November. However, above 4,000 meters (13,000 ft), during some winters, you can see the snow on both Mauna Kea and Mauna Loa.
Mauna Loa

At the
Mauna Loa Observatory, located not in the summit but on the northern slope of the volcano of the same name, at 3,400 meters (11,100 ft) above sea level, the temperature is a bit higher, but still quite cold, especially in winter.
Precipitation amounts to 365 mm (14.4 in) per year, so it is quite scarce, but not at desert levels as on the summit.
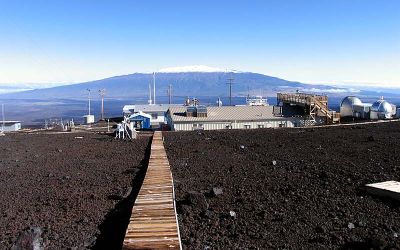 Mauna Loa Observatory
Haleakala

At lower elevations, around 2,000 meters (6,500 feet), in winter, the night temperature can sometimes drop below freezing (0 °C or 32 °F), while the air becomes mild during the day.
For example, at the Haleakala Ranger station, located at 2,120 metres (6,955 ft) above sea level on the aforementioned Mount
Haleakala, the average temperature ranges from 10.7 °C (51.2 °F) in February to 14.3 °C (57.7 °F) in August.
On average, 1,075 mm (42.3 in) of rain fall per year.
As we said before, on the windward slopes, it rains often at low altitudes, but at intermediate altitudes, it rains almost every day. For example, at the top of
Mount Wai'ale'ale, 1,500 meters (5,000 feet) above sea level, on the island of Kaua'i, 9,500 mm (374 in) of rain fall per year (according to other sources, the amount is as high as 11,500 mm or 453 in), which makes it one of the rainiest places in the world. The windward slopes of Mount
Haleakala are very rainy as well, so much so that rainfall exceeds 6,000 mm (235 in) per year.
Tropical cyclones
In theory, the Hawaiis are in the path of tropical cyclones, but as a matter of fact, they are
rarely affected by them.
The cyclone season runs from June to November, although the islands have historically almost never been affected before July; however, they are most likely in August and September. The most intense hurricanes in the islands' history have been Dot in August 1959, Iwa in November 1982, and Iniki in September 1992.
Since hurricanes
often weaken as they approach Hawaii, to the point that the effects they bring are usually not too serious, such as waves and wind, it has been assumed that they are protected by their very high volcanoes, which could disturb the spiral structure of cyclones.
When to go
The best time to visit Hawaii is from
May to October: the temperature is high, but the heat is usually bearable because of the trade winds. Tourist resorts are located on the leeward sides, however, it can be useful to recall that on the windward slopes, it often rains even in summer, and even cloudiness is more frequent. In the second part of the season,
hurricanes may occur, although Hawaii is almost always spared. However, if you want to play it safe, you can choose May and June.
The month of
April can also be taken into consideration. In the mountains it is colder than in the summer months, but at sea level it is not as hot and muggy as in summer.
In theory, you can go to Hawaii all year round, and therefore even in winter, ie from
December to March. However, in this period, temperatures are a bit lower, nights can be cool, rainfall is more abundant on the northern slopes and is fairly frequent also on the southern slopes, and even some short storms (i.e. intense waves of bad weather) may occur, but for the rest, the weather is fine and the sun shines in winter as well.
What to pack
In
winter (December to March): bring light clothes for the day, a scarf for the breeze, a sweatshirt and possibly a light jacket for the evening; a light raincoat or umbrella. When going to the reef, you can bring snorkeling equipment, including water shoes or rubber-soled shoes.
In mountainous areas, around 1,000 meters (3,300 feet): bring spring/autumn clothes, a sweater or jacket for the evening; around 2,000 meters (6,500 feet), a warm jacket and a hat for the evening; for the highest peaks (Mauna Kea and Mauna Loa), very warm clothes, such as a down jacket, gloves, a scarf, a hat, sunglasses, sunscreen, and hiking shoes.
In
summer (June to October): bring light clothes of natural fibers, a sun hat, a scarf for the breeze, a light sweatshirt for the evening and for air conditioning, and a light raincoat or umbrella for the windward slopes.
In mountainous areas, around 1,000 meters (3,300 feet), bring spring/autumn clothes (light for the day), a sweater and a light jacket for the evening; around 2,000 meters (6,500 feet), a sweater and a jacket for the evening. For the highest peaks (Mauna Kea and Mauna Loa), warm clothes, such as a down jacket, gloves, a scarf, a hat, sunglasses, sunscreen, and hiking shoes.
When going to the reef, you can bring snorkeling equipment, including water shoes or rubber-soled shoes.
Return to the climate of the
United States.
Climate data - Hawaii
| Haleakala (2,120 meters) |
|---|
|
| Jan | Feb | Mar | Apr | May | Jun | Jul | Aug | Sep | Oct | Nov | Dec |
|---|
| Min temp. | 7 | 6 | 6 | 7 | 8 | 9 | 9 | 10 | 9 | 9 | 8 | 7 |
|---|
| Max temp. | 16 | 15 | 15 | 16 | 17 | 19 | 19 | 19 | 18 | 18 | 17 | 16 |
|---|
| Precip. | 130 | 105 | 145 | 70 | 60 | 40 | 70 | 55 | 65 | 85 | 115 | 135 |
|---|
| Prec. days | 9 | 9 | 13 | 12 | 9 | 9 | 11 | 11 | 12 | 12 | 12 | 12 |
|---|
|
|
|
|
| Hilo |
|---|
|
| Jan | Feb | Mar | Apr | May | Jun | Jul | Aug | Sep | Oct | Nov | Dec |
|---|
| Min temp. | 18 | 18 | 18 | 19 | 20 | 20 | 21 | 21 | 21 | 21 | 20 | 19 |
|---|
| Max temp. | 26 | 26 | 26 | 26 | 27 | 28 | 28 | 28 | 28 | 28 | 27 | 26 |
|---|
| Precip. | 200 | 260 | 320 | 240 | 180 | 185 | 235 | 285 | 220 | 260 | 365 | 305 |
|---|
| Prec. days | 12 | 14 | 19 | 21 | 19 | 21 | 23 | 23 | 20 | 20 | 20 | 19 |
|---|
|
|
| Sun hours | 5 | 5 | 5 | 5 | 5 | 6 | 5 | 6 | 5 | 4 | 4 | 4 |
|---|
| Sea temp | 25 | 24 | 24 | 25 | 25 | 26 | 26 | 26 | 27 | 27 | 26 | 25 |
|---|
| Honolulu |
|---|
|
| Jan | Feb | Mar | Apr | May | Jun | Jul | Aug | Sep | Oct | Nov | Dec |
|---|
| Min temp. | 19 | 20 | 20 | 21 | 22 | 23 | 24 | 24 | 24 | 23 | 22 | 21 |
|---|
| Max temp. | 27 | 27 | 27 | 28 | 29 | 30 | 31 | 32 | 31 | 30 | 29 | 28 |
|---|
| Precip. | 45 | 50 | 60 | 20 | 20 | 15 | 15 | 20 | 20 | 40 | 55 | 55 |
|---|
| Prec. days | 5 | 5 | 5 | 4 | 3 | 2 | 3 | 2 | 4 | 4 | 5 | 5 |
|---|
| Humidity | 71% | 68% | 68% | 66% | 65% | 63% | 64% | 63% | 66% | 68% | 69% | 70% |
|---|
| Day length | 11 | 12 | 12 | 13 | 13 | 13 | 13 | 13 | 12 | 12 | 11 | 11 |
|---|
| Sun hours | 7 | 8 | 8 | 8 | 9 | 10 | 10 | 10 | 9 | 8 | 7 | 6 |
|---|
| Sea temp | 24 | 24 | 24 | 24 | 25 | 26 | 26 | 26 | 27 | 27 | 26 | 25 |
|---|
| Kailua-Kona |
|---|
|
| Jan | Feb | Mar | Apr | May | Jun | Jul | Aug | Sep | Oct | Nov | Dec |
|---|
| Min temp. | 20 | 20 | 21 | 22 | 22 | 23 | 24 | 24 | 24 | 23 | 22 | 21 |
|---|
| Max temp. | 28 | 28 | 28 | 29 | 29 | 30 | 30 | 31 | 31 | 30 | 29 | 28 |
|---|
| Precip. | 60 | 40 | 45 | 35 | 50 | 25 | 20 | 35 | 20 | 35 | 35 | 70 |
|---|
|
|
|
|
| Sea temp | 25 | 24 | 24 | 25 | 25 | 26 | 26 | 26 | 27 | 27 | 26 | 25 |
|---|
| Kaneohe |
|---|
|
| Jan | Feb | Mar | Apr | May | Jun | Jul | Aug | Sep | Oct | Nov | Dec |
|---|
| Min temp. | 20 | 20 | 21 | 22 | 22 | 23 | 24 | 24 | 24 | 24 | 22 | 21 |
|---|
| Max temp. | 26 | 26 | 26 | 26 | 27 | 28 | 29 | 29 | 29 | 28 | 27 | 26 |
|---|
| Precip. | 70 | 80 | 90 | 40 | 35 | 30 | 35 | 35 | 40 | 65 | 95 | 90 |
|---|
| Prec. days | 12 | 9 | 13 | 13 | 11 | 14 | 16 | 12 | 13 | 15 | 14 | 15 |
|---|
|
|
|
|
| Lanai City Airport (400 meters) |
|---|
|
| Jan | Feb | Mar | Apr | May | Jun | Jul | Aug | Sep | Oct | Nov | Dec |
|---|
| Min temp. | 17 | 17 | 17 | 18 | 19 | 19 | 20 | 20 | 20 | 20 | 19 | 18 |
|---|
| Max temp. | 25 | 25 | 25 | 26 | 27 | 27 | 28 | 28 | 28 | 28 | 27 | 26 |
|---|
|
|
|
|
|
| Lihue |
|---|
|
| Jan | Feb | Mar | Apr | May | Jun | Jul | Aug | Sep | Oct | Nov | Dec |
|---|
| Min temp. | 19 | 19 | 20 | 21 | 22 | 23 | 24 | 24 | 24 | 23 | 22 | 20 |
|---|
| Max temp. | 26 | 26 | 26 | 27 | 28 | 28 | 29 | 30 | 30 | 29 | 27 | 26 |
|---|
| Precip. | 70 | 90 | 140 | 50 | 55 | 45 | 45 | 60 | 55 | 85 | 100 | 120 |
|---|
| Prec. days | 12 | 12 | 15 | 16 | 14 | 18 | 19 | 18 | 16 | 17 | 18 | 18 |
|---|
|
|
| Sun hours | 6 | 6 | 7 | 7 | 8 | 8 | 8 | 8 | 8 | 7 | 5 | 5 |
|---|
| Sea temp | 24 | 24 | 24 | 24 | 25 | 26 | 26 | 27 | 27 | 27 | 26 | 25 |
|---|
| Mauna Kea (4,200 meters) |
|---|
|
| Jan | Feb | Mar | Apr | May | Jun | Jul | Aug | Sep | Oct | Nov | Dec |
|---|
| Min temp. | -3 | -3 | -4 | -3 | -2 | -1 | -1 | -1 | 0 | -1 | -2 | -2 |
|---|
| Max temp. | 6 | 6 | 5 | 5 | 9 | 10 | 10 | 10 | 10 | 7 | 7 | 6 |
|---|
| Precip. | 20 | 5 | 25 | 15 | 25 | 5 | 5 | 20 | 15 | 15 | 25 | 15 |
|---|
|
|
|
|
|
| Mauna Loa (3,400 meters) |
|---|
|
| Jan | Feb | Mar | Apr | May | Jun | Jul | Aug | Sep | Oct | Nov | Dec |
|---|
| Min temp. | 2 | 1 | 2 | 2 | 4 | 5 | 5 | 5 | 5 | 4 | 3 | 2 |
|---|
| Max temp. | 11 | 10 | 10 | 12 | 13 | 14 | 14 | 14 | 14 | 13 | 11 | 11 |
|---|
| Precip. | 30 | 25 | 50 | 20 | 15 | 10 | 30 | 60 | 15 | 35 | 30 | 35 |
|---|
| Prec. days | 2 | 4 | 5 | 3 | 3 | 2 | 3 | 5 | 4 | 3 | 3 | 4 |
|---|
|
|
|
|
See also the
temperatures month by month