Select units of measurement for the temperature and rainfall tables (metric or imperial).
Average weather, temperature, rainfall, sunshine
Iran, a large country in western Asia, has different types of climate: mild and quite wet on the coast of the Caspian Sea,
continental and arid in the plateau, cold in high mountains, desert and hot on the southern coast and in the southeast.
Generally speaking, Iran is an
arid country; however, in the west and the north, the rains are a bit more abundant than in the east and the south. The only rainy area is the Caspian Sea coast. Summer is sunny everywhere (except on the shores of the Caspian Sea).
Index
The Caspian Sea
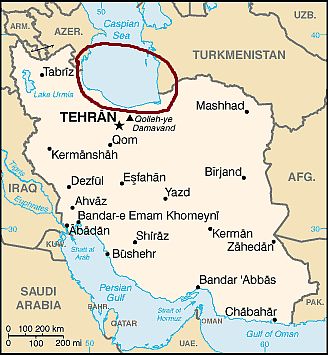 Iran, coasts of the Caspian Sea
In the thin flat strip between the Caspian Sea and the Alborz Mountains,
the climate is mild, almost Mediterranean. Winters are quite mild and rainy, with January averages of around 7 °C (44.5 °F). Summers are hot and humid, with daily averages in July and August around 25 °C/27 °C (77 °C/81 °F), and with some chance of thunderstorms.
Precipitation is more abundant than in the rest of Iran, which generally has an arid climate, and ranges from 800 to 1,400 millimeters (31.5 to 55 in) per year, with a maximum in autumn and a minimum in summer.
Although the climate is mild, in winter, cold air from the north, loading with moisture over the Caspian Sea, can bring snowfall.
On the other hand, the southerly winds, which descend from the mountains, can bring sudden increases in temperature.
The summer is not always sunny: some days are cloudy, and as mentioned, some thunderstorms may occur.
In
Rasht, a city located a short distance from the western part of the coast, the average temperature ranges from 7 °C (44.5 °F) in January to 26 °C (79 °F) in July and August. On average, almost 1,400 mm (55 in) of rain fall per year.
The Caspian Sea is actually a huge salt lake, and the coast is situated about 20 meters (65 feet) below sea level. Its waters are warm enough for swimming from June to October.
On the slopes at the foot of the
Alborz Mountains, the landscape is particularly green, and covered with forests. This is the wettest area of Iran.

In the area to the east of the Caspian Sea, occupied by plains and hills (in the part of
Golestan north of
Gorgan), the climate is arid, almost desert, with hot summers.
Since autumn, though mild, is rainy, if you want to visit this area, the best time is spring, especially the month of May.
The Plateau
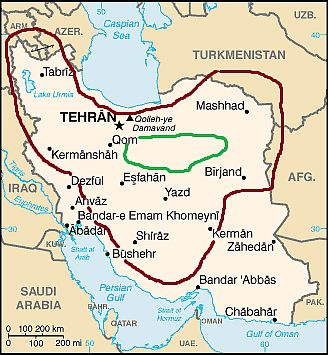 Iran, the plateau
Much of Iran is covered by high plateaus and mountain ranges. The plateau is bordered to the west by the Zagros mountains, and to the north by the aforementioned Alborz mountains. Several cities, including the capital, are found here, at an altitude between 900 and 2,000 metres (3,000 and 6,500 feet). The climate in this area varies with altitude as well as latitude. The plateau experiences high temperature variations between winter and summer.
There is generally a
continental climate in the north, with cold winters and hot summers, and
sub-tropical in the central-southern part, where winters are a bit milder, and summers are scorching and sunny.
In the northernmost part, winter is very cold because of the influence of cold air masses coming from Russia. In summer, the Iranian plateau heats up a lot, so much so that a thermal low pressure forms, but because of the low humidity, the heat is usually bearable, at least when the temperature is not too high.

The
average temperatures in January drop slightly below freezing in the coldest cities, those of the northwest (see
Tabriz,
Urmia) as well as those located at the highest altitudes (see
Shahrekord).
In
Tehran, the capital, quite mild because it is protected by the Alborz mountains, the January average is 5 °C (41 °F).
Instead, in the milder areas of the center-south (see
Shiraz,
Yazd), the January average reaches 6/7 °C (43/45 °F).
In winter, the plateau can experience
cold waves, with snowfall and frost, during which temperatures can drop to -10 °C (14 °F) in the mildest areas, and to -30 °C (-22 °F) in the coldest ones.
In
summer, the average July temperature ranges from 23 °C (73.5 °F) in the north-western cities, to 28 °C (83 °F) in
Mashhad, to 29.5 °C (85 °F) in
Isfahan, to 31 °C (88 °F) in Tehran, to 32/33 °C (90/91 °F) in the hottest cities (see
Qom).
In much of the plateau, the temperature can exceed 40 °C (104 °F) on the hottest days, with peaks of 45 °C (113 °F) in the hottest cities.
Precipitation is generally scarce, from 200 to 350 millimeters (8 to 14 inches) per year (locally more near the western mountains), so much so that the landscape is
semi-arid. In the central-eastern areas, where precipitation drops even below 100 mm (4 in) per year, there are also
deserts.

The
Kavir desert (
Dasht-e-Kavir, "Great Salt Desert") is a large, arid and inhospitable area, located south-east of Tehran (see the green area in the map). There are sand dunes, but also salt lakes fed by rivers flowing down from the mountains, which are dried for much of the year, partly because of the strong evaporation. The desert is located at an altitude of about 700 meters (2,300 feet). Here, winter is quite cold, while summer is scorchingly hot.
If you want to visit Tehran and the cities of the plateau, the best times are
spring and autumn, especially the months of April and October.
In the colder northern cities such as Tabriz, you can move the date by two weeks towards summer (so, mid-April to mid-May and mid-September to mid-October), while in warmer cities like Qom, you can move it by two weeks towards winter (ie mid-March to mid-April and mid-October to mid-November).
The mountains
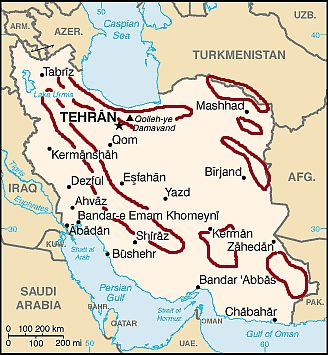 Iran, the mountains
Iran is a particularly mountainous country. This map only gives an indication of the distribution of the main mountain ranges.
The major ranges are the aforementioned
Alborz, whose highest point is Mount Damavand, 5,610 meters (18,405 feet) high and is located south of the Caspian Sea, and
Zagros, a long chain located on a northwest-southeast axis, whose highest peaks are around 4,200 meters (13,800 ft), and which shelters the Iranian plateau from the mild southerly currents.
In winter, high mountains experience snowfalls, frosts and strong winds. On the summits, snow cover lasts for many months, but it melts almost everywhere in summer because this season is hot even at high altitudes. Only in the north, on the peaks of Alborz, there are glaciers above 3,500 meters (11,500 ft), for example, on Damavand and Alam Kuh.
The south
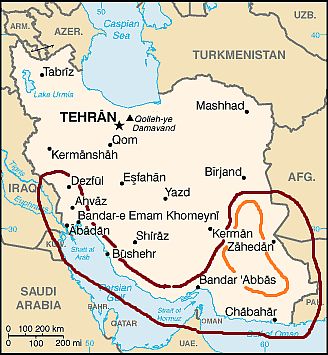 Southern Iran
The southern part of Iran, compared with the rest of the country is really a world apart, in fact, it is warm to hot for most of the year, semi-desert and with virtually no winter.
The winter is mild in the west, at the border with Iraq, in the plain of the
Shatt-al-Arab (Khuzistan province), where cities like Dezful,
Ahvaz and
Abadan are found, and where the average in January is about 12/13 °C (53/55 °F), while summer is scorchingly hot, with highs around 46/47 °C (115/117 °F) in July and August, and peaks of 52 °C (125.5 °F). In winter, cold air masses can sometimes lower the temperature, and there may be some frosts at night.
Only the northern part is relatively rainy: in Dezful, 385 mm (15 in) of rain fall per year, with moderate rainfall from December to February, while in Ahvaz, rainfall drops to 230 mm (9 in), and in Abadan, in drops to 150 mm (6 in) per year.
Along the coast of the
Persian Gulf, winter is even milder, with January averages ranging from 15.5 °C (60 °F) in
Bushehr to 17.5 °C (63.5 °F) in
Bandar-e-Abbas (the latter is located in the Strait of Hormuz).
The Persian Gulf is a bit cool for swimming in winter, while it gets very warm in summer, since it exceeds 30 °C (86 °F) for a few months.
In summer, the temperatures in the Persian Gulf and the Strait of Hormuz are high during the day, with highs around 38 °C (100 °F), and even the night temperatures remain very high, around 30 °C (86 °F); the humidity coming from the sea makes the heat sweltering and hard to bear.
The amount of rainfall is low, typical of a semi-desert climate: 230 mm (9 in) per year in Bushehr and 170 mm (6.7 in) in Bandar-e-Abbas.
In winter, the Strait of Hormuz is a bit warmer than the Persian Gulf, and it's still warm enough for swimming, in fact it does not drop below 22.5 °C (72.5 °F) in February.

Continuing along the coast, east of the Strait of Hormuz, on the
Gulf of Oman (see
Jask, Chabahar), the climate is practically
tropical, since the average temperature of January reaches 20 °C (68 °F). The summer, on the other hand, is less hot, since this area is partially affected by the Indian monsoon circulation.
In
Chabahar (or Chah-Bahar, formerly Bandar Beheshti), the hottest months are May and June, with highs of almost 34 °C (93 °F), while in July and August, they drop to 31/32 °C (88/90 °F), and there may be overcast and muggy days, though with very little rainfall.
In Chabahar, there is a certain decrease in the sunshine hours in summer, which is even more evident than in Bandar-e-Abbas.
The Gulf of Oman is warm enough for swimming even in winter, while it becomes very warm in summer, but a little less than in the Strait of Hormuz.
North of this area, and south-east of the Kavir desert, we find another desert, even more inhospitable, the
Lut Desert (
Dasht-e-Lut, the area circled in orange in the map). The Lut, generally sandy, is mild in winter during the day, but nights are cold, while it's very hot in summer, especially in the southern part, where the altitude drops to 200 meters (650 feet) above sea level. The peaks of summer heat, around 55 °C (131 °F), make it one of the hottest deserts in the world.
Further south, the region of
Sistan and Baluchistan, at least in the part where altitude is below 1,000 meters (3,300 feet), has a similar climate.
In
Iranshahr, at 550 meters (1,800 feet) of altitude, the average ranges from 15 °C (59 °F) in January to 38 °C (100 °F) in July: this is also one of the hottest cities in the world.
In this southern region of Iran, the
best months are March and November in the area of the Persian Gulf, while in the eastern part, from the Strait of Hormuz to the east, and also in Sistan and Baluchistan, the best period runs from December to February.
Tropical cyclones
The southeastern part of Iran, overlooking the Gulf of Oman, in the provinces of Hormozgan and Sistan and Baluchestan, may be affected by
tropical cyclones.
Cyclones typically do not directly affect Iran, but pass to the south, towards the Arabian Peninsula, or to the east, towards Pakistan, bringing nonetheless rain and wind in the southeastern tip of Iran (as happened with Cyclone Phet in early June 2010).
More rarely, it can happen that they can reach the coast, and maybe penetrate a bit inland, before dissipating, as happened twice in June 2007, at the beginning of the month with Cyclone Gonu, and at the end of the month with Cyclone Yemyin.
Cyclones form from May to November, and are more frequent at the beginning of the period (May-June), and a little less at the end (October-November).
When to go
Given the vastness of Iran and its different climates, it is difficult to find a period that is best for all the country, however, you can choose
spring and autumn to avoid the winter cold (present especially in the north and at high altitudes) as well as the summer heat (present almost everywhere).
You can choose
spring, in particular the month of April, which, however, can still be a bit cold in the north and in the mountains, and can already be hot in the south, in the Persian Gulf and the Gulf of Oman, and even more so in Sistan and Baluchistan.
Autumn can be nice as well, especially the month of October, but in the south, it's even hotter than in April, while it may be rainy on the Caspian Sea.
What to pack
In
winter: on the coast of the Caspian Sea, bring warm clothes, such as a sweater, a jacket, and a raincoat or umbrella. In Tabriz, the northern plateau and high mountains, very warm clothes, such as a down jacket, a hat, a scarf, and gloves. In Tehran and Isfahan, warm clothes, such as a sweater, a coat, and a hat. In the Lut Desert, spring/autumn clothes (light for the day), a sweater, a jacket, and a scarf for the sand. On the coast of the Persian Gulf and in Bandar-e-Abbas, spring/autumn clothes, a jacket and a sweater; for the Gulf of Oman, spring/autumn clothes (light for the day), a light jacket and a sweater.
In
summer: on the coast of the Caspian Sea, bring light clothes, a light sweatshirt for the evening, a scarf for the breeze, and possibly a light raincoat or umbrella. In Tehran and the major cities of the plateau, loose-fitting, light-colored clothing, light and long shirts and pants of natural fibers (cotton, linen), a wide-brimmed hat, sunglasses, comfortable and breathable shoes, a desert turban, and a sweatshirt for the evening. Above 2,000 meters (6,500 feet), you can add a jacket for the evening.
On high mountains, bring warmer clothes depending on the altitude. On the shores of the Persian Gulf and the Gulf of Oman, bring tropics-friendly, lightweight clothes, a desert turban, a sweatshirt and a scarf for air conditioned.
When visiting mosques, you must cover your shoulders and knees, and take off your shoes. Women should avoid low-cut dresses.
Climate data - Iran
| Abadan |
|---|
|
| Jan | Feb | Mar | Apr | May | Jun | Jul | Aug | Sep | Oct | Nov | Dec |
|---|
| Min temp. | 8 | 10 | 14 | 20 | 25 | 28 | 29 | 28 | 25 | 20 | 14 | 9 |
|---|
| Max temp. | 18 | 21 | 27 | 33 | 40 | 45 | 47 | 47 | 43 | 37 | 27 | 20 |
|---|
| Precip. | 35 | 15 | 20 | 15 | 5 | 0 | 0 | 0 | 0 | 10 | 25 | 40 |
|---|
| Prec. days | 4 | 3 | 3 | 2 | 1 | 0 | 0 | 0 | 0 | 1 | 3 | 4 |
|---|
| Humidity | 67% | 54% | 44% | 37% | 27% | 20% | 22% | 25% | 27% | 38% | 53% | 66% |
|---|
| Day length | 10 | 11 | 12 | 13 | 14 | 14 | 14 | 13 | 12 | 11 | 11 | 10 |
|---|
| Sun hours | 6 | 7 | 8 | 8 | 10 | 11 | 11 | 11 | 10 | 9 | 7 | 6 |
|---|
|
| Ahvaz |
|---|
|
| Jan | Feb | Mar | Apr | May | Jun | Jul | Aug | Sep | Oct | Nov | Dec |
|---|
| Min temp. | 8 | 10 | 14 | 19 | 25 | 28 | 30 | 30 | 25 | 20 | 14 | 10 |
|---|
| Max temp. | 18 | 21 | 26 | 33 | 40 | 45 | 47 | 47 | 43 | 36 | 26 | 20 |
|---|
| Precip. | 45 | 25 | 30 | 15 | 5 | 0 | 0 | 0 | 0 | 10 | 40 | 50 |
|---|
| Prec. days | 5 | 3 | 4 | 3 | 0 | 0 | 0 | 0 | 0 | 1 | 3 | 4 |
|---|
| Humidity | 68% | 56% | 46% | 37% | 25% | 19% | 21% | 24% | 26% | 36% | 53% | 69% |
|---|
| Day length | 10 | 11 | 12 | 13 | 14 | 14 | 14 | 13 | 12 | 11 | 11 | 10 |
|---|
| Sun hours | 6 | 7 | 8 | 8 | 10 | 11 | 11 | 11 | 10 | 9 | 7 | 6 |
|---|
|
| Bandar Abbas |
|---|
|
| Jan | Feb | Mar | Apr | May | Jun | Jul | Aug | Sep | Oct | Nov | Dec |
|---|
| Min temp. | 12 | 14 | 17 | 21 | 25 | 28 | 31 | 30 | 28 | 24 | 18 | 13 |
|---|
| Max temp. | 23 | 25 | 28 | 33 | 37 | 39 | 38 | 38 | 37 | 35 | 30 | 26 |
|---|
| Precip. | 45 | 30 | 45 | 5 | 0 | 0 | 0 | 0 | 0 | 5 | 10 | 25 |
|---|
| Prec. days | 3 | 3 | 3 | 1 | 0 | 0 | 0 | 0 | 0 | 1 | 1 | 2 |
|---|
| Humidity | 64% | 65% | 65% | 59% | 56% | 60% | 66% | 68% | 66% | 63% | 59% | 58% |
|---|
| Day length | 11 | 11 | 12 | 13 | 14 | 14 | 14 | 13 | 12 | 12 | 11 | 10 |
|---|
| Sun hours | 7 | 8 | 7 | 9 | 10 | 10 | 9 | 9 | 9 | 9 | 8 | 8 |
|---|
| Sea temp | 23 | 22 | 23 | 25 | 28 | 31 | 32 | 32 | 32 | 30 | 28 | 25 |
|---|
| Bushehr |
|---|
|
| Jan | Feb | Mar | Apr | May | Jun | Jul | Aug | Sep | Oct | Nov | Dec |
|---|
| Min temp. | 12 | 13 | 16 | 21 | 26 | 29 | 30 | 31 | 28 | 24 | 18 | 14 |
|---|
| Max temp. | 20 | 21 | 24 | 30 | 34 | 36 | 37 | 38 | 36 | 33 | 27 | 22 |
|---|
| Precip. | 80 | 25 | 20 | 5 | 0 | 0 | 0 | 0 | 0 | 5 | 60 | 60 |
|---|
| Prec. days | 5 | 3 | 3 | 2 | 0 | 0 | 0 | 0 | 0 | 1 | 4 | 4 |
|---|
| Humidity | 65% | 64% | 58% | 53% | 51% | 54% | 57% | 61% | 59% | 58% | 59% | 67% |
|---|
| Day length | 10 | 11 | 12 | 13 | 14 | 14 | 14 | 13 | 12 | 12 | 11 | 10 |
|---|
| Sun hours | 7 | 7 | 7 | 8 | 10 | 11 | 10 | 10 | 10 | 9 | 8 | 7 |
|---|
| Sea temp | 20 | 18 | 19 | 22 | 26 | 29 | 31 | 33 | 32 | 30 | 26 | 23 |
|---|
| Chabahar |
|---|
|
| Jan | Feb | Mar | Apr | May | Jun | Jul | Aug | Sep | Oct | Nov | Dec |
|---|
| Min temp. | 17 | 18 | 20 | 24 | 27 | 29 | 29 | 28 | 27 | 24 | 21 | 18 |
|---|
| Max temp. | 24 | 25 | 27 | 30 | 33 | 34 | 32 | 31 | 31 | 31 | 29 | 26 |
|---|
| Precip. | 35 | 5 | 20 | 0 | 0 | 10 | 5 | 0 | 0 | 5 | 10 | 25 |
|---|
| Prec. days | 2 | 1 | 2 | 0 | 0 | 0 | 0 | 0 | 0 | 0 | 1 | 1 |
|---|
|
|
| Sun hours | 8 | 8 | 8 | 9 | 10 | 8 | 6 | 7 | 8 | 9 | 9 | 8 |
|---|
| Sea temp | 24 | 23 | 24 | 26 | 29 | 31 | 31 | 30 | 29 | 29 | 27 | 25 |
|---|
| Iranshahr (550 meters) |
|---|
|
| Jan | Feb | Mar | Apr | May | Jun | Jul | Aug | Sep | Oct | Nov | Dec |
|---|
| Min temp. | 8 | 11 | 15 | 21 | 26 | 30 | 31 | 29 | 26 | 20 | 14 | 10 |
|---|
| Max temp. | 21 | 24 | 29 | 35 | 41 | 44 | 44 | 43 | 41 | 36 | 29 | 24 |
|---|
| Precip. | 20 | 20 | 20 | 5 | 0 | 5 | 5 | 5 | 0 | 5 | 5 | 15 |
|---|
| Prec. days | 2 | 2 | 3 | 1 | 0 | 1 | 1 | 1 | 0 | 0 | 0 | 1 |
|---|
| Humidity | 41% | 35% | 32% | 23% | 17% | 17% | 21% | 18% | 17% | 20% | 27% | 35% |
|---|
| Day length | 11 | 11 | 12 | 13 | 14 | 14 | 14 | 13 | 12 | 12 | 11 | 10 |
|---|
| Sun hours | 8 | 8 | 8 | 9 | 10 | 10 | 10 | 10 | 10 | 10 | 9 | 8 |
|---|
|
| Isfahan (1,500 meters) |
|---|
|
| Jan | Feb | Mar | Apr | May | Jun | Jul | Aug | Sep | Oct | Nov | Dec |
|---|
| Min temp. | -3 | 0 | 5 | 10 | 14 | 19 | 22 | 20 | 15 | 10 | 3 | -1 |
|---|
| Max temp. | 10 | 14 | 18 | 23 | 29 | 35 | 38 | 36 | 32 | 26 | 17 | 12 |
|---|
| Precip. | 20 | 15 | 25 | 20 | 10 | 0 | 0 | 0 | 0 | 5 | 20 | 20 |
|---|
| Prec. days | 4 | 3 | 4 | 4 | 2 | 0 | 0 | 0 | 0 | 1 | 3 | 3 |
|---|
|
|
| Sun hours | 7 | 8 | 8 | 9 | 10 | 12 | 11 | 12 | 11 | 9 | 7 | 6 |
|---|
|
| Rasht |
|---|
|
| Jan | Feb | Mar | Apr | May | Jun | Jul | Aug | Sep | Oct | Nov | Dec |
|---|
| Min temp. | 4 | 4 | 7 | 10 | 16 | 20 | 22 | 22 | 19 | 15 | 9 | 6 |
|---|
| Max temp. | 12 | 12 | 15 | 19 | 24 | 28 | 30 | 31 | 27 | 23 | 17 | 13 |
|---|
| Precip. | 130 | 130 | 110 | 75 | 40 | 40 | 50 | 70 | 160 | 200 | 220 | 155 |
|---|
| Prec. days | 10 | 10 | 10 | 7 | 6 | 4 | 4 | 6 | 9 | 10 | 11 | 10 |
|---|
| Humidity | 84% | 84% | 82% | 81% | 78% | 75% | 75% | 77% | 83% | 87% | 87% | 85% |
|---|
| Day length | 10 | 11 | 12 | 13 | 14 | 15 | 14 | 14 | 12 | 11 | 10 | 10 |
|---|
| Sun hours | 3 | 3 | 3 | 4 | 6 | 8 | 8 | 7 | 5 | 4 | 3 | 3 |
|---|
|
| Shiraz (1,500 meters) |
|---|
|
| Jan | Feb | Mar | Apr | May | Jun | Jul | Aug | Sep | Oct | Nov | Dec |
|---|
| Min temp. | 0 | 2 | 5 | 9 | 14 | 18 | 21 | 19 | 15 | 10 | 5 | 1 |
|---|
| Max temp. | 13 | 16 | 20 | 25 | 31 | 37 | 39 | 38 | 34 | 28 | 20 | 15 |
|---|
| Precip. | 80 | 55 | 50 | 25 | 5 | 0 | 0 | 0 | 0 | 5 | 40 | 65 |
|---|
| Prec. days | 6 | 5 | 5 | 3 | 1 | 0 | 0 | 0 | 0 | 1 | 3 | 5 |
|---|
| Humidity | 57% | 49% | 43% | 39% | 25% | 18% | 20% | 21% | 22% | 29% | 46% | 56% |
|---|
| Day length | 10 | 11 | 12 | 13 | 14 | 14 | 14 | 13 | 12 | 11 | 11 | 10 |
|---|
| Sun hours | 7 | 8 | 8 | 9 | 11 | 12 | 11 | 11 | 10 | 10 | 8 | 7 |
|---|
|
| Tabriz (1,350 meters) |
|---|
|
| Jan | Feb | Mar | Apr | May | Jun | Jul | Aug | Sep | Oct | Nov | Dec |
|---|
| Min temp. | -5 | -3 | 1 | 6 | 11 | 16 | 20 | 20 | 15 | 9 | 2 | -3 |
|---|
| Max temp. | 4 | 6 | 12 | 18 | 24 | 30 | 34 | 34 | 29 | 22 | 12 | 6 |
|---|
| Precip. | 20 | 20 | 30 | 50 | 40 | 10 | 5 | 5 | 5 | 20 | 25 | 25 |
|---|
| Prec. days | 4 | 4 | 7 | 7 | 7 | 2 | 1 | 1 | 1 | 3 | 4 | 5 |
|---|
| Humidity | 71% | 64% | 54% | 51% | 45% | 35% | 32% | 31% | 35% | 46% | 62% | 70% |
|---|
| Day length | 10 | 11 | 12 | 13 | 14 | 15 | 14 | 14 | 12 | 11 | 10 | 10 |
|---|
| Sun hours | 5 | 6 | 6 | 7 | 9 | 11 | 11 | 11 | 10 | 8 | 6 | 4 |
|---|
|
| Tehran (1,200 meters) |
|---|
|
| Jan | Feb | Mar | Apr | May | Jun | Jul | Aug | Sep | Oct | Nov | Dec |
|---|
| Min temp. | 1 | 3 | 7 | 13 | 18 | 22 | 25 | 25 | 21 | 15 | 8 | 3 |
|---|
| Max temp. | 8 | 11 | 16 | 22 | 28 | 34 | 37 | 36 | 32 | 25 | 16 | 10 |
|---|
| Precip. | 30 | 35 | 40 | 35 | 15 | 0 | 0 | 0 | 0 | 15 | 30 | 30 |
|---|
| Prec. days | 5 | 5 | 6 | 5 | 4 | 1 | 0 | 0 | 0 | 2 | 5 | 5 |
|---|
| Humidity | 57% | 50% | 41% | 37% | 30% | 23% | 24% | 25% | 27% | 36% | 49% | 58% |
|---|
| Day length | 10 | 11 | 12 | 13 | 14 | 14 | 14 | 13 | 12 | 11 | 10 | 10 |
|---|
| Sun hours | 6 | 6 | 7 | 8 | 9 | 11 | 11 | 11 | 10 | 8 | 6 | 5 |
|---|
|
See also the
temperatures month by month