Select units of measurement for the temperature and rainfall tables (metric or imperial).
Average weather, temperature, rainfall, sunshine hours

The climate of Chabahar is
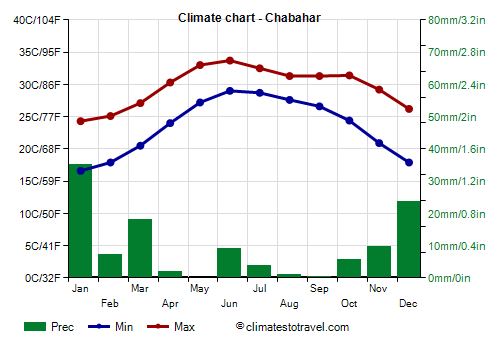
tropical desert, with pleasantly warm winters and hot, muggy summers. Precipitation, decidedly scarce, occurs mostly between December and March.
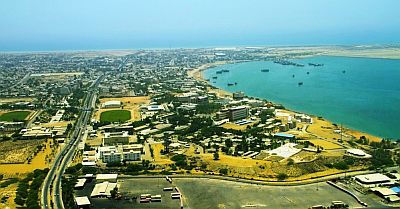
Chabahar, formerly Bandar Beheshti, is a city of 105,000 inhabitants located in the south-east of Iran, in the province of Sistan and Baluchistan, and at 25 degrees north latitude. We are in
Makran, the coast of Baluchistan, a historical region divided between Iran and Pakistan. The border with Pakistan is about 100 km (62 mi) to the east. Chabahar overlooks a bay, beyond which lies the city of Konarak.
 Winter
, from December to February, is pleasantly warm, so much so that the January average exceeds 20 °C (68 °F). Rainfall is rare even in this season, although there can be a period of bad weather every now and then.
Unlike in the interior of Iran, cold waves do not arrive here. However, there can sometimes be slightly cool periods, with lows of 8/10 °C (46/50 °F) and maximums of 18/20 °C (64/68 °F).
Summer, from May to September, is hot. Daytime temperatures are not as high as on the Persian Gulf coast, however, the humidity is very high, so the sensation of heat is unpleasant. Especially in the first part (May-June), heat waves are possible, with highs equal to or higher than 40 °C.
In the second part, this southeastern area of Iran is marginally affected by the
monsoon circulation, so some cloudiness can form, to the point that July and August are the least sunny months of the year, and even the temperature drops a little compared with June. However, the rains remain very rare.
Occasionally, this area can be affected by
tropical cyclones (which generally pass further south, on the Arabian Peninsula, or hit Pakistan, further east), as happened with Cyclone Gonu in early June 2007, Cyclone Phet in early June 2010, and Cyclone Shaheen in early October 2021.
Cyclones form from May to November, and are more frequent at the beginning of the period (May-June), and a little less at the end (October-November).
Chabahar - Climate data
In Chabahar, the
average temperature of the coldest month (January) is of
20.5 °C, that of the warmest month (June) is of
31.4 °C. Here are the average temperatures.
Chabahar - Average temperatures (1991-2020) |
| Month | Min | Max | Mean |
|---|
| January | 16.6 | 24.3 | 20.5 |
|---|
| February | 17.9 | 25.1 | 21.5 |
|---|
| March | 20.5 | 27.1 | 23.8 |
|---|
| April | 24 | 30.3 | 27.2 |
|---|
| May | 27.2 | 33 | 30.1 |
|---|
| June | 29 | 33.7 | 31.4 |
|---|
| July | 28.7 | 32.5 | 30.6 |
|---|
| August | 27.6 | 31.3 | 29.4 |
|---|
| September | 26.6 | 31.3 | 29 |
|---|
| October | 24.4 | 31.4 | 27.9 |
|---|
| November | 20.9 | 29.2 | 25 |
|---|
| December | 17.9 | 26.2 | 22 |
|---|
| Year | 23.5 | 29.6 | 26.5 |
|---|
amounts to
115 millimeters per year: it is therefore at a desert level. It ranges from
0 millimeters in the driest month (May) to
35.1 millimeters in the wettest one (January). Here is the average precipitation.
Chabahar - Average precipitation| Month | Days |
|---|
| January | 35 | 2 |
|---|
| February | 7 | 1 |
|---|
| March | 18 | 2 |
|---|
| April | 2 | 0 |
|---|
| May | 0 | 0 |
|---|
| June | 9 | 0 |
|---|
| July | 4 | 0 |
|---|
| August | 1 | 0 |
|---|
| September | 0 | 0 |
|---|
| October | 6 | 0 |
|---|
| November | 10 | 1 |
|---|
| December | 24 | 1 |
|---|
| Year | 115 | 8 |
|---|
The
sea temperature ranges from
23.5 °C in January, February to
31 °C in June, July. Here are the average sea temperatures.
Chabahar - Sea temperature| Month |
|---|
| January | 23.5 |
|---|
| February | 23.5 |
|---|
| March | 24 |
|---|
| April | 26.5 |
|---|
| May | 29.5 |
|---|
| June | 31 |
|---|
| July | 31 |
|---|
| August | 30 |
|---|
| September | 29 |
|---|
| October | 28.5 |
|---|
| November | 27"> |
|---|
| December | 25 |
|---|
| Year | 27.5 |
|---|
There are on average around 2990
sunshine hours per year. Here are the average hours of sunshine per day.
Chabahar - Sunshine hours| Month | Average | Total |
|---|
| January | 8 | 250 |
|---|
| February | 8.5 | 235 |
|---|
| March | 8 | 245 |
|---|
| April | 9 | 270 |
|---|
| May | 9.5 | 300 |
|---|
| June | 8.5 | 250 |
|---|
| July | 6 | 190 |
|---|
| August | 6.5 | 210 |
|---|
| September | 8 | 245 |
|---|
| October | 9 | 275 |
|---|
| November | 9 | 265 |
|---|
| December | 8.5 | 260 |
|---|
| Year | 8.2 | 2990 |
|---|