Select units of measurement for the temperature and rainfall tables (metric or imperial).
Average weather, temperature, rainfall, sunshine hours

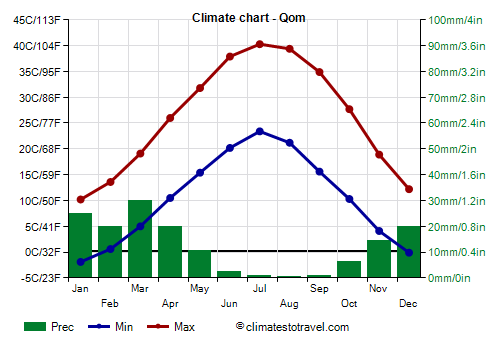
The climate of Qom is
subtropical desert, with relatively mild winters (but during which it can get cold at night) and very hot, sunny summers. Precipitation, which is scarce, occurs mostly from November to April.
Qom is a city of 1,200,000 inhabitants located in the center-north of Iran, at 34 degrees north latitude and 935 meters (3,065 feet) above sea level. We are on the western edge of the Kavir desert (Dasht-e Kavir).
 Winter
, from December to February, is quite mild during the day, but with frequent frosts at night.
There can be mild periods, with highs of 15 °C (59 °F) or more, but also cold periods, during which snowfalls can occur, generally not abundant given the low level of precipitation. During cold spells, the temperature can drop to -10 °C (14 °F) or below, and more rarely to lower values. The coldest record is -23 °C (-9.5 °F), set in January 2008.
Summer, from June to August, is very hot and sunny. Due to its low altitude, Qom is one of the hottest cities in the Iranian plateau. In the hottest periods, the temperature can exceed 45 °C (113 °F). The hottest record is 47 °C (116.5 °F).
Qom - Climate data
In Qom, the
average temperature of the coldest month (January) is of
4.1 °C, that of the warmest month (July) is of
31.8 °C. Here are the average temperatures.
Qom - Average temperatures (1986-2010) |
| Month | Min | Max | Mean |
|---|
| January | -1.9 | 10.2 | 4.1 |
|---|
| February | 0.6 | 13.6 | 7.1 |
|---|
| March | 5 | 19.1 | 12 |
|---|
| April | 10.5 | 26 | 18.2 |
|---|
| May | 15.4 | 31.8 | 23.6 |
|---|
| June | 20.2 | 37.9 | 29 |
|---|
| July | 23.4 | 40.3 | 31.8 |
|---|
| August | 21.2 | 39.4 | 30.3 |
|---|
| September | 15.6 | 34.9 | 25.2 |
|---|
| October | 10.3 | 27.7 | 19 |
|---|
| November | 4.1 | 18.9 | 11.5 |
|---|
| December | -0.1 | 12.2 | 6 |
|---|
| Year | 10.4 | 26.1 | 18.2 |
|---|
amounts to
150 millimeters per year: it is therefore at a desert level. It ranges from
0.3 millimeters in the driest month (August) to
30 millimeters in the wettest one (March). Here is the average precipitation.
Qom - Average precipitation| Month | Days |
|---|
| January | 25 | 4 |
|---|
| February | 20 | 4 |
|---|
| March | 30 | 4 |
|---|
| April | 20 | 4 |
|---|
| May | 10 | 2 |
|---|
| June | 2 | 0 |
|---|
| July | 1 | 0 |
|---|
| August | 0 | 0 |
|---|
| September | 1 | 0 |
|---|
| October | 6 | 2 |
|---|
| November | 14 | 3 |
|---|
| December | 20 | 3 |
|---|
| Year | 150 | 27 |
|---|
There are on average around 3135
sunshine hours per year. Here are the average hours of sunshine per day.
Qom - Sunshine hours| Month | Average | Total |
|---|
| January | 6 | 185 |
|---|
| February | 7 | 195 |
|---|
| March | 7 | 220 |
|---|
| April | 8 | 235 |
|---|
| May | 9.5 | 295 |
|---|
| June | 11.5 | 350 |
|---|
| July | 11.5 | 355 |
|---|
| August | 11 | 345 |
|---|
| September | 10.5 | 310 |
|---|
| October | 8.5 | 265 |
|---|
| November | 7 | 205 |
|---|
| December | 5.5 | 175 |
|---|
| Year | 8.6 | 3135 |
|---|