Select units of measurement for the temperature and rainfall tables (metric or imperial).
Average weather, temperature, rainfall, sunshine
In Kuwait, a small western Asian country located in the northern part of the Persian Gulf, there's a
subtropical desert climate, with very mild winters and extremely hot summers. The sun usually shines all year round.
Rainfall, slightly higher than 100 millimeters (4 inches) per year, occurs mainly from November to April, in the form of rare showers, which can sometimes be so intense and concentrated as to cause flooding.
The climate in detail
The seasons
Winter, from December to February, is very mild. Sometimes, however, it gets cold at night, and the temperature can drop to around 0 °C (32 °F). The record is -4 °C (25 °F), set in January 1964.
The days are usually mild or pleasantly warm, around 19-22 °C (66/72 °F), but the temperature can reach 27/30 °C (81/86 °F) when the wind blows from the south.
In winter, the sun often shines, but some cloudy days also possible, maybe with some rain.
In
spring, the prevailing weather is sunny; the temperature rises rapidly, and already in April, highs are around 34 °C (93 °F). The wind from the Arabian desert can raise the temperature and bring sandstorms: as early as in April, it can exceed 40 °C (104 °F), while in May, it can even exceed 45 °C (113 °F).
 Summer
 in Kuwait is scorchingly hot and windy; the prevailing wind blows from the interior, and therefore the influence of the sea is minimal. From June to August, the temperature is normally around 46/47 °C (115/116 °F) during the day and around 30 °C (86 °F) at night.
The high-temperature record in the capital is 52.1 °C (125.8 °F), set in July 2020.
Relative humidity is very low (it often falls below 10%), and in combination with the wind, it can cause dehydration. Fortunately, public buildings and hotels are equipped with air conditioning.
Since it normally receives the wind from the continent, the small island of
Failaka is usually torrid (that is, hot and dry) as well, but it can sometimes be muggy, especially in September and October, in the days when the wind calms down a bit.
In
autumn, the weather is still hot and sunny in October, while the temperature drops below 30 °C (86 °F) during the month of November.
Kuwait City

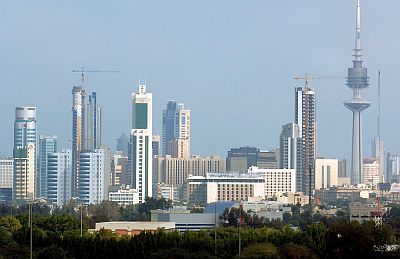
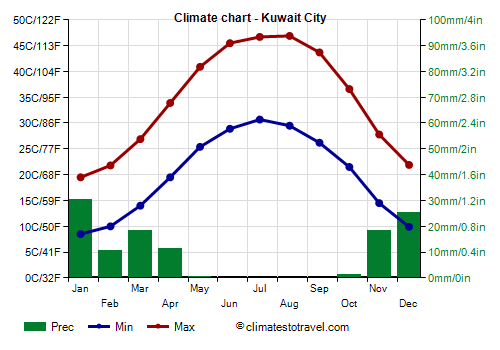
In the capital, Kuwait City, which in summer is one of the hottest cities in the world, the average
temperature ranges from 14 °C (57 °F) in January to 38.5 °C (101 °F) in July.
Rainfall amounts to just 115 millimeters (4.5 in) per year.
The
sun in Kuwait shines all year round, sometimes, however, some cloud banks can move over the country, even in summer.
Sea temperature
The Persian Gulf, in the northern part where Kuwait is located, is a bit cold for swimming in winter, given that it drops to 17/18 °C from January to March, while it becomes warm enough for swimming from May to November. In summer, it is very warm, given that it exceeds 30 °C (86 °F) for a few months.
When to go
The best time to visit Kuwait runs from
mid-November to mid-March. In winter, from December to February, it can sometimes get cold at night, and there can be some rain, but at least, you avoid the scorching heat. In early November and late March, it can sometimes get hot.
However, the heat in Kuwait is almost always torrid, ie dry, so it is more bearable than in other countries of the Persian Gulf; it's important to drink a lot and to be protected from the sun.
What to pack
In
winter: bring spring/autumn clothes, a T-shirt or shirt for warm days, a sweater and a warm jacket for the evening and cold days, a scarf for the wind, and possibly an umbrella.
In
summer: bring lightweight, loose-fitting clothes, made of natural fabric (cotton or linen), a desert turban, a sweater and a scarf for air conditioned places.
It's better for women to avoid shorts and miniskirts outside tourist resorts.
When going to the reef, you can bring snorkeling equipment, including water shoes or rubber-soled shoes.
Climate data - Kuwait
| Kuwait City |
|---|
|
| Jan | Feb | Mar | Apr | May | Jun | Jul | Aug | Sep | Oct | Nov | Dec |
|---|
| Min temp. | 8 | 10 | 14 | 20 | 25 | 29 | 31 | 30 | 26 | 22 | 14 | 10 |
|---|
| Max temp. | 20 | 22 | 27 | 34 | 41 | 46 | 47 | 47 | 44 | 37 | 28 | 22 |
|---|
| Precip. | 30 | 10 | 20 | 10 | 0 | 0 | 0 | 0 | 0 | 0 | 20 | 25 |
|---|
| Prec. days | 5 | 3 | 3 | 1 | 0 | 0 | 0 | 0 | 0 | 1 | 3 | 3 |
|---|
| Humidity | 61% | 50% | 40% | 32% | 21% | 13% | 14% | 18% | 21% | 34% | 48% | 59% |
|---|
| Day length | 10 | 11 | 12 | 13 | 14 | 14 | 14 | 13 | 12 | 11 | 11 | 10 |
|---|
| Sun hours | 7 | 8 | 8 | 8 | 10 | 11 | 11 | 11 | 11 | 10 | 8 | 7 |
|---|
| Sea temp | 18 | 17 | 18 | 21 | 26 | 29 | 31 | 32 | 31 | 29 | 26 | 22 |
|---|