Select units of measurement for the temperature and rainfall tables (metric or imperial).
Average weather, temperature, rainfall, sunshine
In Iraq, the climate is
desert in the center and the south, with mild winters and extremely hot summers, and it's
semi-desert in the north, with relatively cold winters.
In the northern
mountains, the climate is cold and rainy (or snowy) in winter and hot and sunny in summer, but with cooler nights due to the high altitude.
In late winter and spring, Iraq can be affected by strong
southerly winds, which may give rise to dust storms; these winds may occur even in autumn and winter, though more rarely. On the contrary, during the long summer months, the
shamal blows, a moderate northwesterly wind, very hot and dry, which may cause rapid dehydration, and when it's more intense, it can raise dust or sand.
The climate in detail
Mountains
In the
north-eastern part of Iraq (zone 1 on the map), occupied by the mountains of Iraqi Kurdistan (
Zagros and Taurus),
winters are cold and rainy, while summers are hot and dry, even scorching up to quite high altitudes.
Annual precipitation ranges between 700 and 1,000 millimeters (27 and 40 inches), and occurs between October and April. This is the only area of Iraq which receives substantial rainfall.
Sulaymaniyah
In
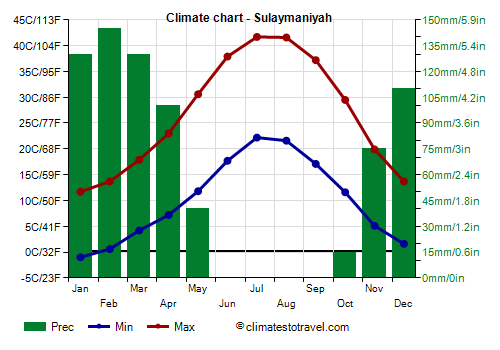
Sulaymaniyah, 850 meters (2,800 ft) above sea level, the average temperature ranges from 5.5 °C (42 °F) in January to 32 °C (89.5 °F) in July. So the summer is hot, as well as sunny, while the winter is quite cold, with possible snowfalls and frosts, when the area is reached by cold air masses from the north.
In Sulaymaniyah, annual precipitation amounts to 745 mm (29.5 in), most of which occurring from November to April, while it never rains from June to September.
In the northernmost mountainous area, winter is even colder, and in the valleys at high altitude, it is freezing. At the highest altitudes, heavy snowfalls occur.
The highest peak of Iraq is
Cheekha Dar, 3,611 meters (11,847 feet) high, on the border with Iran.
Syrian desert
North-west of Mesopotamia, in the
hilly area towards Syria (zone 4), the climate is desert, quite cold with frequent frosts in winter (although the climate has warmed in recent years), and hot in summer, though a bit less hot than in the plains because of altitude.
Rutbah
In
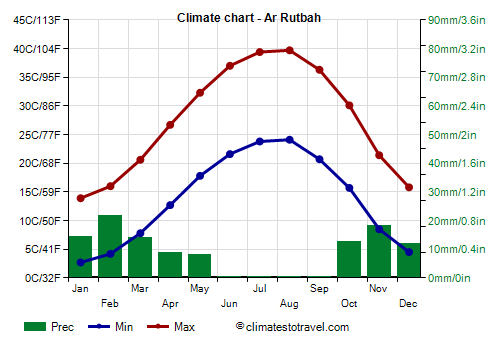
Rutbah, 600 meters (2,000 feet) above sea level, the average is between 8.3 °C (47 °F) in January and 31.9 °C (89.5 °F) in July. In summer, the temperature can sometimes reach 45/47 °C (113/117 °F).
Throughout the year, only 110 mm (4.3 in) of rain fall, concentrated in the winter months. In winter, snow and frost are possible during cold spells.
In the
rest of Iraq, which is occupied by plains or hills (zones 2 and 3), the climate is arid,
mild in winter and scorchingly hot in summer. Summer goes from June to September, but the months of May and October are hot as well. Although the climate in Mesopotamia is desert, the landscape can change locally due to the rivers, both where they give rise to wetlands, and where they are exploited to irrigate the fields.
North
In the
northern belt (zone 2), the climate is arid, but in the cold half of the year, some
depressions can affect this area for a few months, bringing moderate rainfall.
Mosul
In
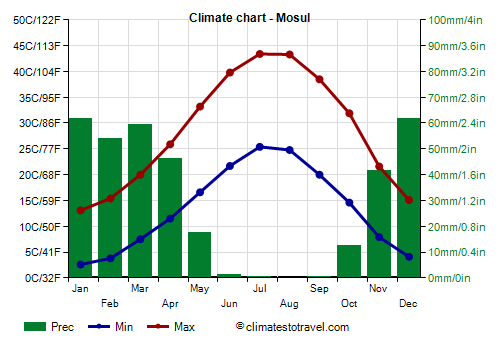
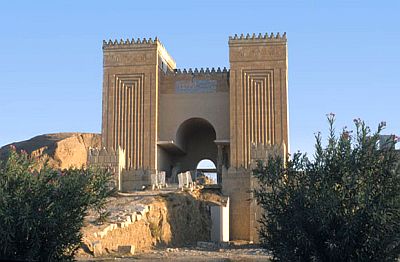
Mosul, located in the northernmost part of the plain, on the banks of the Tigris River, not far from the ancient Nineveh, winter is mild, but it's certainly not tropical: the average in January is 8 °C (46 °F). From December to March, it rains for 7/10 days per month, and sunny days alternate with
periods of bad weather. At night, it often gets cold, and the temperature can sometimes drop a few degrees below freezing (0 °C or 32 °F). Occasionally, it can even snow.
Summer in Mosul is very hot, with a relentless sun, and with daytime temperatures of 43 °C (109 °F) in July and August, but with peaks of 47/48 °C (117/118 °F); fortunately, however, air humidity is low.
Throughout the year, in Mosul, 355 mm (14 in) of rain fall: they are not many, but they are concentrated between November and April, with very few rains in May and October, while it almost never rains between June and September.
In Mosul, the sun shines regularly in summer, while it shines quite often in winter, when, however, there are also cloudy periods.
South-east of Mosul,
Kirkuk has a similar climate because the more southern position is balanced out by the slightly higher altitude, around 350 meters (1,150 ft).
Center-south
Throughout
central and southern Iraq (zone 3), the climate is
desert or semi-desert, with mild winters, which are progressively warmer as you head south. Summers are extremely hot. Fortunately, even in this area, air humidity during the summer months is low because the prevailing winds, often lively and sometimes capable of generating dust storms, come from the west or the north-west and therefore from the interior. The wind is more frequent in the central and southern parts of the country.
Baghdad
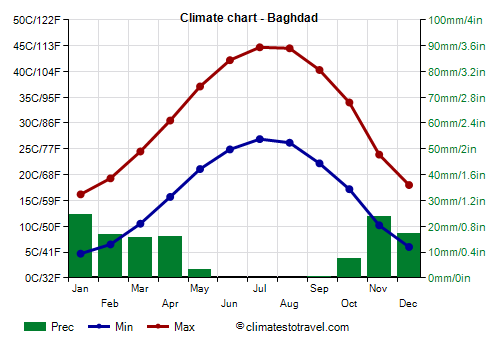
In the Iraqi capital,
Baghdad, the average temperature ranges from 10.5 °C (51 °F) in January to 36 °C (97 °F) in July, with highs almost as high as 45 °C (113 °F). Here too, summer is hot and the sunshine reigns supreme, with peaks around 50 °C (122 °F): these temperatures make Baghdad
one of the hottest capitals in the world.
In winter, days are mild but nights are often cold, and the temperature may drop to a few degrees below freezing.
In 2020, there was even a snowfall in February, and the temperature dropped to -3.5 °C (25.5 °F). At the end of July, on the other hand, the temperature reached 52 °C (125 °F).
Throughout the year, only 125 mm (5 in) of rain fall, almost all occurring from November to March; from June to September, it never rains.
In Baghdad, the sun shines quite often even from November to April, when, however, some weather fronts can sometimes affect the city. In summer, clear skies prevail, even though cloud banks can sometimes reach the area. However, with more than 3,200 hours a year, Baghdad is a very sunny city.
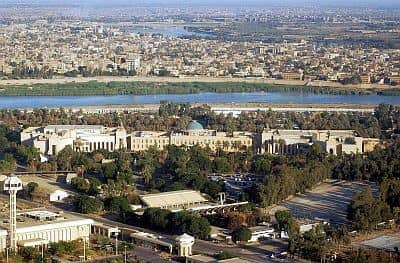
In the nearby cities of
Kerbala and
Ramadi, the climate is similar to that of Baghdad.
Nasiriya

Further south, the temperatures rise a bit in winter: in
Basra and
Nasiriya, the average in January is 12.5 °C (54.5 °F). However, the night temperature can sometimes drop to 0 °C (32 °F).
In summer, southern Iraq is one of the hottest areas in the world (or
perhaps the hottest), with highs of 46/47 °C.
Even in Nasiriyah, the rainfall amounts to 125 mm (5 in) per year.
Further south, in
Basra, the humidity in summer remains quite low, but it rises a bit compared with other cities, not because of the proximity of the sea but because of the presence of wetlands in the area: in July, the humidity in the afternoon rises to 23%, compared with 10% in Baghdad and 11% in Nasiriya. Instead, the sea has a limited influence: since the prevailing wind blows from the north-west, even in Al-Faw, located on the coast, the air in summer is often dry.
The
Persian Gulf is very cool for swimming in winter, while it becomes very warm in summer, since it exceeds 30 °C (86 °F) for a few months.
The
south-western area of Iraq has a desert climate, and it's the driest area of the country; in fact, precipitation drops to about 50 mm (2 in) per year. In this area, there are practically no settlements because the population is concentrated since ancient times in Mesopotamia, the valley between the two rivers, Euphrates and Tigris.
When to go
As regards to the temperatures, the best times to visit Iraq are
spring and autumn: in the north (see Mosul, Sulaymaniyah), below 1,000 meters (3,300 feet), the best months are April and from mid-October to mid-November, while in the center and south (see Baghdad, Basra), they are March and November: in this way, you avoid both the scorching heat of summer and the possible cold in winter. Sometimes, however, in these periods, it can rain, especially in the north.
In May and October, the temperatures are already well above 30 °C (86 °F) and can already approach 40 °C (104 °F); on the other hand, it almost never rains.
What to pack
In
winter: in the north and north-west (Mosul, Nineveh, Rutbah), bring warm clothes, a jacket, a hat, a raincoat or umbrella, and a scarf; in the mountains of Kurdistan, bring mountain clothing with warm boots; in the center and south (Baghdad, Basra), spring/autumn clothes, a jacket and a sweater, and a hat for cold nights.
In
summer: in the whole country at low altitude, from north to south, bring lightweight, loose-fitting, light-colored clothing; light and long shirts and pants of natural fibers (cotton, linen), a sun hat, and a desert turban; in the north and north-west (Mosul, Nineveh, Rutbah), you can bring a light sweatshirt for the night and early morning. In the mountains of Kurdistan, light clothes for the day, a sun hat or desert turban, a sweatshirt or sweater for the evening, a jacket for the highest peaks, and hiking shoes.
Climate data - Iraq
| Ar Rutbah (600 meters) |
|---|
|
| Jan | Feb | Mar | Apr | May | Jun | Jul | Aug | Sep | Oct | Nov | Dec |
|---|
| Min temp. | 3 | 4 | 8 | 13 | 18 | 22 | 24 | 24 | 21 | 16 | 8 | 4 |
|---|
| Max temp. | 14 | 16 | 21 | 27 | 32 | 37 | 39 | 40 | 36 | 30 | 21 | 16 |
|---|
| Precip. | 15 | 20 | 15 | 10 | 10 | 0 | 0 | 0 | 0 | 15 | 20 | 10 |
|---|
| Prec. days | 6 | 6 | 6 | 5 | 3 | 1 | 0 | 0 | 0 | 3 | 4 | 5 |
|---|
|
|
|
|
| Baghdad |
|---|
|
| Jan | Feb | Mar | Apr | May | Jun | Jul | Aug | Sep | Oct | Nov | Dec |
|---|
| Min temp. | 5 | 6 | 10 | 16 | 21 | 25 | 27 | 26 | 22 | 17 | 10 | 6 |
|---|
| Max temp. | 16 | 19 | 24 | 30 | 37 | 42 | 45 | 44 | 40 | 34 | 24 | 18 |
|---|
| Precip. | 25 | 15 | 15 | 15 | 5 | 0 | 0 | 0 | 0 | 10 | 25 | 15 |
|---|
| Prec. days | 5 | 5 | 6 | 4 | 2 | 0 | 0 | 0 | 0 | 1 | 5 | 6 |
|---|
|
|
| Sun hours | 6 | 7 | 8 | 8 | 10 | 12 | 11 | 11 | 10 | 9 | 7 | 6 |
|---|
|
| Basra |
|---|
|
| Jan | Feb | Mar | Apr | May | Jun | Jul | Aug | Sep | Oct | Nov | Dec |
|---|
| Min temp. | 8 | 10 | 14 | 20 | 26 | 29 | 31 | 30 | 26 | 22 | 14 | 10 |
|---|
| Max temp. | 19 | 22 | 27 | 33 | 40 | 45 | 47 | 47 | 43 | 37 | 27 | 20 |
|---|
| Precip. | 25 | 20 | 20 | 15 | 5 | 0 | 0 | 0 | 0 | 5 | 20 | 25 |
|---|
|
|
|
|
|
| Kirkuk (350 meters) |
|---|
|
| Jan | Feb | Mar | Apr | May | Jun | Jul | Aug | Sep | Oct | Nov | Dec |
|---|
| Min temp. | 5 | 6 | 11 | 15 | 21 | 26 | 29 | 29 | 25 | 20 | 12 | 7 |
|---|
| Max temp. | 14 | 16 | 21 | 27 | 34 | 41 | 44 | 44 | 39 | 32 | 23 | 17 |
|---|
| Precip. | 65 | 55 | 50 | 40 | 15 | 0 | 0 | 0 | 0 | 15 | 45 | 55 |
|---|
| Prec. days | 11 | 11 | 11 | 9 | 5 | 0 | 0 | 0 | 0 | 5 | 7 | 10 |
|---|
|
|
|
|
| Mosul |
|---|
|
| Jan | Feb | Mar | Apr | May | Jun | Jul | Aug | Sep | Oct | Nov | Dec |
|---|
| Min temp. | 3 | 4 | 8 | 12 | 17 | 22 | 25 | 25 | 20 | 15 | 8 | 4 |
|---|
| Max temp. | 13 | 15 | 20 | 26 | 33 | 40 | 43 | 43 | 38 | 32 | 22 | 15 |
|---|
| Precip. | 60 | 55 | 60 | 45 | 20 | 0 | 0 | 0 | 0 | 15 | 40 | 60 |
|---|
| Prec. days | 11 | 11 | 12 | 9 | 6 | 0 | 0 | 0 | 0 | 5 | 7 | 10 |
|---|
|
|
| Sun hours | 5 | 6 | 7 | 8 | 10 | 12 | 12 | 12 | 11 | 9 | 7 | 7 |
|---|
|
| Najaf |
|---|
|
| Jan | Feb | Mar | Apr | May | Jun | Jul | Aug | Sep | Oct | Nov | Dec |
|---|
| Min temp. | 6 | 8 | 13 | 18 | 24 | 28 | 30 | 29 | 26 | 20 | 13 | 8 |
|---|
| Max temp. | 17 | 20 | 26 | 32 | 38 | 43 | 45 | 45 | 41 | 35 | 25 | 19 |
|---|
| Precip. | 15 | 10 | 10 | 15 | 5 | 0 | 0 | 0 | 0 | 5 | 20 | 15 |
|---|
|
|
|
|
|
| Nasiriya |
|---|
|
| Jan | Feb | Mar | Apr | May | Jun | Jul | Aug | Sep | Oct | Nov | Dec |
|---|
| Min temp. | 7 | 9 | 14 | 19 | 25 | 28 | 30 | 29 | 26 | 21 | 13 | 9 |
|---|
| Max temp. | 18 | 21 | 27 | 33 | 40 | 44 | 46 | 46 | 43 | 36 | 26 | 20 |
|---|
| Precip. | 20 | 15 | 20 | 15 | 5 | 0 | 0 | 0 | 0 | 5 | 25 | 20 |
|---|
|
|
|
| Sun hours | 7 | 8 | 9 | 8 | 10 | 11 | 10 | 11 | 10 | 9 | 8 | 7 |
|---|
|
| Sulaymaniyah (850 meters) |
|---|
|
| Jan | Feb | Mar | Apr | May | Jun | Jul | Aug | Sep | Oct | Nov | Dec |
|---|
| Min temp. | -1 | 1 | 4 | 7 | 12 | 18 | 22 | 22 | 17 | 12 | 5 | 2 |
|---|
| Max temp. | 12 | 14 | 18 | 23 | 31 | 38 | 42 | 42 | 37 | 30 | 20 | 14 |
|---|
| Precip. | 130 | 145 | 130 | 100 | 40 | 0 | 0 | 0 | 0 | 15 | 75 | 110 |
|---|
|
|
|
|
|
See also the
temperatures month by month