Select units of measurement for the temperature and rainfall tables (metric or imperial).
Average weather, temperature, rainfall, sunshine
In Oman, an Asian country located in the southeastern part of the Arabian Peninsula, the climate is
tropical desert almost everywhere. However, there are also mountains, where the climate is subtropical semi-arid.
In much of the country, at least at low altitudes, the winter, from December to February, is pleasantly warm, while the long summer, from April to October, is very hot.
The rare
rains mostly occur from December to April in the north. Instead, from June to September, the
monsoon brings some rain to the northern and southern mountainous areas, and some cloudiness and a drop in temperature along the southern coast.
The monsoon, from mid-June to mid-September, is due to wet currents blowing from the southwest towards the Asian continent, and brings limited effects in terms of rain, but it's nonetheless able to influence the climate of the country.
The climate in detail
North coast
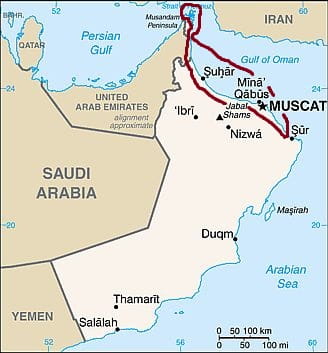
In the north, along the coast of the
Gulf of Oman, the climate is desert, sunny all year-round, with a few winter rains, more likely in the far north, ie the Musandam Peninsula, an exclave of Oman in the United Arab Emirates (see
Khasab), where 45/50 millimeters (1.8/2 inches) of rain fall per month from January to March.
The
summer is very hot, with highs close to 40 °C (104 °F) on average, and the humidity of the sea that makes the heat oppressive. When the wind blows from inland, the humidity drops, but the temperature can get close to as high as 50 °C (122 °F).
The
winter is pleasant, with a daily average around 20 °C (68 °F) in the far north and 21 °C (70 °F) in
Muscat, the capital.
In contrast to the northern tip, along the northern coast (called
Al Batinah), where
Muscat is located,
the hottest month is June, with 30 °C (86 °F) as minimum temperature and almost 40 °C (104 °F) as maximum, while in July and August, cloud banks brought by the southwest monsoon can slightly lower the daytime temperature. On the other hand, the humidity increases, going from 50% in June to 70% in August.
Rainfall in Muscat is definitely scarce, in fact, it amounts to 90 millimeters (3.5 inches) per year. In summer, despite the southwest monsoon, it almost never rains.
The sun in Muscat shines all year round, however, the sunshine hours slightly decrease in July and August.
The Gulf of Oman is warm enough for swimming all year round, and it becomes very warm in summer.
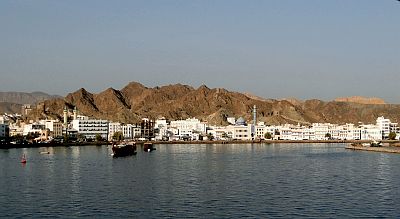
Hajar Mountains
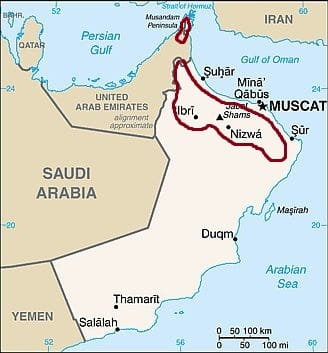
In the
mountains located near the northern coast, called
Al Hajar, and culminating in Jebel Shams, 3,009 meters (9,872 feet) high, the south-west monsoon brings a bit of rain, which added to the relatively poor rains (and sometimes even snowfalls) of winter, raises the total of the year in some areas above 200/300 mm (8/12 in), still not much, but sufficient for the growth of some shrubs or drought-resistant plants.
In
Saiq, at almost 2,000 meters (6,500 feet) above sea level, the average temperature in January is 10.5 °C (51 °F), so it is quite low, with possible frosts at night. In June and July, highs are around 29/30 °C (84/86 °F). On the contrary, at lower altitudes, the summer heat is intense.
On average, 310 millimeters (12 inches) of rain fall per year, with a relative maximum in summer.
In this area, in the valleys around 500 meters (1,650 ft) above sea level, and therefore with an arid and torrid climate in summer, there are cities such as
Nizwa and Bahla.
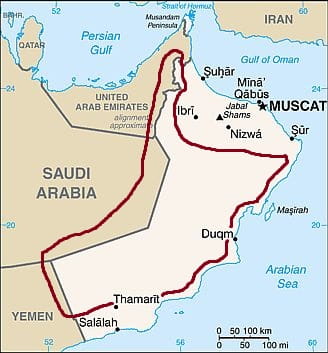
In the Musandam Peninsula too, there are mountains (see the small circle at the top of the map), whose highest point is
Jebel Al Harim, 2,087 meters (6,847 feet) high, but they are desert because in summer they do not receive any rainfall.
East coast
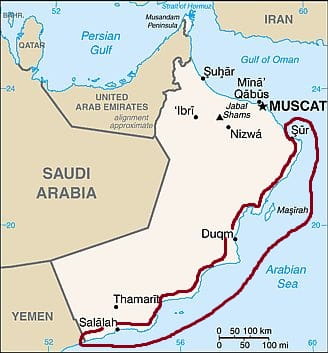
Along the
coast of the Arabian Sea the climate is desert. Winter becomes progressively warmer as you move south, while summer becomes less hot, but also more humid and cloudy because of the greater influence of the south-west monsoon (called
Khareef). A moderate wind often blows, making the sea choppy.
However, there may be periods, which generally last two or three days, in which the wind blows from inland, often accompanied by sandstorms, and in which there are
sudden increases in temperature, especially from April to July, when it can exceed 40 °C (104 °F). These events are more likely in the northern part of the coast, while in the south, the coast of Dhofar is more sheltered from these hot winds.
On the island of
Masirah, the temperature is high even in winter, with highs of 27/28 °C (81/82 °F). In this season, it rarely rains and the sun shines.
The temperature gradually increases until April, May, and June, when it reaches 35/36 °C (95/97 °F), then it goes back to 31/32 °C (88/90 °F) in July and August, when humidity and cloudiness increase, even though the rainfall remains scarce.
In a typical year, only 40 mm (1.6 in) of rain fall.
The sun in Masirah regularly shines throughout the year, except in the summer months, when cloud banks can reach the area.
However, the effects of the monsoon are more evident in the southern part of the coast.
In
Salalah, the capital of Dhofar, winter is warm. The daytime temperature reaches 32/33 °C (90/91 °F) in May and June, but then it goes down to 27/28 °C (81/82 °F) in July and August. In the latter period, even a bit of rain falls, just 20/25 mm (0.8/1 in) per month, in the form of frequent drizzle. In addition, in July and August, a permanent
layer of clouds and fog hangs over this part of the coast; for this reason, the daily temperature range is narrow.
Rainfall does not even reach 100 mm (4 in) per year, and even in July and August, there are "officially" only 7/8 days of rain per month, however, in this period, days with light drizzle occur more often.
The sun in Salalah normally shines in the other seasons, but it practically disappears in July and August.
The Arabian Sea is warm enough for swimming all year round, and it is warmer in spring and autumn, while in summer, the water temperature drops a bit because the wind increases evaporation and mixes the water layers.
Southern mountains

In the
southern coastal range of the Dhofar region, north of Salalah, the climate is cooled by altitude. Also, the summer monsoon is able to release a bit of rain, so much so that
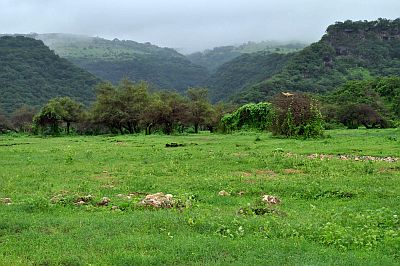
the landscape is green, at least along the slopes facing southwest and during the rainy season.
At 700/1,000 meters (2,300/3,300 feet) above sea level, for instante in
Qairoon Hairitti, located at 850 meters (2,800 ft) above sea level, the temperatures are mild in winter, around 21/22 °C (70/72 °F) during the day, and also in summer, when they are around 22/23 °C (72/73 °F), while in spring and autumn, they are higher, around 29/30 °C (84/86 °F).
In summer, the rains are usually light, but they occur almost daily.
The desert
In the vast
inland desert area, which covers most of the country, the climate is desert, mild in winter (with cool nights and warm days) and scorching in summer, with average highs regularly above 40 °C (104 °F), but with peaks around as high as 50 °C (122 °F). In summer, however, some cloudiness can form here as well, and there's a slight decrease in the maximum temperatures in July and August, but generally, it doesn't rain.
In the
Fahud oil field, located in the north-central of the country, daytime temperatures are 26.5 °C (80 °F) in January, while they reach 44/45 °C (111/113 °F) in June and July.
Tropical cyclones
Every now and then, Oman can be reached by
tropical cyclones coming from the Arabian Sea, which bring strong winds and torrential rainfall.
For example, this happened with the cyclones: Gonu in early June 2007, Phet in early June 2010, Keila in early November 2011, Mekunu in May 2018, and Shaheen in early October 2021.
Cyclones form from May to December, and are more frequent at the beginning of the period (May-June) and a little less at the end (October-December).
When to go
The best time to visit Oman, to go on excursions to the desert and the mountains, or to stroll around the cities, is winter,
from December to February. It is a sunny period, pleasantly warm on the coast and quite warm in the desert during the day, but cool at night, and even cold in the mountains. However, in December, especially in the first half, tropical cyclones are still possible.
For a beach holiday, as mentioned above, the
sea is warm all year round. The air temperature is good in the period from November to March, but in November, there is still some risk of cyclones on the coast of the Arabian Sea, while in January, the temperature can sometimes be a bit cool on the coast of the Gulf of Oman, at least for those who are sensitive to cold.
What to pack
In
winter: in Muscat and the north, bring light clothes for the day, a sweater and a jacket for the evening and for cool days, and a scarf for the wind. For high mountains, bring spring/autumn clothes, and a sweater and a jacket for the evening. For the desert, light clothes for the day, a scarf or turban, desert boots or sandals, and a sweater or jacket for the evening and early morning. For the Arabian Sea coast (see Salalah and Masirah), light clothing, and a sweatshirt for the evening. For the southern coastal mountain range, light clothes for the day, and a sweater and a jacket for the evening.
When going to the reef, you can bring snorkeling equipment, including water shoes or rubber-soled shoes.
In
summer: in Muscat, the north and the desert, bring loose-fitting, lightweight clothes, made of natural fabric (cotton or linen), a desert turban, and a sweater and a scarf for air conditioned places. For high mountains, bring light clothes, a sun hat, and a sweatshirt for the evening. For the Arabian Sea coast (see Salalah and Masirah), light clothes, a light sweatshirt and a scarf for the breeze, and a light raincoat. For the southern coastal mountain range, spring/autumn clothes, a light jacket and a sweatshirt, and a raincoat.
It's better for women to avoid shorts and miniskirts outside tourist resorts.
Climate data - Oman
| Fahud |
|---|
|
| Jan | Feb | Mar | Apr | May | Jun | Jul | Aug | Sep | Oct | Nov | Dec |
|---|
| Min temp. | 12 | 14 | 18 | 22 | 26 | 28 | 29 | 28 | 26 | 22 | 18 | 14 |
|---|
| Max temp. | 27 | 29 | 33 | 38 | 43 | 44 | 45 | 43 | 41 | 38 | 32 | 28 |
|---|
| Precip. | 0 | 0 | 0 | 5 | 5 | 0 | 0 | 0 | 0 | 0 | 0 | 0 |
|---|
|
|
|
|
|
| Masirah |
|---|
|
| Jan | Feb | Mar | Apr | May | Jun | Jul | Aug | Sep | Oct | Nov | Dec |
|---|
| Min temp. | 19 | 20 | 22 | 25 | 27 | 26 | 24 | 24 | 24 | 24 | 23 | 21 |
|---|
| Max temp. | 27 | 28 | 30 | 34 | 36 | 35 | 32 | 31 | 31 | 32 | 30 | 28 |
|---|
| Precip. | 5 | 0 | 10 | 5 | 0 | 0 | 10 | 0 | 0 | 0 | 5 | 0 |
|---|
| Prec. days | 1 | 1 | 1 | 0 | 0 | 1 | 1 | 1 | 0 | 0 | 0 | 1 |
|---|
| Humidity | 65% | 66% | 66% | 65% | 69% | 74% | 77% | 78% | 77% | 71% | 69% | 67% |
|---|
| Day length | 11 | 12 | 12 | 13 | 13 | 13 | 13 | 13 | 12 | 12 | 11 | 11 |
|---|
| Sun hours | 9 | 9 | 10 | 10 | 11 | 9 | 8 | 8 | 9 | 10 | 10 | 9 |
|---|
| Sea temp | 24 | 24 | 26 | 28 | 28 | 28 | 25 | 24 | 25 | 27 | 27 | 26 |
|---|
| Muscat |
|---|
|
| Jan | Feb | Mar | Apr | May | Jun | Jul | Aug | Sep | Oct | Nov | Dec |
|---|
| Min temp. | 17 | 18 | 20 | 24 | 29 | 30 | 30 | 28 | 27 | 24 | 21 | 18 |
|---|
| Max temp. | 25 | 26 | 29 | 34 | 39 | 40 | 37 | 36 | 35 | 35 | 30 | 27 |
|---|
| Precip. | 15 | 15 | 15 | 10 | 0 | 10 | 5 | 0 | 0 | 0 | 0 | 15 |
|---|
| Prec. days | 2 | 3 | 2 | 1 | 0 | 1 | 1 | 1 | 0 | 0 | 0 | 2 |
|---|
| Humidity | 63% | 61% | 58% | 47% | 39% | 51% | 65% | 71% | 67% | 57% | 61% | 64% |
|---|
| Day length | 11 | 11 | 12 | 13 | 13 | 14 | 13 | 13 | 12 | 12 | 11 | 11 |
|---|
| Sun hours | 9 | 9 | 9 | 10 | 11 | 11 | 9 | 9 | 10 | 10 | 10 | 9 |
|---|
| Sea temp | 24 | 24 | 25 | 27 | 30 | 31 | 31 | 30 | 29 | 29 | 28 | 25 |
|---|
| Qairoon (850 meters) |
|---|
|
| Jan | Feb | Mar | Apr | May | Jun | Jul | Aug | Sep | Oct | Nov | Dec |
|---|
| Min temp. | 13 | 14 | 17 | 20 | 21 | 22 | 20 | 20 | 19 | 19 | 18 | 14 |
|---|
| Max temp. | 21 | 23 | 26 | 29 | 30 | 29 | 23 | 22 | 26 | 28 | 26 | 22 |
|---|
| Precip. | 0 | 0 | 5 | 0 | 30 | 10 | 40 | 30 | 15 | 5 | 0 | 0 |
|---|
|
|
|
|
|
| Saiq (2,000 meters) |
|---|
|
| Jan | Feb | Mar | Apr | May | Jun | Jul | Aug | Sep | Oct | Nov | Dec |
|---|
| Min temp. | 6 | 7 | 10 | 14 | 18 | 20 | 21 | 20 | 18 | 14 | 9 | 7 |
|---|
| Max temp. | 15 | 17 | 20 | 24 | 28 | 30 | 31 | 29 | 27 | 24 | 19 | 17 |
|---|
| Precip. | 20 | 30 | 35 | 30 | 20 | 15 | 45 | 50 | 30 | 15 | 10 | 10 |
|---|
| Prec. days | 2 | 3 | 3 | 2 | 2 | 3 | 4 | 4 | 2 | 1 | 1 | 1 |
|---|
|
|
|
|
| Salalah |
|---|
|
| Jan | Feb | Mar | Apr | May | Jun | Jul | Aug | Sep | Oct | Nov | Dec |
|---|
| Min temp. | 19 | 20 | 22 | 25 | 27 | 28 | 25 | 24 | 25 | 23 | 22 | 21 |
|---|
| Max temp. | 27 | 28 | 30 | 32 | 33 | 32 | 28 | 27 | 29 | 31 | 31 | 29 |
|---|
| Precip. | 0 | 0 | 5 | 5 | 10 | 10 | 20 | 25 | 10 | 5 | 0 | 5 |
|---|
| Prec. days | 0 | 2 | 0 | 1 | 1 | 3 | 7 | 8 | 3 | 0 | 0 | 0 |
|---|
| Humidity | 50% | 53% | 58% | 66% | 72% | 79% | 87% | 88% | 79% | 64% | 55% | 49% |
|---|
| Day length | 11 | 12 | 12 | 12 | 13 | 13 | 13 | 13 | 12 | 12 | 11 | 11 |
|---|
| Sun hours | 9 | 9 | 10 | 10 | 11 | 7 | 1 | 1 | 6 | 10 | 10 | 10 |
|---|
| Sea temp | 25 | 25 | 26 | 28 | 29 | 28 | 25 | 24 | 26 | 28 | 28 | 26 |
|---|
See also the
temperatures month by month