Select units of measurement for the temperature and rainfall tables (metric or imperial).
Average weather, temperature, rainfall, sunshine
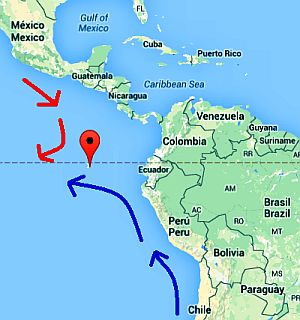
The Galápagos Islands, located in the Pacific Ocean, about a thousand kilometers (600 miles) west of Ecuador, have a peculiar climate,
tropical and semi-arid, with a hot, relatively rainy season from January to May and a cool, dry, cloudy, and misty season, from July to November.
The landscapes are barren, except in the highlands of the largest islands, which receive more abundant rainfall.
As was already noted by Charles Darwin, who, as we know, stayed on the islands and was intrigued by the peculiarities of the species living there, their climate is
cooler than one would expect from a place located near the Equator.
This is due to the
Humboldt Current, which reaches the area after flowing in the ocean to the west of South America.
However, there are
different sea currents that meet or take turns in the area; in fact, there is also a warm current coming from Central America, which runs at no great distance and is more active in
El Niño years (vedi sotto).
Therefore, the climate of the Galápagos is
variable from one year to another, besides, the weather is difficult to predict.

The climate in detail
The seasons
On these islands, as mentioned, there are
two seasons: a warm season from January to May, with maximum temperatures around 29/30 °C (84/86 °F), and a relatively cool season from July to November, called
Garúa, with daytime temperatures around 26/27 °C (79/81 °F). December and June are transition months.
In the relatively cool period from July to November, night-time temperatures remain acceptable, around 20/21 °C (68/70 °F), but a
moderate southerly wind blows, in addition, there are often
mists, which cause the condensation of tiny droplets (called
garúa from which the season takes its name), and the sky is often covered with low clouds (due to the thermal inversion generated by the cool sea current).
This period is
the driest of the year on coasts and plains (because the
Garúa does not produce significant rainfall accumulation), while on inland hills and mountains, there can be some real rains. The highest peak is the
Volcán Wolf, 1,707 meters (5,600 feet) high, situated on Isabela Island.
The warm season, from January to May, is instead the
rainiest period, but the rains are normally not abundant, and in any event, they occur in the form of showers, which do not overshadow too much the sun.
The rainiest month is March.
The hottest period is from February to April, when the wind is also weaker.
Temperature and rainfall

In
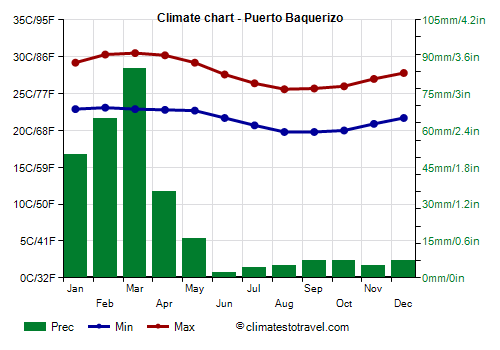
Puerto Baquerizo Moreno, the capital, located on the island of San Cristóbal, the average temperature ranges from around 26.5 °C (79.5 °F) in the hottest period, from February to April, to 22.7 °C (73 °F) in the coolest period, in August and September.
On the coasts, the rainfall amounts to less than 500 millimeters (20 inches) per year, so it's not abundant.
In Puerto Baquerizo, we can notice that in the dry season, a few millimeters (a few tenths of an inch) per month accumulate, mostly because of drizzle and dew formation.
However, tourists flock to the beaches during the rainy period, since in addition to being the sunniest, it is the one in which the sea is the warmest.
El Niño
It must be said that
the rains are irregular, and can become more abundant in
El Niño years, during which the Humboldt current slows down or stops altogether.
During the most intense El Niño years, such as in 1982-83, in 1997-98 and in 2015-2016, the climate on these islands
becomes fully tropical, with higher temperatures and abundant rainfall. In 2016, the temperature in Puerto Baquerizo reached 34 °C (93 °F) in February and March, and 34.5 °C (94 °F) in April.
In contrast, in
La Niña years, during which the cool current becomes even more intense, the rains become scarcer, and there's a decrease in both air and sea temperature.

Sunshine
All in all, the
sun at the Galápagos shines for a good number of hours in the hot and relatively rainy period. Instead, paradoxically, in the cool period, the sun shines less often, due to the already mentioned clouds and mists that form in this period.
Sea temperature
The
sea at the Galápagos is warm enough for swimming from January to May (when it's also calmer), when the water temperature ranges from 24.5 °C to 26.5 °C (76 to 79.5 °F), while it becomes a little cool from July to November, when it drops to around 22/23 °C (72/73 °F).
When to go
In general, you can visit the Galápagos all year round. However, the best time to visit the islands, if you also want to swim and sunbathe, runs from
February to May, since it is the warmest and sunniest, although there may be some downpours or thunderstorms in the afternoon.
The cool season, from July to November, can be recommended to explore nature, since it almost never rains in the plains and the temperature is pleasant, even though you have to take into account mists, haze, and cloudy skies.
From September to November, the sea can be a bit choppy, and this can disturb those who suffer from motion sickness, during boat trips between the islands.
What to pack
From
December to May (warm period): bring light clothing, a light sweatshirt for the evening, a light raincoat or umbrella for rain showers, and a sun hat (after all, we are at the Equator). When going hiking on inland hills and the Volcán Wolf, you need a sweatshirt a bit warmer and a raincoat, and hiking shoes.
From
June to November (cool period): bring light clothes, a sweatshirt or sweater and a light jacket for the evening. When going hiking in inland hills and the Volcán Wolf, bring hiking boots, a sweatshirt, and raincoat.
When going to the reef, you can bring snorkeling equipment, including water shoes or rubber-soled shoes.
Climate data - Galapagos
| Puerto Baquerizo |
|---|
|
| Jan | Feb | Mar | Apr | May | Jun | Jul | Aug | Sep | Oct | Nov | Dec |
|---|
| Min temp. | 23 | 23 | 23 | 23 | 23 | 22 | 21 | 20 | 20 | 20 | 21 | 22 |
|---|
| Max temp. | 29 | 30 | 30 | 30 | 29 | 28 | 26 | 26 | 26 | 26 | 27 | 28 |
|---|
| Precip. | 50 | 65 | 85 | 35 | 15 | 0 | 5 | 5 | 5 | 5 | 5 | 5 |
|---|
| Prec. days | 9 | 6 | 5 | 4 | 3 | 1 | 3 | 4 | 6 | 6 | 4 | 10 |
|---|
|
| Day length | 12 | 12 | 12 | 12 | 12 | 12 | 12 | 12 | 12 | 12 | 12 | 12 |
|---|
| Sun hours | 6 | 8 | 8 | 8 | 8 | 8 | 6 | 6 | 5 | 5 | 6 | 6 |
|---|
| Sea temp | 25 | 26 | 27 | 26 | 24 | 24 | 23 | 22 | 22 | 22 | 23 | 24 |
|---|