Select units of measurement for the temperature and rainfall tables (metric or imperial).
Average weather, temperature, rainfall, sunshine
In Canada, the climate is
arctic in the northernmost areas,
subarctic in the central areas, and
continental in the south, where the main cities are located. The only exception is, in the south-west, the coast of British Columbia (see Vancouver), facing the Pacific, where the climate is
oceanic, cool and rainy for most of the year.
On the
east coast (Nova Scotia, Newfoundland), facing the Atlantic Ocean, the influence of the sea is reduced because a cold current, the Labrador Current, flows there.
The
sunniest area is that of the Great Prairies, east of the Rocky Mountains (Alberta, Manitoba and Saskatchewan): in cities such as Calgary, Winnipeg, Edmonton and Regina, the sun shines more than 2,300 hours per year. However, southern British Columbia (see Vancouver) is also sunny in summer, and Arctic regions (see Alert) in late spring.
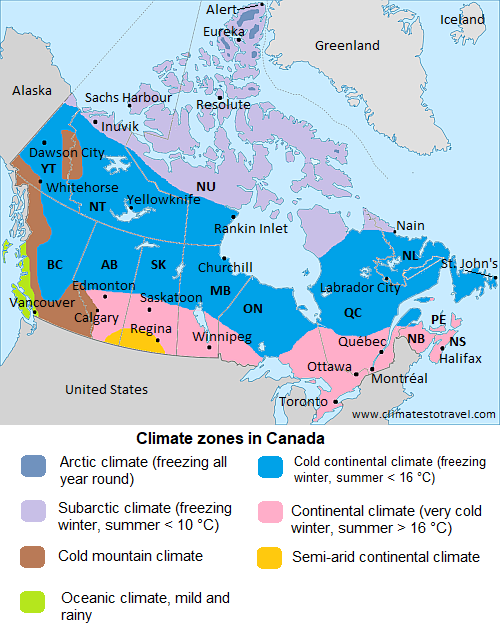
In the following map, we can see the
climate zones in Canada.
The climate in detail
Arctic and subarctic climate
The vast
Arctic and subarctic regions, from the northern islands to the Hudson Bay, experience only two seasons: a long winter, with night temperatures normally around -30/-35 °C (-31/-22 °F), and three summer months, during which the temperature is around or just above freezing. In Arctic areas, the temperature hovers around freezing or rises a few degrees above, while in subarctic areas, it rises above that value but remains on average below 10 °C (50 °F).
In
Alert, in the far north (in the Nunavut Province, at a latitude of 82 ° N, near Greenland), the average temperature ranges from -33 °C (-27.5 °F) in February to 3.5 °C (38.5 °F) in July. Here, only 155 millimeters (6 inches) of rain or snow fall per year.
At these subpolar latitudes, the
sun in winter does not rise for a few months; the sunniest season is clearly the spring, while in summer, even though the sun never sets, the number of cloudy and rainy days increases.
In Canada, the subarctic climate zone extends down to a relatively low latitude: on the shores of the Hudson Bay, you can find tundra vegetation even around the 60th parallel, while in Europe, at the same latitude, there are big cities like Stockholm and Oslo.
In
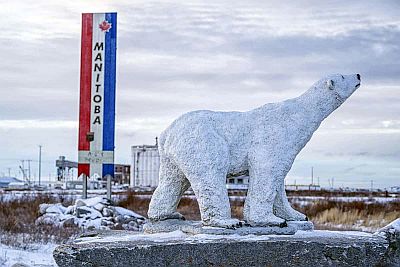
Churchill, Manitoba, located at a latitude of 58° north, in the Hudson Bay, the average temperature ranges from -25 °C (-13.5 °F) in January to 13 °C (55.5 °F) in July. Precipitation is not abundant, since it amounts to 455 mm (18 in) per year; the rainiest season is summer, while in winter, snowfalls are frequent but not abundant.
The Hudson Bay is frozen solid from December to April, while in May, June and November, it can be more or less frozen depending on year.
Northwest
In the northwest, in the provinces of
Yukon and
Northwest Territories, the climate is strongly continental, with a long, cold winter and an intense summer, during which the daytime temperature can sometimes reach 30 °C (86 °F). Summer nights, however, remain cool. Of course, this applies to valleys and hilly areas: high mountains remain obviously cold even in summer.
Precipitation in this area is not abundant, and remains generally below 500 mm (20 in) per year.
In the capital of the Yukon Territory,
Whitehorse, at 700 meters (2,300 ft) above sea level, the average temperature ranges from -15 °C (5 °F) in January to 14.5 °C (58 °F) in July. Precipitation amounts to just 260 mm (10.2 in) per year.
In the northwest,
the lowest temperatures of the entire North American continent have been recorded: on February 3, 1947, in Snag, Yukon, almost 600 meters (2,000 feet) above sea level, on the border with Alaska, the temperature dropped to -63 °C (-81.5 °F). Cold waves like this are due to the proximity to Siberia: when a high pressure system moves over the Pacific Ocean, a "train" of cold air (which in North America is called "Siberian Express") flows from eastern Siberia, and sometimes reaches the mid-west regions of the United States as well.
However, in Snag, the monthly average temperature ranges from -27.5 °C (-17.5 °F) in January to 13.5 °C (56.5 °F) July, when the average maximum is 20 °C (68 °F).
Rocky Mountains
The Rocky Mountains run through western Canada, isolating the rest of the territory from the mild and humid currents of the Pacific. On the western side, the mountains receive large amounts of snow, and there are vast glaciers. Canada's highest peak is Mount
Logan, 5,959 meters (19,551 feet) high, located in the Yukon, near the Alaskan border and belonging to the St. Elias Mountains.
Further south, the
Coast Mountains are located near the coast of British Columbia, and have a very humid and relatively mild climate, with precipitation exceeding 2,000 millimeters (80 inches) per year.
To the east of the Coast Mountains, we find other mountain ranges parallel to the coast, the
Columbia Mountains (in British Columbia) and the
Canadian Rockies (on the border between British Columbia and Alberta).
In
inland areas and on the eastern slopes, precipitation decreases rapidly and drops below 500 mm (20 in) per year; in addition, the climate in this eastern area is continental, with very cold winters.
In
Calgary, at 1,000 meters (3,300 feet) above sea level, the average temperature in January is -6.3 °C (20.7 °F). Summers are mild, with cool nights, while days are pleasant, though there may some hot days, during which the temperature can rise to around 30 °C (86 °F).
Precipitation amounts to 425 mm (16.5 in) per year: it is therefore quite scarce. Summer is the wettest season, due to afternoon thunderstorms, which can be accompanied by hail. On average, 130 cm (51 in) of snow fall per year. It can usually snow from late September to mid-May.
In
Edmonton, more to the north and at 670 meters (2,200 feet), the average temperature in January is -10 °C (14 °F).
During the cold months, in valleys and slopes facing east, the terrible
Blizzard often blows from the north, but sometimes a totally different wind blows, the warm and dry
Chinook, which is similar to the Föhn of the Alps but is even more intense, and can raise the temperature in a spectacular way (by tens of degrees Celsius), so much so that snow can quickly evaporate (or better, sublimate). The Chinook causes such spectacular changes in temperatures because of strong air compression (in fact, the wind descends from very high mountains), but also to the different origin of the air mass (which is much milder because it comes from the Pacific Ocean).
While the Chinook blows at the foot of the mountains, the Blizzard typically blows in the vast prairies and plains of Canada.
Great plains
In the
Midwest plains, from the southern part of the Northwest Territories (see Fort Smith) to the central and southern plains of Saskatchewan and Manitoba (see
Winnipeg, Regina), the climate is strongly continental, with long, cold winters and short summers, when days are warm and nights remain cool, but during which there may also be some hot days.
The average temperatures in January are below -10 °C (14 °F), while those in July are close to 20 °C (68 °F).
The continentality is so strong that in the same place, the temperature can drop below -40 °C (-40 °F) in winter and reach as high as 40 °C (104 °F) in summer.
Precipitation, which has a maximum in summer, is not abundant: west of Winnipeg, it's lower than 500 mm (20 in) per year, and sometimes this region may experience periods of drought.
In winter, the blizzard brings terrifying snow storms.
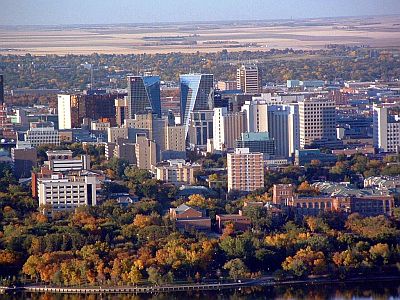
In
Regina, located at the 50th parallel, the average temperature ranges from -14 °C (5.5 °F) in January to 19 °C (66.5 °F) in July.
Precipitation is below 400 mm (15.7 in) per year. Here, too, summer is the rainiest season. On average, one meter (39.5 inches) of snow falls per year. It usually snows from October to the beginning of May.
Pacific coast
On the
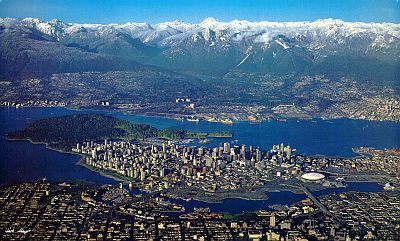
Pacific coast, the climate is oceanic, very different from the rest of the country. Winters are relatively mild but rainy; usually, the temperature is above freezing, even though there can be a few days with snow and frosts almost every year. Summers are cool and fairly sunny, although sometimes it can rain.
Vancouver is the only large city in Canada which is not freezing in winter: the average temperature is 4.5 °C (39.5 °F) in January, and 18.5 °C (65 °F) in July and in August. The climate is more similar to that of London (even though the summer in Vancouver is sunnier) than to that of cold countries.
The sea in Vancouver and along the coast of British Columbia is always cold.
The south
In the Great Lakes region, in the plains of central-southern Ontario and Quebec (see Montréal, Toronto,
Ottawa,
Quebec City), the climate is still continental, but it is also humid, with precipitation around 1,000 mm (40 in) per year, well distributed throughout the year.
During
winter, in the Great Lakes region, cold air masses from the north-west pick up moisture when passing over the Great Lakes, and then collide with warmer air masses coming from the United States; therefore, in this area there are often
waves of bad weather with heavy snowfalls.
Spring comes quite late and is very cool.
Summer is not long and is characterized by rainy, cool days that alternate with hot, sunny days, during which thunderstorms can break out in the afternoon.
In the southern part of Ontario, which is also the southernmost part of the country, during the summer,
hot and muggy days can sometimes occur, when the area is reached by hot air masses from inland areas of the United States: in these cases, the temperature can rise up to 40 °C (104 °F).
In
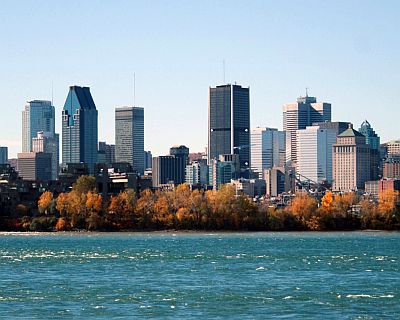
Montreal, which is located at the latitude of southern France, temperatures in winter are similar to those of Moscow, Russia, with an average in January of -9 °C (16 °F), while summers are warm, with an average temperature of 22 °C (71 °F) in July.
In Montreal, 1,000 mm (40 in) of rain or snow fall per year, and there is no dry season.
In
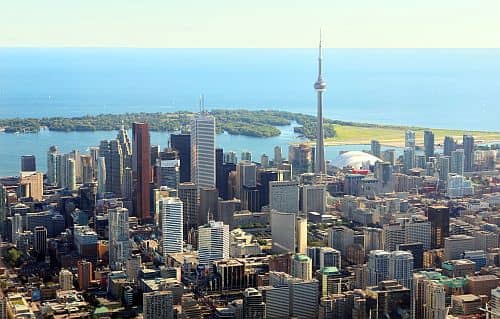
Toronto, Ontario, located further south, winter is less cold: the average in January is -5.5 °C (22 °F), but the temperature drops below -20 °C (-4 °F) for a few days almost every year. Summer in Toronto is similar to that of Montreal, though slightly warmer: days are usually warm, and sometimes even hot, with some chance of thunderstorms, but there can be cool and rainy days as well.
Near Toronto, lake Ontario is very cold in winter, while in summer, it becomes almost acceptable for swimming, at least for those who do not suffer from the cold, especially in August, when it reaches 21 °C (70 °F).
Eastern coasts
The
east coast of Canada (see
New Brunswick,
Nova Scotia,
Newfoundland and Labrador) has a humid climate, cold and snowy in winter, mild and rainy in summer.
In
Halifax, Nova Scotia, the average temperature ranges from -4 °C (25 °F) in January to 19 °C (66 °F) in August.
Precipitation is abundant, since it amounts to 1,450 mm (57 in) per year; in fact, disturbances form in all seasons because of the continuous clash between different air masses.
Being on the coast of the Atlantic ocean and exposed to the south, Halifax can receive southern currents even in mid-winter, which raise the temperature above freezing and bring rainfall.
On the south coast of Nova Scotia, the sea does not freeze in winter, except in the most closed and sheltered bays. In summer, the sea is very cool, if not cold, however, it is definitely milder than in the rest of Canada.
The most eastern and northern coasts of Newfoundland (see
St.John's) are cool or even cold even in midsummer because of the direct influence of the
Labrador Current. Here, the climate is similar to that of the Sakhalin Island and the coast of the Sea of Okhotsk in the Russian Far East, and in summer, it's
cool and foggy.
The clash between the cold sea current and the warmer waters coming from the tropical latitudes of the Atlantic, generates frequent and dense fogs. For this reason, the area of the Grand Banks is the foggiest place on Earth.
When to go
The best time to visit
central and southern Canada, where the major cities are located, is from
late summer to early autumn (i.e. from late August to late September): in this way, you can avoid the climate extremes (both the cold in winter and the possibly hot days in summer), you can find fewer mosquitoes (which, in summer, are a plague in much of the country), and you can enjoy a quiet and often sunny weather (the so-called Indian summer, which sometimes lasts until October).
In addition, in late September, you can admire the spectacular colors of the forests of maples and other species of trees.
The period from
late spring to early summer, i.e. late May to late June, may also be fine.
The
warmest period (July-August) is not to be totally avoided, although it can sometimes be hot, with some afternoon thunderstorms as well.
The worst period, along with midwinter (December to February), is perhaps that of the thaw, which varies depending on year and area, and occurs around April in central and southern Canada: the melting snow turns into mud, and travelling becomes difficult, at least outside the cities.
In the
northern regions of Canada, the summer is the only period when the temperature rises above the melting point, but travelling may be easier when all the land is frozen. At high latitudes, you can see the white nights in June, while beyond the Arctic Circle the sun never sets for a longer or shorter period, depending on latitude.
At Easter, the vast northern territories are still frozen, but the days are already long enough. In winter, especially in December, the days are very short.
What to pack
In
winter, it is necessary to bring clothing for extreme cold conditions, especially for the north, such as synthetic, thermal long underwear, a fleece, a parka, a wind jacket, and warm boots. T-shirts or light shirts are sufficient for overheated indoor environments. For the Vancouver area and the milder west coast, bring warm clothes, a coat, and a raincoat or umbrella.
In
summer, in the major cities of the south, bring light clothing, T-shirts for hot days, a jacket and a sweater for the evening and for cooler days, and a raincoat or umbrella. For the Arctic region and high mountains, and for excursions to the northern seas and glaciers, warm clothes, a warm jacket, gloves, and a raincoat.
Climate data - Canada
| Alert |
|---|
|
| Jan | Feb | Mar | Apr | May | Jun | Jul | Aug | Sep | Oct | Nov | Dec |
|---|
| Min temp. | -34 | -35 | -35 | -27 | -14 | -2 | 1 | -1 | -11 | -21 | -28 | -32 |
|---|
| Max temp. | -27 | -28 | -27 | -19 | -8 | 2 | 7 | 4 | -5 | -14 | -20 | -24 |
|---|
| Precip. | 10 | 5 | 10 | 10 | 10 | 10 | 20 | 20 | 20 | 10 | 10 | 10 |
|---|
| Prec. days | 3 | 2 | 4 | 4 | 4 | 4 | 6 | 5 | 6 | 5 | 4 | 2 |
|---|
| Humidity | 67% | 66% | 66% | 70% | 81% | 86% | 85% | 85% | 85% | 76% | 69% | 67% |
|---|
| Day length | 0 | 0 | 12 | 23 | 24 | 24 | 24 | 24 | 16 | 2 | 0 | 0 |
|---|
| Sun hours | 0 | 0 | 4 | 11 | 14 | 11 | 10 | 9 | 4 | 0 | 0 | 0 |
|---|
|
| Calgary (1,050 meters) |
|---|
|
| Jan | Feb | Mar | Apr | May | Jun | Jul | Aug | Sep | Oct | Nov | Dec |
|---|
| Min temp. | -13 | -12 | -8 | -2 | 3 | 7 | 10 | 9 | 5 | -1 | -8 | -12 |
|---|
| Max temp. | 0 | 2 | 5 | 12 | 18 | 21 | 25 | 24 | 20 | 13 | 5 | 1 |
|---|
| Precip. | 10 | 10 | 15 | 25 | 60 | 80 | 70 | 60 | 45 | 25 | 10 | 10 |
|---|
| Prec. days | 9 | 7 | 9 | 9 | 11 | 13 | 13 | 11 | 9 | 6 | 8 | 7 |
|---|
| Humidity | 63% | 63% | 61% | 55% | 55% | 61% | 61% | 59% | 58% | 59% | 64% | 63% |
|---|
| Day length | 8 | 10 | 12 | 14 | 16 | 16 | 16 | 14 | 12 | 11 | 9 | 8 |
|---|
| Sun hours | 4 | 5 | 6 | 7 | 8 | 9 | 10 | 9 | 7 | 6 | 4 | 4 |
|---|
|
| Churchill |
|---|
|
| Jan | Feb | Mar | Apr | May | Jun | Jul | Aug | Sep | Oct | Nov | Dec |
|---|
| Min temp. | -29 | -28 | -24 | -14 | -5 | 2 | 8 | 8 | 4 | -3 | -16 | -25 |
|---|
| Max temp. | -21 | -20 | -14 | -5 | 3 | 13 | 18 | 17 | 10 | 2 | -8 | -17 |
|---|
| Precip. | 15 | 15 | 15 | 15 | 25 | 40 | 75 | 80 | 75 | 50 | 30 | 15 |
|---|
| Prec. days | 5 | 5 | 4 | 4 | 6 | 7 | 9 | 10 | 11 | 10 | 8 | 5 |
|---|
| Humidity | 68% | 68% | 71% | 78% | 81% | 76% | 76% | 80% | 81% | 84% | 83% | 73% |
|---|
| Day length | 7 | 9 | 12 | 15 | 17 | 18 | 18 | 15 | 13 | 10 | 8 | 6 |
|---|
| Sun hours | 3 | 4 | 6 | 7 | 6 | 8 | 9 | 7 | 4 | 2 | 2 | 2 |
|---|
| Sea temp | -2 | -2 | -2 | -2 | -1 | 0 | 3 | 8 | 7 | 3 | 0 | -2 |
|---|
| Halifax |
|---|
|
| Jan | Feb | Mar | Apr | May | Jun | Jul | Aug | Sep | Oct | Nov | Dec |
|---|
| Min temp. | -10 | -10 | -5 | 0 | 5 | 10 | 14 | 14 | 10 | 5 | 0 | -6 |
|---|
| Max temp. | -1 | -1 | 4 | 9 | 16 | 20 | 24 | 24 | 20 | 14 | 8 | 2 |
|---|
| Precip. | 125 | 110 | 120 | 105 | 110 | 90 | 85 | 90 | 105 | 140 | 160 | 145 |
|---|
| Prec. days | 13 | 11 | 11 | 12 | 10 | 9 | 8 | 8 | 7 | 10 | 12 | 13 |
|---|
| Humidity | 80% | 76% | 74% | 72% | 73% | 75% | 77% | 77% | 79% | 80% | 81% | 83% |
|---|
| Day length | 9 | 10 | 12 | 14 | 15 | 16 | 15 | 14 | 12 | 11 | 10 | 9 |
|---|
| Sun hours | 4 | 5 | 5 | 5 | 6 | 7 | 8 | 7 | 6 | 5 | 4 | 3 |
|---|
| Sea temp | 2 | 0 | 0 | 2 | 5 | 9 | 14 | 17 | 16 | 13 | 9 | 5 |
|---|
| Inuvik |
|---|
|
| Jan | Feb | Mar | Apr | May | Jun | Jul | Aug | Sep | Oct | Nov | Dec |
|---|
| Min temp. | -28 | -27 | -26 | -15 | -3 | 6 | 9 | 6 | 1 | -9 | -21 | -26 |
|---|
| Max temp. | -21 | -20 | -16 | -6 | 6 | 17 | 19 | 15 | 8 | -3 | -14 | -20 |
|---|
| Precip. | 10 | 15 | 10 | 10 | 15 | 15 | 35 | 40 | 30 | 25 | 15 | 15 |
|---|
| Prec. days | 10 | 11 | 11 | 8 | 8 | 8 | 12 | 14 | 13 | 14 | 12 | 10 |
|---|
| Humidity | 68% | 68% | 64% | 66% | 67% | 60% | 67% | 75% | 79% | 84% | 76% | 71% |
|---|
| Day length | 3 | 8 | 12 | 16 | 21 | 24 | 23 | 17 | 13 | 9 | 4 | 0 |
|---|
| Sun hours | 0 | 2 | 6 | 8 | 10 | 13 | 11 | 7 | 4 | 2 | 1 | 0 |
|---|
| Sea temp | -1 | -1 | -1 | -1 | -1 | 2 | 5 | 5 | 4 | 1 | -1 | -1 |
|---|
| Montreal |
|---|
|
| Jan | Feb | Mar | Apr | May | Jun | Jul | Aug | Sep | Oct | Nov | Dec |
|---|
| Min temp. | -14 | -12 | -6 | 1 | 8 | 14 | 17 | 16 | 11 | 4 | -2 | -9 |
|---|
| Max temp. | -5 | -3 | 2 | 11 | 19 | 24 | 27 | 26 | 21 | 13 | 6 | -1 |
|---|
| Precip. | 85 | 65 | 75 | 90 | 85 | 85 | 90 | 95 | 90 | 105 | 85 | 90 |
|---|
| Prec. days | 11 | 9 | 10 | 10 | 10 | 10 | 10 | 9 | 9 | 10 | 11 | 12 |
|---|
| Humidity | 71% | 68% | 64% | 59% | 60% | 65% | 67% | 69% | 71% | 72% | 73% | 76% |
|---|
| Day length | 9 | 10 | 12 | 14 | 15 | 16 | 15 | 14 | 12 | 11 | 10 | 9 |
|---|
| Sun hours | 3 | 5 | 5 | 6 | 7 | 8 | 9 | 8 | 6 | 5 | 3 | 3 |
|---|
|
| Regina (600 meters) |
|---|
|
| Jan | Feb | Mar | Apr | May | Jun | Jul | Aug | Sep | Oct | Nov | Dec |
|---|
| Min temp. | -20 | -18 | -11 | -3 | 4 | 9 | 12 | 11 | 5 | -2 | -10 | -17 |
|---|
| Max temp. | -9 | -6 | 1 | 12 | 19 | 23 | 27 | 27 | 21 | 12 | 1 | -6 |
|---|
| Precip. | 15 | 10 | 20 | 25 | 55 | 75 | 65 | 45 | 35 | 20 | 15 | 15 |
|---|
| Prec. days | 11 | 8 | 9 | 8 | 11 | 14 | 11 | 10 | 9 | 8 | 8 | 11 |
|---|
| Humidity | 78% | 80% | 79% | 63% | 56% | 65% | 68% | 65% | 63% | 70% | 79% | 80% |
|---|
| Day length | 9 | 10 | 12 | 14 | 16 | 16 | 16 | 14 | 12 | 11 | 9 | 8 |
|---|
| Sun hours | 3 | 5 | 5 | 8 | 8 | 9 | 10 | 9 | 7 | 5 | 3 | 3 |
|---|
|
| Toronto |
|---|
|
| Jan | Feb | Mar | Apr | May | Jun | Jul | Aug | Sep | Oct | Nov | Dec |
|---|
| Min temp. | -9 | -9 | -4 | 2 | 8 | 14 | 17 | 16 | 12 | 6 | 0 | -5 |
|---|
| Max temp. | -2 | -1 | 5 | 12 | 20 | 25 | 27 | 26 | 22 | 14 | 8 | 2 |
|---|
| Precip. | 65 | 50 | 50 | 80 | 80 | 85 | 85 | 70 | 85 | 70 | 75 | 60 |
|---|
| Prec. days | 12 | 8 | 9 | 10 | 9 | 9 | 9 | 8 | 8 | 10 | 10 | 10 |
|---|
| Humidity | 74% | 71% | 66% | 62% | 63% | 65% | 66% | 69% | 72% | 75% | 76% | 77% |
|---|
| Day length | 9 | 10 | 12 | 14 | 15 | 15 | 15 | 14 | 12 | 11 | 10 | 9 |
|---|
| Sun hours | 3 | 4 | 5 | 6 | 7 | 9 | 9 | 8 | 6 | 5 | 3 | 3 |
|---|
|
| Vancouver |
|---|
|
| Jan | Feb | Mar | Apr | May | Jun | Jul | Aug | Sep | Oct | Nov | Dec |
|---|
| Min temp. | 1 | 2 | 3 | 6 | 9 | 12 | 14 | 14 | 11 | 7 | 4 | 1 |
|---|
| Max temp. | 7 | 8 | 10 | 13 | 17 | 20 | 22 | 22 | 19 | 14 | 9 | 7 |
|---|
| Precip. | 175 | 90 | 105 | 85 | 60 | 50 | 35 | 35 | 50 | 125 | 175 | 170 |
|---|
| Prec. days | 18 | 13 | 14 | 12 | 10 | 8 | 4 | 5 | 6 | 13 | 17 | 17 |
|---|
| Humidity | 86% | 81% | 78% | 75% | 73% | 72% | 71% | 74% | 79% | 84% | 85% | 86% |
|---|
| Day length | 9 | 10 | 12 | 14 | 15 | 16 | 16 | 14 | 12 | 11 | 9 | 8 |
|---|
| Sun hours | 2 | 3 | 4 | 6 | 7 | 8 | 9 | 9 | 7 | 4 | 2 | 2 |
|---|
| Sea temp | 8 | 8 | 8 | 10 | 12 | 13 | 14 | 14 | 13 | 11 | 9 | 8 |
|---|
| Whitehorse (705 meters) |
|---|
|
| Jan | Feb | Mar | Apr | May | Jun | Jul | Aug | Sep | Oct | Nov | Dec |
|---|
| Min temp. | -19 | -17 | -12 | -4 | 2 | 6 | 8 | 7 | 3 | -3 | -12 | -16 |
|---|
| Max temp. | -11 | -7 | -1 | 7 | 14 | 19 | 20 | 18 | 12 | 4 | -5 | -9 |
|---|
| Precip. | 20 | 15 | 10 | 10 | 15 | 35 | 40 | 40 | 30 | 25 | 25 | 15 |
|---|
| Prec. days | 6 | 5 | 4 | 3 | 4 | 7 | 8 | 8 | 7 | 6 | 7 | 6 |
|---|
| Humidity | 75% | 72% | 61% | 54% | 49% | 53% | 59% | 62% | 67% | 74% | 78% | 77% |
|---|
| Day length | 7 | 9 | 12 | 15 | 18 | 19 | 18 | 16 | 13 | 10 | 7 | 6 |
|---|
| Sun hours | 1 | 4 | 5 | 8 | 8 | 9 | 8 | 7 | 4 | 3 | 1 | 1 |
|---|
|
See also the
temperatures month by month