Select units of measurement for the temperature and rainfall tables (metric or imperial).
Average weather, temperature, rainfall, sunshine hours
Index
Introduction
Nova Scotia's climate is
slightly continental, characterized by very cold, snowy winters and pleasantly warm, quite rainy summers.
Nova Scotia is a maritime province of south-eastern Canada, extended from parallel 43 to parallel 47 north, and is formed by the peninsula of the same name, which is stretched from the continent, and the island of Cape Breton, which is very close to the same peninsula. Then there are several smaller islands.
We are in an area characterized by the continuous clash of air masses, which makes the climate unstable, windy and rainy (and snowy in winter). Furthermore,
fogs are frequent along the coasts, especially the southern one, due to the infiltration of damp air coming from the south (in fact, the Gulf Stream flows not far away).
Precipitation is fairly well distributed throughout the year, and ranges from 1,100 millimeters (43.5 inches) per year on the north coast, to 1,500 mm (59 in) on the south coast, to 2,000 mm (78 in) in the north of Cape Breton island.
Snowfall is abundant: generally, 1 and a half meters (59 in) of snow fall per year on the southern coast, 2 and a half meters (98 in) on the northern one, and up to 4 meters (157 in) in the north of Cape Breton island (see Ingonish). Usually it snows from late November to early April. In winter, snow storms can occur, called "nor'easters" because they are brought by strong winds from the north-east.
In winter, on colder days, the temperature drops to -15 °C (5 °F) even on the coasts, and in colder winters, it can reach lower values. In 1994, the temperature dropped to -29 °C (-20 °F) in Amherst, to -27 °C (-16.5 °F) in Sydney and Halifax, and to -21 °C (-6 °F) in Yarmouth.
In the north, the Northumberland Strait, more closed and exposed to cold sea currents, can freeze in winter.
Since Nova Scotia is exposed to cold currents from the north as well as mild currents from the south, the
winter is not always freezing, but is characterized by variations in temperature. So, in winter, in addition to snow, rain can fall, and the temperature can exceed freezing, and can sometimes go up to 10 °C (50 °F).
In
summer, temperatures are generally pleasant. Hot days, with highs around 30/32 °C (86/90 °F), are rare.

From August to October, Nova Scotia can be reached from time to time by
hurricanes of the Atlantic, which bend towards the north-east after affecting the Caribbean. They are generally weak by the time they reach Nova Scotia because they have to cross a cold sea, however they can still bring abundant rainfall and strong wind. The strongest hurricanes were Ginny in October 1963, Juan in late September 2003, and Fiona in late September 2022.
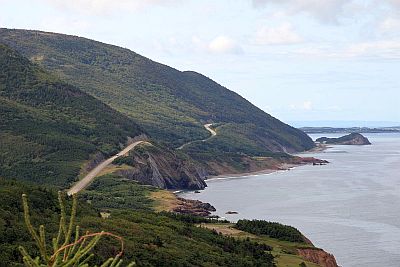
Nova Scotia is a fairly flat province, although in the interior there are hills, called
Highlands, whose highest point is White Hill, 538 meters (1,765 ft) high, located in
Cape Breton Highlands National Park, on Cape Breton island. Warm, fohn-like winds can descend from these hills on the west coast of the island (see Chéticamp, Grand Étang).
In the north-west, in the bay of Fundy, there are the highest tides in the world, around 12 meters (40 ft). From mid-July to early September, whales can be observed in the same bay.
The cities
Sydney

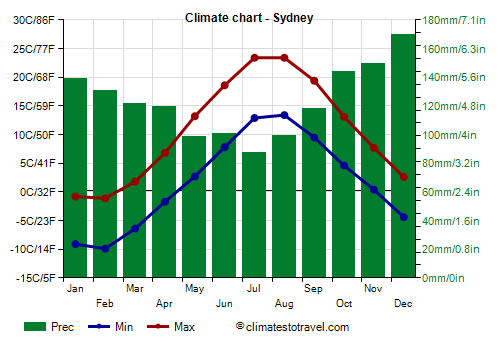
Sydney is located in the north, on the northeastern coast of Cape Breton island.
The
average temperature of the coldest month (February) is of -5.5 °C (22 °F), that of the warmest month (August) is of 18.4 °C (65 °F). Here are the average temperatures.
Sydney - Average temperatures (1991-2020) |
| Month | Min | Max | Mean |
|---|
| January | -9.1 | -0.8 | -5 |
|---|
| February | -9.9 | -1.1 | -5.5 |
|---|
| March | -6.4 | 1.8 | -2.3 |
|---|
| April | -1.7 | 6.8 | 2.6 |
|---|
| May | 2.7 | 13.2 | 8 |
|---|
| June | 7.8 | 18.6 | 13.2 |
|---|
| July | 12.9 | 23.4 | 18.2 |
|---|
| August | 13.4 | 23.4 | 18.4 |
|---|
| September | 9.5 | 19.4 | 14.4 |
|---|
| October | 4.6 | 13.1 | 8.8 |
|---|
| November | 0.4 | 7.7 | 4 |
|---|
| December | -4.4 | 2.6 | -0.9 |
|---|
| Year | 1.7 | 10.7 | 6.2 |
|---|
amounts to 1,480 millimeters (58 inches) per year. On average, 283 cm (111 in) of snow fall per year.
Sydney - Average precipitation| Month | Days |
|---|
| January | 139 | 15 |
|---|
| February | 131 | 12 |
|---|
| March | 121 | 12 |
|---|
| April | 120 | 12 |
|---|
| May | 99 | 11 |
|---|
| June | 101 | 11 |
|---|
| July | 87 | 9 |
|---|
| August | 99 | 9 |
|---|
| September | 118 | 10 |
|---|
| October | 144 | 12 |
|---|
| November | 149 | 13 |
|---|
| December | 170 | 16 |
|---|
| Year | 1480 | 142 |
|---|
On average, there are around 1,820
sunshine hours per year, with a maximum of 7.5/8 hours a day from June to August.
Sydney - Sunshine hours| Month | Average | Total |
|---|
| January | 3 | 90 |
|---|
| February | 4 | 115 |
|---|
| March | 4.5 | 135 |
|---|
| April | 4.5 | 140 |
|---|
| May | 6.5 | 200 |
|---|
| June | 7.5 | 225 |
|---|
| July | 8 | 245 |
|---|
| August | 7.5 | 230 |
|---|
| September | 5.5 | 165 |
|---|
| October | 4 | 130 |
|---|
| November | 2.5 | 75 |
|---|
| December | 2 | 70 |
|---|
| Year | 5 | 1820 |
|---|
In the northern part, the
sea, shallow and closer to Labrador, where a cold current flows, is very cold in winter, but warms up more in summer. In Sydney, the sea temperature fluctuates around 0 °C (32 °F) from February to April, while it reaches 17.5 °C (63.5 °F) in August. So, it never becomes warm for swimming.
Sydney - Sea temperature| Month |
|---|
| January | 1 |
|---|
| February | 0 |
|---|
| March | -0.5 |
|---|
| April | 0.5 |
|---|
| May | 3.5 |
|---|
| June | 9 |
|---|
| July | 14.5 |
|---|
| August | 17.5 |
|---|
| September | 15.5 |
|---|
| October | 11.5 |
|---|
| November | 7"> |
|---|
| December | 3.5 |
|---|
| Year | 7 |
|---|
Amherst

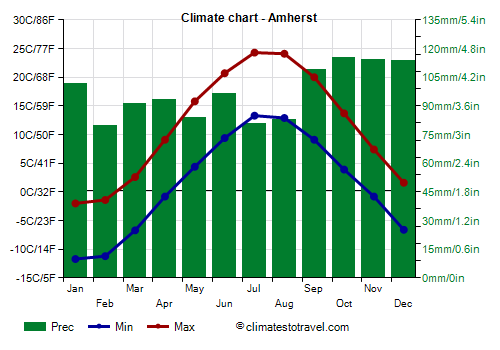
Amherst is located in the north of the peninsula, near the coast (Chignecto bay, which freezes in winter), and on the border with New Brunswick.
The
average temperature of the coldest month (January) is of -6.9 °C (19.6 °F), that of the warmest month (July) is of 18.8 °C (65.8 °F).
Amherst - Average temperatures (1991-2020) |
| Month | Min | Max | Mean |
|---|
| January | -11.7 | -2 | -6.8 |
|---|
| February | -11.2 | -1.4 | -6.3 |
|---|
| March | -6.7 | 2.6 | -2 |
|---|
| April | -0.8 | 9.1 | 4.1 |
|---|
| May | 4.4 | 15.8 | 10.1 |
|---|
| June | 9.4 | 20.7 | 15 |
|---|
| July | 13.3 | 24.3 | 18.8 |
|---|
| August | 12.9 | 24.1 | 18.5 |
|---|
| September | 9.1 | 20 | 14.6 |
|---|
| October | 3.9 | 13.7 | 8.8 |
|---|
| November | -0.8 | 7.4 | 3.3 |
|---|
| December | -6.6 | 1.6 | -2.5 |
|---|
| Year | 1.3 | 11.4 | 6.35 |
|---|
amounts to 1,160 millimeters (45.5 inches) per year. On average, 254 cm (100 in) of snow fall per year.
Amherst - Average precipitation| Month | Days |
|---|
| January | 102 | 12 |
|---|
| February | 80 | 11 |
|---|
| March | 91 | 11 |
|---|
| April | 93 | 12 |
|---|
| May | 84 | 11 |
|---|
| June | 96 | 11 |
|---|
| July | 80 | 10 |
|---|
| August | 83 | 8 |
|---|
| September | 109 | 9 |
|---|
| October | 115 | 11 |
|---|
| November | 114 | 12 |
|---|
| December | 114 | 13 |
|---|
| Year | 1160 | 132 |
|---|
On average, there are around 1,775
sunshine hours per year.
Amherst - Sunshine hours| Month | Average | Total |
|---|
| January | 3 | 95 |
|---|
| February | 4 | 110 |
|---|
| March | 4.5 | 140 |
|---|
| April | 5 | 145 |
|---|
| May | 6 | 185 |
|---|
| June | 7 | 210 |
|---|
| July | 7.5 | 230 |
|---|
| August | 7 | 220 |
|---|
| September | 5.5 | 160 |
|---|
| October | 4 | 130 |
|---|
| November | 2.5 | 75 |
|---|
| December | 2.5 | 80 |
|---|
| Year | 4.9 | 1775 |
|---|
Halifax

Halifax, the capital, is located on the Atlantic coast.
The
average temperature of the coldest month (January) is of -4.2 °C (25 °F), that of the warmest month (August) is of 19 °C (66 °F). Here are the average temperatures.
Halifax - Average temperatures (1991-2020) |
| Month | Min | Max | Mean |
|---|
| January | -10.1 | -1.2 | -5.6 |
|---|
| February | -9.7 | -0.6 | -5.1 |
|---|
| March | -5.4 | 3.5 | -1 |
|---|
| April | -0.3 | 9.2 | 4.4 |
|---|
| May | 4.6 | 15.5 | 10 |
|---|
| June | 9.8 | 20.5 | 15.2 |
|---|
| July | 14.2 | 24.2 | 19.2 |
|---|
| August | 14.1 | 24.2 | 19.2 |
|---|
| September | 10.2 | 20 | 15.1 |
|---|
| October | 4.7 | 13.7 | 9.2 |
|---|
| November | 0 | 7.6 | 3.8 |
|---|
| December | -5.8 | 2.1 | -1.8 |
|---|
| Year | 2.3 | 11.6 | 6.9 |
|---|
amounts to 1,450 millimeters (57.1 inches) per year. On average, 154 cm (60.7 in) of snow fall per year. Here is the average precipitation.
Halifax - Average precipitation| Month | Days |
|---|
| January | 126 | 13 |
|---|
| February | 111 | 11 |
|---|
| March | 120 | 11 |
|---|
| April | 106 | 12 |
|---|
| May | 110 | 10 |
|---|
| June | 90 | 9 |
|---|
| July | 87 | 8 |
|---|
| August | 90 | 8 |
|---|
| September | 107 | 7 |
|---|
| October | 140 | 10 |
|---|
| November | 159 | 12 |
|---|
| December | 147 | 13 |
|---|
| Year | 1395 | 124 |
|---|
On average, there are around 1,960
sunshine hours per year.
Halifax - Sunshine hours| Month | Average | Total |
|---|
| January | 3.5 | 110 |
|---|
| February | 4.5 | 130 |
|---|
| March | 4.5 | 145 |
|---|
| April | 5 | 155 |
|---|
| May | 6 | 195 |
|---|
| June | 7.5 | 220 |
|---|
| July | 7.5 | 235 |
|---|
| August | 7.5 | 225 |
|---|
| September | 6 | 180 |
|---|
| October | 5 | 160 |
|---|
| November | 3.5 | 105 |
|---|
| December | 3.5 | 105 |
|---|
| Year | 5.4 | 1965 |
|---|
The
sea temperature ranges between 0 °C (32 °F) and 16.5 °C (61.5 °F).
Halifax - Sea temperature| Month |
|---|
| January | 2 |
|---|
| February | 0.5 |
|---|
| March | 0.5 |
|---|
| April | 1.5 |
|---|
| May | 4.5 |
|---|
| June | 9.5 |
|---|
| July | 14.5 |
|---|
| August | 16.5 |
|---|
| September | 15.5 |
|---|
| October | 12.5 |
|---|
| November | 9"> |
|---|
| December | 5 |
|---|
| Year | 7.6 |
|---|
Yarmouth

Yarmouth is located in the southwest, on the coast of the Gulf of Maine, in the mildest but also foggiest area of the province.
The
average temperature of the coldest month (January) is of -2.6 °C (27 °F), that of the warmest month (August) is of 17.5 °C (63.5 °F).
Yarmouth - Average temperatures (1991-2020) |
| Month | Min | Max | Mean |
|---|
| January | -6.4 | 1.3 | -2.6 |
|---|
| February | -6.2 | 1.3 | -2.4 |
|---|
| March | -3.3 | 4 | 0.4 |
|---|
| April | 1.2 | 8.8 | 5 |
|---|
| May | 5.7 | 13.9 | 9.8 |
|---|
| June | 9.8 | 18.1 | 14 |
|---|
| July | 13.2 | 21.4 | 17.3 |
|---|
| August | 13.4 | 21.6 | 17.5 |
|---|
| September | 10.5 | 18.8 | 14.6 |
|---|
| October | 6 | 13.6 | 9.8 |
|---|
| November | 1.9 | 9 | 5.4 |
|---|
| December | -2.9 | 4.4 | 0.8 |
|---|
| Year | 3.6 | 11.4 | 7.5 |
|---|
amounts to 1,295 millimeters (51 inches) per year. In a year, 207 cm (81.5 in) of snow fall.
Yarmouth - Average precipitation| Month | Days |
|---|
| January | 124 | 15 |
|---|
| February | 103 | 13 |
|---|
| March | 111 | 11 |
|---|
| April | 101 | 11 |
|---|
| May | 99 | 10 |
|---|
| June | 89 | 8 |
|---|
| July | 78 | 7 |
|---|
| August | 88 | 7 |
|---|
| September | 96 | 7 |
|---|
| October | 119 | 10 |
|---|
| November | 143 | 12 |
|---|
| December | 139 | 14 |
|---|
| Year | 1290 | 124 |
|---|
On average, there are around 1,900
sunshine hours per year. Here are the average sunshine hours per day.
Yarmouth - Sunshine hours| Month | Average | Total |
|---|
| January | 2.5 | 75 |
|---|
| February | 3.5 | 105 |
|---|
| March | 4.5 | 140 |
|---|
| April | 6 | 180 |
|---|
| May | 7 | 215 |
|---|
| June | 7.5 | 220 |
|---|
| July | 7.5 | 230 |
|---|
| August | 7 | 220 |
|---|
| September | 6 | 185 |
|---|
| October | 5.5 | 165 |
|---|
| November | 3.5 | 100 |
|---|
| December | 2.5 | 70 |
|---|
| Year | 5.2 | 1900 |
|---|
On the southwest coast, the
sea is a bit less cold in winter, in fact it drops to 3 °C (37.5 °F) in March, while in summer it remains cold, not exceeding 15 °C (59 °F).
Yarmouth - Sea temperature| Month |
|---|
| January | 5 |
|---|
| February | 3.5 |
|---|
| March | 3 |
|---|
| April | 4 |
|---|
| May | 6 |
|---|
| June | 9.5 |
|---|
| July | 13.5 |
|---|
| August | 15 |
|---|
| September | 14 |
|---|
| October | 12 |
|---|
| November | 9.5"> |
|---|
| December | 7 |
|---|
| Year | 8.5 |
|---|
when to go
The best time to visit Nova Scotia is from June to September, as it is the mildest of the year. July and August are the warmest months.
Back to topSee also the
temperatures by month.