Select units of measurement for the temperature and rainfall tables (metric or imperial).
Average weather, temperature, rainfall, sunshine hours
Index
Introduction
The climate of New Brunswick, a province of eastern Canada, is
continental, with freezing, snowy winters and pleasantly warm summers. Although New Brunswick is a maritime province, facing the sea on two sides (the Gulf of Saint Lawrence to the east and the Bay of Fundy to the south), winter is very cold because air masses generally come from the interior, moreover, a cold current flows in the sea.
During cold spells, the temperature can drop to -30 °C (-22 °F) or even below. In January 1994, it dropped to -35 °C (-31 °F) in Bathurst, and to -31 °C (-24 °F) in Fredericton and Moncton. In summer, hot days, with highs of 30/32 °C (86/90 °F), are possible but quite rare. In 2001, the temperature reached 34 °C (93 °F) in Bathurst, and 35 °C (95 °F) in Fredericton and Moncton.
Precipitation is fairly well distributed throughout the year, and hovers around 1,000/1,100 millimeters (40/43 inches) per year in the center-north, while it reaches 1,200/1,300 mm (47/51 in) on the southern coast. Snowfalls are abundant: generally, 2-3 meters (6.5/10 feet) of snow fall per year, although in Grand Maran, the southernmost island, it drops below 2 meters (6.5 ft).
The province is fairly flat, although in the interior there are hills, the highest point of which is Mount Carleton, 820 meters (2,690 feet) high.
In winter, the sea, in the areas where it is most closed (Chaleur Bay, Northumberland Strait) can be frozen.
From mid-July to early September, whales can be observed in the Bay of Fundy.
In the south, in the bay of Fundy, there are the highest tides in the world, as many as 12 meters (39 feet) high.

The north
Campbellton

Campbellton is located in the far north of the province, on the estuary of the Restigouche River, beyond which is the city of Pointe-à-la-Croix, Quebec.
At
Charlo airport, which is located a little further east, at the mouth of the Bay of Chaleur, the average temperature ranges from -11.5 °C (11.5 °F) in January to 18.5 °C (65.5 °F) in July. Here are the average temperatures.
Charlo - Average temperatures (1991-2020) |
| Month | Min | Max | Mean |
|---|
| January | -16.2 | -7 | -11.6 |
|---|
| February | -15.6 | -5.5 | -10.6 |
|---|
| March | -9.8 | 0 | -4.9 |
|---|
| April | -2.5 | 6.5 | 2 |
|---|
| May | 3.4 | 14.8 | 9.1 |
|---|
| June | 9.2 | 20.5 | 14.8 |
|---|
| July | 13 | 23.8 | 18.4 |
|---|
| August | 12.1 | 23.2 | 17.6 |
|---|
| September | 7.3 | 18.2 | 12.8 |
|---|
| October | 2.1 | 10.7 | 6.4 |
|---|
| November | -3.6 | 3.5 | -0.1 |
|---|
| December | -10.6 | -3 | -6.8 |
|---|
| Year | -0.9 | 8.9 | 4 |
|---|
Precipitation amounts to 1,010 mm (39.8 in) per year.
Charlo - Average precipitation| Month | Days |
|---|
| January | 71 | 11 |
|---|
| February | 65 | 10 |
|---|
| March | 79 | 11 |
|---|
| April | 69 | 11 |
|---|
| May | 92 | 12 |
|---|
| June | 90 | 11 |
|---|
| July | 104 | 12 |
|---|
| August | 82 | 10 |
|---|
| September | 101 | 10 |
|---|
| October | 94 | 11 |
|---|
| November | 87 | 11 |
|---|
| December | 76 | 11 |
|---|
| Year | 1010 | 130 |
|---|
Bathurst
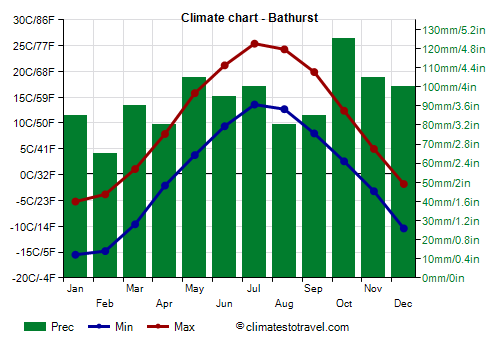
Bathurst is located more to the south than Campbellton, and more directly on the coast.
The
average temperature of the coldest month (January) is of -10.5 °C (13 °F), that of the warmest month (July) is of 19 °C (66 °F).
Bathurst - Average temperatures (1991-2020) |
| Month | Min | Max | Mean |
|---|
| January | -16 | -5.2 | -10.6 |
|---|
| February | -15.1 | -3.7 | -9.4 |
|---|
| March | -9.3 | 1.6 | -3.9 |
|---|
| April | -2 | 8.2 | 3.1 |
|---|
| May | 3.5 | 15.8 | 9.6 |
|---|
| June | 9.2 | 21.8 | 15.5 |
|---|
| July | 13.1 | 25.1 | 19.1 |
|---|
| August | 12.2 | 24.4 | 18.3 |
|---|
| September | 7.3 | 19.7 | 13.5 |
|---|
| October | 1.8 | 12 | 6.9 |
|---|
| November | -3.6 | 4.8 | 0.6 |
|---|
| December | -10.6 | -1.5 | -6 |
|---|
| Year | -0.7 | 10.3 | 4.8 |
|---|
amounts to 1,120 millimeters (44 inches) per year. On average, as high as 333 cm (131 inches) of snow fall per year. Usually it snows from November to April.
Bathurst - Average precipitation| Month | Days |
|---|
| January | 82 | 10 |
|---|
| February | 72 | 8 |
|---|
| March | 87 | 10 |
|---|
| April | 78 | 11 |
|---|
| May | 108 | 12 |
|---|
| June | 99 | 10 |
|---|
| July | 99 | 12 |
|---|
| August | 88 | 10 |
|---|
| September | 88 | 9 |
|---|
| October | 120 | 11 |
|---|
| November | 97 | 10 |
|---|
| December | 100 | 12 |
|---|
| Year | 1120 | 125 |
|---|
On average, there are around 2,155
sunshine hours per year.
Bathurst - Sunshine hours| Month | Average | Total |
|---|
| January | 4 | 125 |
|---|
| February | 5 | 145 |
|---|
| March | 5.5 | 165 |
|---|
| April | 6 | 175 |
|---|
| May | 7.5 | 225 |
|---|
| June | 8.5 | 250 |
|---|
| July | 8.5 | 270 |
|---|
| August | 8 | 250 |
|---|
| September | 6 | 185 |
|---|
| October | 4.5 | 145 |
|---|
| November | 3.5 | 105 |
|---|
| December | 3.5 | 105 |
|---|
| Year | 5.9 | 2155 |
|---|
The
sea temperature ranges between 0 °C (32 °F) and 16 °C (61 °F). So, it never becomes warm for swimming.
Bathurst - Sea temperature| Month |
|---|
| January | 0.5 |
|---|
| February | -0.5 |
|---|
| March | 0 |
|---|
| April | 1 |
|---|
| May | 5 |
|---|
| June | 10 |
|---|
| July | 14.5 |
|---|
| August | 16 |
|---|
| September | 13.5 |
|---|
| October | 10 |
|---|
| November | 6"> |
|---|
| December | 2.5 |
|---|
| Year | 6.6 |
|---|
Edmundston
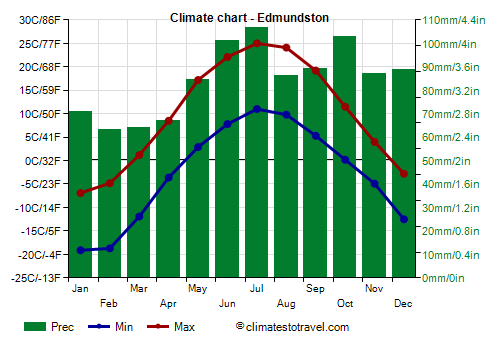
Still in the north, but inland, we find Edmundston. The city is crossed by the Saint John River, which will then pass through Fredericton and will flow into the sea near Saint John.
The
average temperature of the coldest month (January) is of -13 °C (8.5 °F), that of the warmest month (July) is of 18 °C (64.5 °F).
Edmundston - Average temperatures (1991-2020) |
| Month | Min | Max | Mean |
|---|
| January | -19.1 | -6.9 | -13 |
|---|
| February | -18.7 | -4.8 | -11.8 |
|---|
| March | -11.9 | 1.2 | -5.4 |
|---|
| April | -3.6 | 8.5 | 2.4 |
|---|
| May | 2.9 | 17.2 | 10 |
|---|
| June | 7.8 | 22.1 | 15 |
|---|
| July | 11 | 25 | 18 |
|---|
| August | 9.8 | 24.1 | 17 |
|---|
| September | 5.3 | 19.2 | 12.2 |
|---|
| October | 0.2 | 11.5 | 5.8 |
|---|
| November | -4.9 | 4 | -0.5 |
|---|
| December | -12.5 | -2.8 | -7.6 |
|---|
| Year | -2.7 | 9.9 | 3.6 |
|---|
amounts to 1,010 millimeters (39.8 inches) per year. On average, 258 cm (102 inches) of snow fall per year. Usually it snows from November to early April.
Edmundston - Average precipitation| Month | Days |
|---|
| January | 71 | 10 |
|---|
| February | 63 | 9 |
|---|
| March | 64 | 9 |
|---|
| April | 67 | 9 |
|---|
| May | 85 | 10 |
|---|
| June | 101 | 11 |
|---|
| July | 107 | 12 |
|---|
| August | 86 | 10 |
|---|
| September | 89 | 10 |
|---|
| October | 103 | 12 |
|---|
| November | 87 | 10 |
|---|
| December | 89 | 11 |
|---|
| Year | 1010 | 122 |
|---|
On average, there are around 1,860
sunshine hours per year.
Edmundston - Sunshine hours| Month | Average | Total |
|---|
| January | 3 | 85 |
|---|
| February | 4 | 110 |
|---|
| March | 5 | 150 |
|---|
| April | 5.5 | 165 |
|---|
| May | 7 | 210 |
|---|
| June | 7.5 | 230 |
|---|
| July | 8 | 250 |
|---|
| August | 7.5 | 230 |
|---|
| September | 5.5 | 170 |
|---|
| October | 4 | 120 |
|---|
| November | 2.5 | 70 |
|---|
| December | 2 | 65 |
|---|
| Year | 5.1 | 1860 |
|---|
The south
In the south, the climate is not much different from that of the north, however, the winter is a little less cold, while the summer is not much warmer, especially along the coast, where it is actually cooler, due to the influence of the sea.
Fredericton
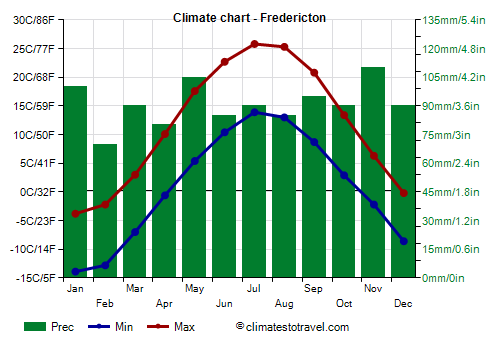
Fredericton, the capital, is located in the south, but in the interior.
The
average temperature of the coldest month (January) is of -9 °C (16 °F), that of the warmest month (July) is of 19.5 °C (67 °F).
Fredericton - Average temperatures (1991-2020) |
| Month | Min | Max | Mean |
|---|
| January | -14.6 | -3.8 | -9.2 |
|---|
| February | -13.9 | -2.3 | -8.1 |
|---|
| March | -7.8 | 3.3 | -2.2 |
|---|
| April | -1.1 | 10.2 | 4.6 |
|---|
| May | 4.7 | 17.6 | 11.2 |
|---|
| June | 9.9 | 22.8 | 16.4 |
|---|
| July | 13.4 | 25.9 | 19.6 |
|---|
| August | 12.3 | 25.3 | 18.8 |
|---|
| September | 7.6 | 20.7 | 14.2 |
|---|
| October | 1.9 | 13.5 | 7.7 |
|---|
| November | -2.9 | 6.3 | 1.7 |
|---|
| December | -9.6 | -0.3 | -5 |
|---|
| Year | 0.1 | 11.7 | 5.85 |
|---|
amounts to 1,020 millimeters (40 inches) per year. On average, 215 cm (85 inches) of snow fall per year. Usually it snows from mid-November to early April.
Fredericton - Average precipitation| Month | Days |
|---|
| January | 86 | 10 |
|---|
| February | 63 | 8 |
|---|
| March | 88 | 10 |
|---|
| April | 77 | 10 |
|---|
| May | 79 | 10 |
|---|
| June | 83 | 9 |
|---|
| July | 94 | 10 |
|---|
| August | 66 | 7 |
|---|
| September | 90 | 7 |
|---|
| October | 106 | 9 |
|---|
| November | 97 | 10 |
|---|
| December | 93 | 10 |
|---|
| Year | 1020 | 108 |
|---|
On average, there are around 1,970
sunshine hours per year.
Fredericton - Sunshine hours| Month | Average | Total |
|---|
| January | 4 | 120 |
|---|
| February | 4.5 | 130 |
|---|
| March | 5 | 150 |
|---|
| April | 5.5 | 160 |
|---|
| May | 6.5 | 205 |
|---|
| June | 7.5 | 225 |
|---|
| July | 7.5 | 240 |
|---|
| August | 7.5 | 225 |
|---|
| September | 5.5 | 170 |
|---|
| October | 4.5 | 140 |
|---|
| November | 3 | 95 |
|---|
| December | 3.5 | 100 |
|---|
| Year | 5.4 | 1975 |
|---|
Moncton
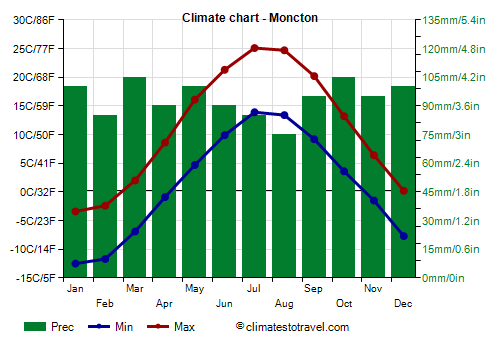
Moncton is located in the south, near the east coast. The climate is very similar to that of Fredericton.
The
average temperature of the coldest month (January) is of -8.5 °C (16.5 °F), that of the warmest month (July) is of 19.5 °C (67 °F).
Moncton - Average temperatures (1991-2020) |
| Month | Min | Max | Mean |
|---|
| January | -13.3 | -3.5 | -8.4 |
|---|
| February | -12.7 | -2.5 | -7.6 |
|---|
| March | -7.4 | 2.2 | -2.6 |
|---|
| April | -1.5 | 8.6 | 3.6 |
|---|
| May | 3.9 | 16.1 | 10 |
|---|
| June | 9.2 | 21.3 | 15.2 |
|---|
| July | 13.4 | 25.1 | 19.2 |
|---|
| August | 12.7 | 24.7 | 18.7 |
|---|
| September | 8.1 | 20.2 | 14.2 |
|---|
| October | 2.9 | 13.2 | 8 |
|---|
| November | -2.2 | 6.3 | 2 |
|---|
| December | -8.7 | 0 | -4.4 |
|---|
| Year | 0.4 | 11.1 | 5.75 |
|---|
amounts to 1,200 millimeters (47 inches) per year. On average 282 cm (111 inches) of snow fall per year. Usually it snows from mid-November to mid-April.
Moncton - Average precipitation| Month | Days |
|---|
| January | 102 | 12 |
|---|
| February | 88 | 10 |
|---|
| March | 111 | 11 |
|---|
| April | 94 | 12 |
|---|
| May | 98 | 12 |
|---|
| June | 95 | 11 |
|---|
| July | 87 | 11 |
|---|
| August | 77 | 9 |
|---|
| September | 103 | 9 |
|---|
| October | 124 | 11 |
|---|
| November | 108 | 12 |
|---|
| December | 115 | 12 |
|---|
| Year | 1205 | 129 |
|---|
On average, there are around 2,000
sunshine hours per year.
Moncton - Sunshine hours| Month | Average | Total |
|---|
| January | 3.5 | 115 |
|---|
| February | 4.5 | 125 |
|---|
| March | 4.5 | 140 |
|---|
| April | 5.5 | 165 |
|---|
| May | 6.5 | 210 |
|---|
| June | 8 | 235 |
|---|
| July | 8.5 | 255 |
|---|
| August | 8 | 240 |
|---|
| September | 6 | 175 |
|---|
| October | 5 | 150 |
|---|
| November | 3 | 95 |
|---|
| December | 3.5 | 100 |
|---|
| Year | 5.5 | 2005 |
|---|
Saint John
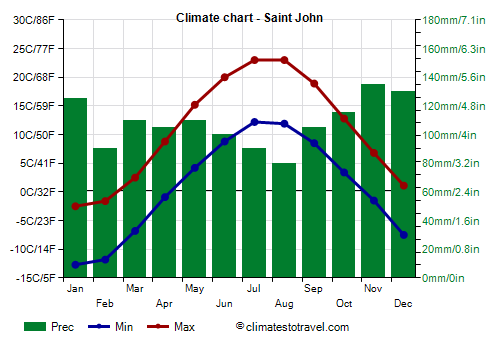 Saint John
 is located on the southern coast, in the bay of Fundy.
The average temperature of the coldest month (January) is of -8 °C (17.5 °F), that of the warmest month (July) is of 17.5 °C (63.5 °F).
Saint John - Average temperatures (1991-2020) |
| Month | Min | Max | Mean |
|---|
| January | -13.2 | -2.5 | -7.8 |
|---|
| February | -12.6 | -1.6 | -7.1 |
|---|
| March | -7.7 | 2.6 | -2.6 |
|---|
| April | -1.6 | 8.8 | 3.6 |
|---|
| May | 3.5 | 15.3 | 9.4 |
|---|
| June | 8.1 | 20 | 14 |
|---|
| July | 11.6 | 23 | 17.3 |
|---|
| August | 11.2 | 23 | 17.1 |
|---|
| September | 7.4 | 18.8 | 13.1 |
|---|
| October | 2.6 | 13 | 7.8 |
|---|
| November | -2 | 6.9 | 2.4 |
|---|
| December | -8.3 | 1.3 | -3.5 |
|---|
| Year | 0 | 10.8 | 5.35 |
|---|
Precipitation amounts to 1,270 millimeters (50 inches) per year.
Saint John - Average precipitation| Month | Days |
|---|
| January | 116 | 12 |
|---|
| February | 92 | 10 |
|---|
| March | 107 | 10 |
|---|
| April | 100 | 10 |
|---|
| May | 94 | 10 |
|---|
| June | 87 | 9 |
|---|
| July | 90 | 8 |
|---|
| August | 73 | 7 |
|---|
| September | 109 | 8 |
|---|
| October | 138 | 10 |
|---|
| November | 138 | 12 |
|---|
| December | 128 | 12 |
|---|
| Year | 1270 | 120 |
|---|
Grand Manan
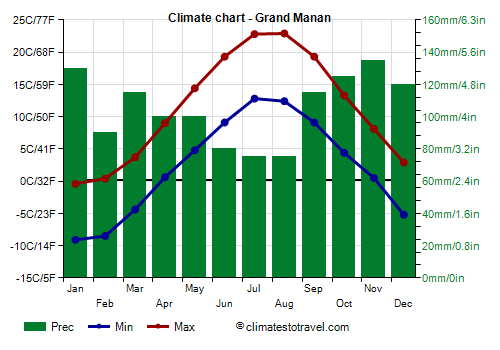
The island of Grand Manan is located south of the province, between the Gulf of Maine and the Bay of Fundy, and in winter it is the mildest area, while in summer it is quite cool.
The
average temperature ranges from -5 °C (23 °F) in January to 17.5 °C (63.5 °F) in July.
Grand Manan - Average temperatures (1991-2020) |
| Month | Min | Max | Mean |
|---|
| January | -9.2 | -0.4 | -4.8 |
|---|
| February | -8.8 | 0.3 | -4.2 |
|---|
| March | -5 | 3.6 | -0.7 |
|---|
| April | 0.1 | 9.1 | 4.6 |
|---|
| May | 4.4 | 14.4 | 9.4 |
|---|
| June | 8.7 | 19.3 | 14 |
|---|
| July | 12.4 | 22.8 | 17.6 |
|---|
| August | 12 | 23 | 17.5 |
|---|
| September | 8.4 | 19.2 | 13.8 |
|---|
| October | 4 | 13.3 | 8.6 |
|---|
| November | -0.2 | 8.1 | 4 |
|---|
| December | -5.4 | 2.8 | -1.3 |
|---|
| Year | 1.8 | 11.4 | 6.6 |
|---|
amounts to 1,250 millimeters (49.2 inches) per year. On average, 169 cm (67 inches) of snow fall per year. Usually it snows from late November to early April.
Grand Manan - Average precipitation| Month | Days |
|---|
| January | 129 | 12 |
|---|
| February | 88 | 10 |
|---|
| March | 114 | 10 |
|---|
| April | 99 | 10 |
|---|
| May | 101 | 10 |
|---|
| June | 82 | 9 |
|---|
| July | 75 | 8 |
|---|
| August | 73 | 7 |
|---|
| September | 113 | 8 |
|---|
| October | 123 | 10 |
|---|
| November | 134 | 12 |
|---|
| December | 122 | 12 |
|---|
| Year | 1250 | 120 |
|---|
When to go
The best time to visit New Brunswick is from June to September, as it is the mildest of the year. July and August are the warmest months.
Back to topSee also the
temperatures by month.