Select units of measurement for the temperature and rainfall tables (metric or imperial).
Average weather, temperature, rainfall, sunshine
In Greenland, a large island in North America, and an autonomous territory of the Kingdom of Denmark, there is a
tundra climate along the coasts, with temperatures above freezing in the summer months, and a
polar ice cap climate in the vast interior area, where the temperature remains below or around freezing even in the summer months. There are also sheltered valleys and fjords, where the average of the warmest month is just over 10 °C (50 °F), and therefore the climate is
subarctic.
Winter temperatures are below freezing everywhere, but vary greatly, depending on latitude and distance from the sea.
The largest settlements are located within the fjords of the west and south coast, where the climate is relatively milder.
Greenland is a very large island and is very
extended in latitude, in fact, the southern tip is located at the same latitude as Oslo (Norway), while the northernmost tip is the land closest to the North Pole, which is about 700 kilometres (400 miles) away.
Much of the island is covered by an
ice sheet, called
Inlandsis, which formed over the millennia and is up to 3,000 meters (10,000 ft) thick in the interior. The ice sheet is not stationary, but moves slowly, sliding towards the sea by gravity. The ice flows to the sea through the fjords, giving birth to icebergs which then drift away in the sea.
Despite being very large, Greenland has only 56,000 inhabitants due to its unfavorable climate. The capital, Nuuk, has about 20,000 inhabitants.
In the center and north, the
coldest month is typically February, and sometimes even March. March is usually as cold as January or even colder. This happens because at these latitude, in winter the sun never rises (
polar night), and even when it rises above the horizon in March, it initially remains very low and fails to warm the soil, also because the latter is covered with snow and therefore it reflects most of the solar rays. It goes without saying that in April, in the center and north, temperatures are still very low, that is, many degrees below freezing.
During the long winter, nights can be illuminated by the spectacular northern lights (
aurora borealis).
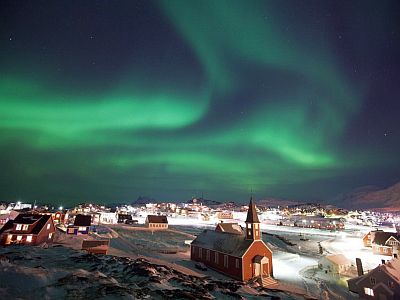
Greenland is a
windy island. The wind that descends from the perennial ice cap and reaches the fjords and the sea is called
katabatic (here it is called
piteraq). In addition, there are the cold winds that come directly from the North Pole. Strong winds blowing with very cold temperatures are dangerous for human beings if they are not properly equipped, and can lead to frostbite.
There are also the southern and westerly winds, which blow especially along the southern coast, and are due to the clash between polar and mild air masses, the latter carried along the Atlantic Ocean by the Gulf Stream. There are, however, also sheltered bays and fjords where the wind blows more rarely.
Precipitation in Greenland is generally scarce but quite frequent, mainly in the form of light snow, in the central-northern areas, where it fluctuates from 100 to 300 millimeters (4 to 12 inches) per year.
Instead, it is more abundant along the coasts south of the Arctic Circle, where it can occur in the form of rain for a few months per year and generally exceed 600 mm (23.5 in) per year. On the southwest coast, precipitation typically ranges from 800 to 1,000 mm (31 to 40 in) per year.
The area where it is most abundant is the far south-eastern coast, which however is uninhabited, where it even exceeds 2,000 mm per year (80 in).
However, in cold and windy areas, where there are only automatic stations, it is difficult to measure the actual amount of precipitation due to extreme weather conditions (for example, light snow blown away by the wind).
The amount of
sunshine is not very good, at least along the coasts, but in spring and summer, the sun can come out, also because of the long days (in the center-north, the phenomenon of the
midnight sun also occurs, for a more or less long period around June 21st), so it can be useful to bring sunscreen, lip balm and sunglasses for the vast snow-covered areas.
The climate in detail
The coasts
On the
north coast, overlooking the Arctic Ocean, the average temperature in February is of -31 °C (-24 °F) in the far north (see Cape Morris Jesup, which is uninhabited) and of -29 °C (-20 °F) in the remote research station of
Station Nord, located on the north-eastern tip. During winter, the temperature can plunge to -45 °C (-49 °F), while in summer it reaches at most 16/17 °C (61/63 °F).
The average daily temperature exceeds freezing only in July and August, while in June it is around 0 °C (32 °F). Sometimes it can snow even in summer.
In the inhabited areas, temperatures are higher. However, on the
northwest coast we find
Qaanaaq (Thule), one of the northernmost inhabited places in the world, located just 1,300 km (800 mi) away from the North Pole, where the average temperature ranges from -23 °C (-9.5 °F) in February to 6.5 °C (43.5 °F) in July.
In return, the area in which this town is located is not very windy. ù
Precipitation amounts to just 120 millimetres (4.07 inches) per year: a value typical of a desert climate.
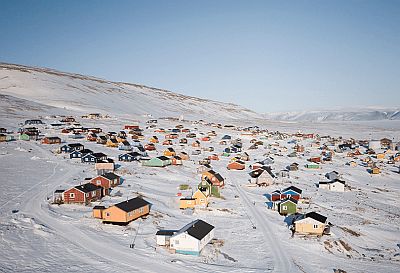
Further south, in
Upernavik, a town of a thousand inhabitants, located on the west coast and at a latitude of 72 degrees north, the average temperature ranges from -19 °C (-2 °F) in February to 6.5 °C (43.5 °F) in July. Precipitation amounts to 230 mm (9 in) per year.
On the
west coast, below the 70th parallel, we find the main towns of Greenland, overlooking the Davis Strait and the Labrador Sea (while in the east coast, a cold current carries floating ice on the sea). The cities are often located in sheltered bays, but it's enough to go offshore to find a cold wind, and temperatures a few degrees above freezing even in summer.
Winter becomes gradually less cold as you move south: the average temperature in February goes approximately -15 °C (5 °F) to -3 °C (27 °F).
The
summer is very cool, if not cold, with an average almost everywhere below 10 °C (50 °F). In fact, the sea remains cold both because of the latitude and because it continually receives icebergs from the mainland's glaciers.
Along this coast,
fog often forms in summer. In the main towns, July and August are the only months when it almost never snows but it
rains instead.
In addition, from June to August there may be short
very mild periods, usually one to three days, when the temperature reaches or exceeds 20 °C (68 °F).
In
Ilulissat (or Jakobshavn in Danish), on the west coast and 300 kilometers (195 miles) north of the Arctic Circle, the average temperature ranges from -15 °C (5 °F) in February to 8 °C (46.5 °F) in July.
From 1991 to 2020, the coldest record is -40.5 °C (-40.9 °F). The highest record is 21.7 °C (71.1 °F).
Precipitation is scarce, around 270 mm (10.6 in) per year, which means that snowfalls in the long winter are usually light, maybe of long duration but not abundant.
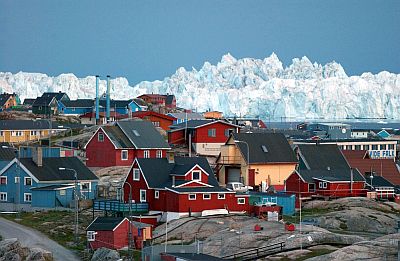
The towns located not directly on the coast but within the fjords are colder in winter, but also a little warmer in summer. For example, in
Kangerlussuaq (Sondrestrom), located south of Ilulissat, about 130 km (80 mi) away from the coast, the average temperature ranges from -20 °C (-4 °F) in March to 11 °C (52 °F) in July. Here, the lowest record of the last thirty years is a respectable -47 °C (-52.5 °F), while the highest is 25.5 °C (78 °F).
The latter is one of the highest values ever recorded in Greenland; the highest is 25.9 °C (78.6 °F), set in July 2013 further south, on the island of
Maniitsoq.
In
Nuuk (Godthåb), the capital, located 500 km (300 mi) south of Ilulissat, the average temperature ranges from -8.5 °C (16.5 °F) in February to 8 °C (46.5 °F) in July. The lowest record of the last thirty years is not so prohibitive, being of -29 °C (-20 °F), while the highest is 25 °C (77 °F).
Precipitation in Nuuk is more abundant, around 875 mm (34.5 in) per year, with a maximum in summer.
Continuing to the south, in
Paamiut (formerly Frederikshab), the average temperature ranges from -7 °C (19 °F) in February to 7 °C (44.5 °F) in July; precipitation reaches 880 mm (34.5 in) per year, which means that during the long winter, a significant amount of snow accumulates.
In the south, in
Narsarsuaq, a village located at 61 degrees north latitude, within a fjord 80 km (50 mi) deep, the average ranges from -6.5 °C (20.5 °F) in February to 11.5 °C (52.5 °F) in July. We are in the
mildest area of Greenland, where the average temperature exceeds 5 °C (41 °F) for five months, from May to September.
From 1991 to 2020, the coldest record is -32 °C (-25.5 °F) and the highest is 23.7 °C (74.5 °F).
Precipitation amounts to 615 mm (24 in) per year, with a maximum in autumn. It usually snows from October to April, but sometimes also in September and May.
The remains of the
Viking settlements are found in Southern Greenland, as well as in the Nuuk area. In these areas, as previously mentioned, the temperature exceeds freezing for a few months a year, and then, as today, the landscape becomes green in the summer months.
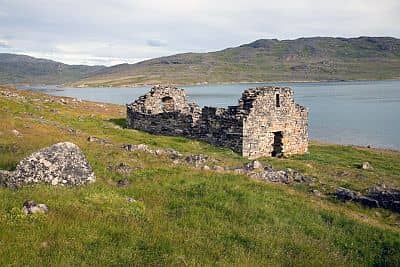
South of Narsarsuaq, closer to the coast, we find the towns of
Qaqortoq,
Nanortalik and Narsaq. Here the average of the coldest month is equal to or higher than -5 °C (23 °F).
Greenland is almost devoid of
trees, but in this area of the extreme south, there is a valley sheltered between the mountains, the Qinngua Valley, where we find the only natural forest in Greenland.
In the
southern tip, near Cape Farewell (see Prins Christian Sund), the climate is
almost oceanic, in fact the average temperature ranges from -4 °C (25 °F) in February to 8 °C (46.5 °F) in August. In return, precipitation is abundant, since it exceeds 2,200 mm (87 in) per year. Snowfalls are abundant, but also the summer rains. However, the temperature in the extreme south can exceed freezing, and it can rain, even in winter. The wind is frequent and often stormy. This area is occupied by fjords and mountainous islands, and it's virtually uninhabited.
On the
east coast there are very few settlements. One reason is the cold marine current, which, as we mentioned, carries ice floes on the sea. Another reason is that the eastern coastline is more rugged, with the heights covered in perennial ice that loom directly over the sea.
However, on an island near the coast, at the 65th parallel, we find the town of
Tasiilaq (Ammassalik), where the average temperature ranges from -6 °C (21 °F) between January and March to 7 °C (44.5 °F) in July and August. Here, the average temperature exceeds freezing from May to September. From 1991 to 2020, the lowest recorded temperature is -18 °C (0 °F) and the highest is 25.3 °C (77.5 °F). Precipitation, quite abundant, amounts to 880 mm (34.5 in), so there can be heavy snow accumulations here as well. In summer, there is a moderate amount of rainy days.
The Inlandsis
In the
interior, covered by the ice cap, the temperature remains around freezing or below even in summer, and it decreases with altitude. In summer, it usually snows above 300 meters (1,000 feet) above sea level. The coldest areas are the central ones, where the ice cap is thicker.
For instance, in the point called
Eismitte, at the center of the island, about 3,000 meters (10,000 ft) above sea level, an expedition in 1930 installed a weather station, which recorded an average temperature ranging from -47 °C (-53 °F) in February to -12 °C (10 °F) in July. The lowest recorded temperature was -65 °C (-85 °F) and the highest was -3 °C (27 °F).
The hours of sunshine recorded in that short period show that the sun often shines in summer, also because of the long days, especially in June.
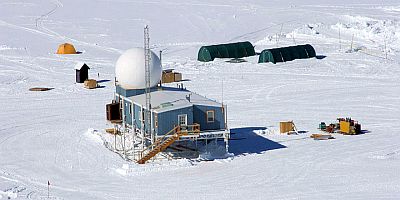
In the more recent scientific station of
Summit Camp, located near the highest point of the ice plateau, where the altitude reaches 3,200 meters (10,500 ft), the average temperature ranges from -39 °C (-38 °F) in January and February to -12 °C (10.5 °F) in July. The coldest record so far is -65 °C (-85 °F), while the highest has been 2.2 °C (36 °F).
However, on 22 December 1991, in the same area, a temporary American station called Klinck, at 3,105 meters (10,187 ft) above sea level, measured a temperature of -69.6 °C (-93.3 °F), close to the lowest values recorded in Siberia (where, however, they were recorded in plain or hill locations).
In the eastern part of Greenland, there is also a mountain range, the
Watkins Mountains, which exceed the altitude of the plateau, and reach their highest point in Gunnbjörn Fjeld, 3,694 meters (12,119 feet) high. This and the other mountain peaks are climbed preferably in July and August, when the weather conditions are usually better.
When to go
The best time to visit Greenland is the
summer, from June to August.
In June, temperatures are a bit lower, and this could be a disadvantage for the coldest areas, but in return, it's possible to see the midnight sun in a wider area; moreover, rain and snow are a bit rarer.
July is the mildest month, but rainfall starts to become a bit more frequent, at least on the south-west coast, and even more so in August. In the colder areas, where what matters most is the temperature, you may prefer July and August, and especially July because it's the least cold.
If you plan to visit
the inland plateau and the mountains, you must be equipped for the freezing cold even in midsummer. On the northern coast, the temperature is around freezing, so you will need to wear winter clothes.
Otherwise, for the
central and southern coastal towns, some heavy clothes are also recommended, a sweater and a jacket for the evening and for excursions (eg boat trips where you will be exposed to cold winds), and a raincoat for rainy days. Hiking boots with non-slip soles are also recommended because paved roads are a rarity, and you can easily end up in snow-covered areas. During the day, it can sometimes get warm, and therefore you must be ready to take off the heaviest clothes.
What to pack
In
winter: it is necessary to bring clothing for extreme cold conditions, especially in the interior and the north, such as synthetic, thermal long underwear, a fleece, a down-filled parka with insulated hood, a wind jacket in Goretex, gloves, warm boots, a scarf, and fleece socks.
In
summer: in the major cities, bring warm clothes, a jacket, a sweater, a shirt and a T-shirt for mild days; boots or hiking shoes, and a raincoat or umbrella. For the interior plateau region and the mountains, but also for offshore excursions: bring a fleece, a down jacket, a wind jacket, a hat, and gloves.
Climate data - Greenland
| Ilulissat |
|---|
|
| Jan | Feb | Mar | Apr | May | Jun | Jul | Aug | Sep | Oct | Nov | Dec |
|---|
| Min temp. | -16 | -19 | -19 | -12 | -3 | 3 | 5 | 3 | 0 | -6 | -11 | -13 |
|---|
| Max temp. | -9 | -11 | -10 | -4 | 4 | 10 | 12 | 10 | 6 | 0 | -4 | -6 |
|---|
| Precip. | 15 | 15 | 15 | 20 | 20 | 25 | 30 | 30 | 40 | 25 | 20 | 20 |
|---|
| Prec. days | 4 | 4 | 4 | 5 | 4 | 5 | 5 | 5 | 7 | 5 | 6 | 5 |
|---|
| Humidity | 64% | 64% | 67% | 69% | 70% | 70% | 68% | 71% | 69% | 66% | 63% | 64% |
|---|
| Day length | 2 | 8 | 12 | 16 | 22 | 24 | 23 | 18 | 13 | 9 | 4 | 0 |
|---|
| Sun hours | 0 | 1 | 3 | 6 | 9 | 10 | 9 | 7 | 4 | 2 | 1 | 0 |
|---|
| Sea temp | 0 | -1 | -1 | -1 | 0 | 1 | 3 | 4 | 4 | 2 | 1 | 0 |
|---|
| Kangerlussuaq |
|---|
|
| Jan | Feb | Mar | Apr | May | Jun | Jul | Aug | Sep | Oct | Nov | Dec |
|---|
| Min temp. | -23 | -25 | -22 | -12 | -2 | 4 | 5 | 3 | -1 | -9 | -16 | -20 |
|---|
| Max temp. | -14 | -15 | -11 | -1 | 8 | 15 | 17 | 14 | 8 | -1 | -7 | -10 |
|---|
| Precip. | 10 | 5 | 5 | 10 | 10 | 15 | 30 | 30 | 25 | 15 | 10 | 10 |
|---|
| Prec. days | 3 | 2 | 2 | 2 | 3 | 3 | 5 | 7 | 5 | 4 | 4 | 3 |
|---|
| Humidity | 72% | 71% | 69% | 65% | 58% | 54% | 57% | 65% | 66% | 73% | 73% | 73% |
|---|
| Day length | 4 | 8 | 12 | 16 | 20 | 24 | 22 | 17 | 13 | 9 | 5 | 2 |
|---|
|
|
| Narsarsuaq |
|---|
|
| Jan | Feb | Mar | Apr | May | Jun | Jul | Aug | Sep | Oct | Nov | Dec |
|---|
| Min temp. | -10 | -11 | -9 | -3 | 2 | 5 | 7 | 6 | 2 | -2 | -7 | -10 |
|---|
| Max temp. | -2 | -3 | -1 | 5 | 10 | 14 | 16 | 14 | 10 | 5 | 0 | -2 |
|---|
| Precip. | 40 | 50 | 35 | 45 | 35 | 45 | 50 | 65 | 80 | 55 | 70 | 40 |
|---|
| Prec. days | 7 | 6 | 6 | 6 | 6 | 6 | 7 | 8 | 9 | 6 | 8 | 6 |
|---|
| Humidity | 57% | 58% | 58% | 57% | 56% | 60% | 64% | 69% | 65% | 62% | 63% | 59% |
|---|
| Day length | 7 | 9 | 12 | 15 | 18 | 19 | 18 | 16 | 13 | 10 | 7 | 6 |
|---|
| Sun hours | 1 | 2 | 4 | 6 | 6 | 6 | 6 | 5 | 5 | 3 | 1 | 1 |
|---|
| Sea temp | 1 | 0 | 0 | 0 | 1 | 3 | 4 | 5 | 4 | 3 | 2 | 2 |
|---|
| Nuuk |
|---|
|
| Jan | Feb | Mar | Apr | May | Jun | Jul | Aug | Sep | Oct | Nov | Dec |
|---|
| Min temp. | -10 | -10 | -10 | -5 | -1 | 2 | 4 | 4 | 2 | -2 | -5 | -7 |
|---|
| Max temp. | -5 | -6 | -6 | -1 | 4 | 8 | 10 | 10 | 6 | 2 | -1 | -3 |
|---|
| Precip. | 75 | 55 | 60 | 55 | 60 | 60 | 75 | 95 | 105 | 80 | 85 | 75 |
|---|
| Prec. days | 13 | 10 | 10 | 8 | 8 | 8 | 8 | 10 | 12 | 11 | 12 | 13 |
|---|
| Humidity | 75% | 75% | 76% | 77% | 79% | 81% | 80% | 83% | 80% | 76% | 74% | 75% |
|---|
| Day length | 6 | 9 | 12 | 15 | 19 | 21 | 20 | 16 | 13 | 10 | 6 | 4 |
|---|
| Sun hours | 0 | 2 | 5 | 6 | 6 | 7 | 6 | 5 | 5 | 3 | 1 | 0 |
|---|
| Sea temp | 0 | 0 | 0 | 1 | 2 | 3 | 4 | 4 | 4 | 2 | 1 | 0 |
|---|
| Qaanaaq |
|---|
|
| Jan | Feb | Mar | Apr | May | Jun | Jul | Aug | Sep | Oct | Nov | Dec |
|---|
| Min temp. | -25 | -27 | -26 | -19 | -8 | 0 | 3 | 3 | -2 | -9 | -15 | -21 |
|---|
| Max temp. | -18 | -19 | -17 | -9 | 0 | 7 | 10 | 8 | 3 | -4 | -10 | -15 |
|---|
| Precip. | 5 | 5 | 5 | 5 | 5 | 5 | 15 | 25 | 20 | 10 | 10 | 10 |
|---|
| Prec. days | 2 | 2 | 1 | 2 | 2 | 2 | 4 | 4 | 4 | 3 | 3 | 2 |
|---|
| Humidity | 64% | 66% | 65% | 65% | 70% | 76% | 76% | 74% | 63% | 63% | 62% | 64% |
|---|
| Day length | 0 | 4 | 12 | 20 | 24 | 24 | 24 | 22 | 14 | 6 | 0 | 0 |
|---|
| Sun hours | 0 | 0 | 5 | 8 | 10 | 9 | 9 | 6 | 5 | 2 | 0 | 0 |
|---|
| Sea temp | -2 | -2 | -2 | -2 | -1 | -1 | 0 | 2 | 1 | -1 | -2 | -2 |
|---|
| Station Nord |
|---|
|
| Jan | Feb | Mar | Apr | May | Jun | Jul | Aug | Sep | Oct | Nov | Dec |
|---|
| Min temp. | -31 | -32 | -32 | -24 | -12 | -2 | 2 | 0 | -9 | -20 | -26 | -29 |
|---|
| Max temp. | -25 | -26 | -26 | -18 | -6 | 3 | 7 | 5 | -5 | -15 | -20 | -23 |
|---|
| Precip. | 25 | 25 | 30 | 25 | 20 | 10 | 30 | 30 | 40 | 35 | 30 | 25 |
|---|
| Prec. days | 7 | 5 | 6 | 6 | 4 | 3 | 5 | 5 | 7 | 8 | 7 | 6 |
|---|
| Humidity | 76% | 76% | 77% | 79% | 79% | 82% | 80% | 81% | 85% | 82% | 80% | 77% |
|---|
| Day length | 0 | 0 | 12 | 24 | 24 | 24 | 24 | 24 | 16 | 2 | 0 | 0 |
|---|
|
|
| Summit Camp (3,200 meters) |
|---|
|
| Jan | Feb | Mar | Apr | May | Jun | Jul | Aug | Sep | Oct | Nov | Dec |
|---|
| Min temp. | -44 | -44 | -44 | -38 | -29 | -20 | -17 | -22 | -29 | -37 | -42 | -44 |
|---|
| Max temp. | -34 | -34 | -32 | -25 | -17 | -10 | -8 | -11 | -19 | -27 | -32 | -34 |
|---|
| Precip. | 0 | 0 | 0 | 0 | 0 | 0 | 0 | 0 | 0 | 0 | 0 | 0 |
|---|
| Prec. days | 0 | 0 | 0 | 0 | 0 | 0 | 0 | 0 | 0 | 0 | 0 | 0 |
|---|
|
| Day length | 0 | 6 | 12 | 18 | 24 | 24 | 24 | 20 | 13 | 8 | 1 | 0 |
|---|
|
|
See also the
temperatures month by month