Select units of measurement for the temperature and rainfall tables (metric or imperial).
Average weather, temperature, rainfall, sunshine
In Chile, a South American country overlooking the South Pacific Ocean, there is a wide variety of climates:
desert but mild in the north,
Mediterranean in the center,
oceanic in the south, and
cold in the Andes.
The country has a unique shape, in fact it is very long (about 4,300 kilometers or 2,700 miles from north to south, from 17 to 56 degrees south latitude) and narrow, so it obviously has different climates and environments.
Being located in the Southern Hemisphere, in Chile the seasons are reversed in comparison with North America or Europe.
The climate in detail
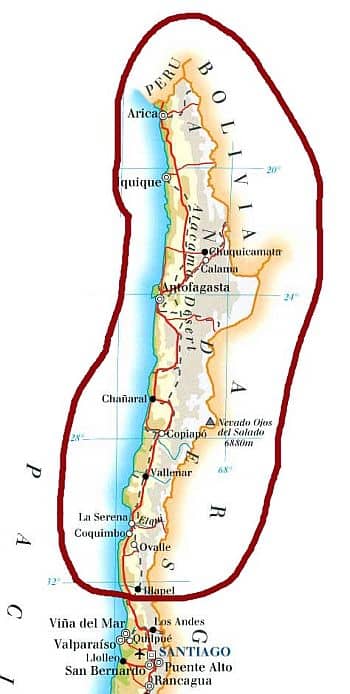
The North
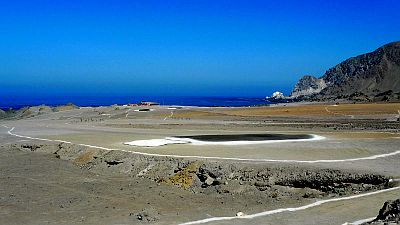
Atacama Desert
All of Chile north of the Santiago region is desert, in both the coast and the Andean area.
On the coast, in cities like
Arica,
Iquique, and
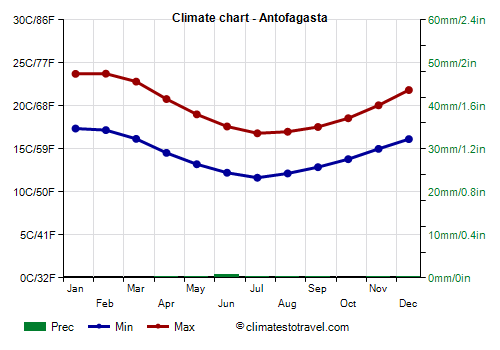
Antofagasta, it hardly ever rains: years can pass between one shower and another. This area is occupied by the
Atacama Desert, the driest place on Earth.
The cause of the aridity is a
cold sea current, the
Humboldt Current, which inhibits the formation of upward air currents that could generate rain clouds. Of course, the sea current is cold in comparison with the tropical latitude of the area.
However, the sun is often obscured by
fog and low clouds (called
Camanchacas), especially from April to October, although this happens less frequently than in nearby Peru; it goes better in summer, from December to February, which is therefore the best time to visit this northern part of the coast.
The
temperatures along the coast are mild, almost always spring-like: proceeding from north to south, in Arica the daily average ranges from 23 °C (73 °F) in January and February to 16.5 °C (61.5 °F) in June and July, in Iquique it ranges from 22.5 °C to 16 °C (72.5 °F to 61 °F), in Antofagasta from 20.5 °C to 14 °C (69 °F to 57 °F), and in Coquimbo from 18 °C to 12 °C (63 °F to 54 °F).
In the northernmost part of the coast, the
sea is never very warm, although it is warm enough for swimming from January to March.
Further south, in
La Serena and Coquimbo, the climate becomes a little cooler, and continues to remain desert, but in winter, from June to August, some rain can occur.
In
inland areas, at least in the plains or at low altitudes (see
Copiapó, Vallenar), in summer the daytime temperatures are a few degrees higher than on the coast.
At this latitude, in the
Andes, where the climate is desert as well, a lunar landscape is found. The temperature obviously decreases with increasing altitude; the mountains are above the fog layer, so here the sun shines all year round, warming the air during the day, while at night the temperature drops a lot, especially in winter.
For example, in
Calama, a city located at an altitude of 2,250 meters (7,400 feet), during the day the temperature exceeds 20 °C (68 °F) all year round, reaching 25 °C (77 °F) from November to February, while at night they even drop to as low as the freezing point from June to August.
To the southeast, in San Pedro de Atacama, at 2,400 meters or 7,900 feet, the temperatures are similar.
Above 3,000 meters (10,000 ft), it's cold at night, with possible intense frosts especially in winter, while during the day the tropical sun of the mountains is capable of raising the temperature above freezing.
To find some snowfields, where the rare snowfalls can be preserved, you have to climb to very high altitudes, above 5,500 meters (18,000 ft).
The center
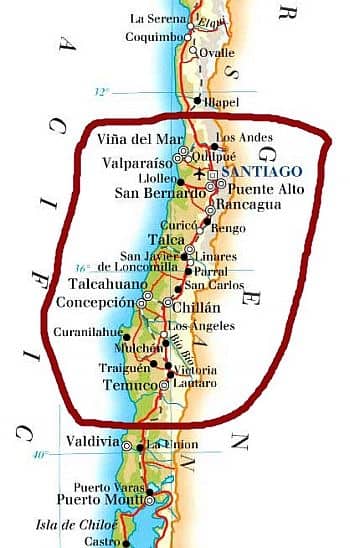
In central Chile, in the northern part of the central valley, located between the coast and the Andes (see Santiago,
Curicó,
Chillán), the climate is almost
Mediterranean that is, mild and rainy in winter, and warm to hot and sunny in summer.
Valparaiso
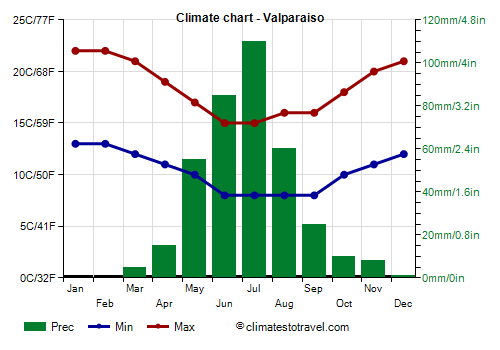
Along the coast, however, the influence of the sea makes the summer cool: in
Valparaiso, the average temperature ranges from 11.5 °C (52.5 °F) in June and July to 17.5 °C (63.5 °F) in January and February.
Rainfall in Valparaiso amounts to 375 millimeters (14.5 inches) per year, and occurs mainly in the austral winter, from May to August, while from November to March it almost never rains.
In Valparaiso, the sun shines regularly in summer (although there may be morning fogs), while in winter it is seen quite rarely.
In the central part of the coast, the sea is very cool even in summer. In Viña del Mar and Valparaiso, the water temperature barely reaches 18 °C (64 °F) in February.
Santiago
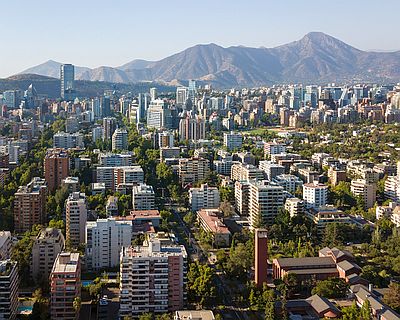
In the capital,
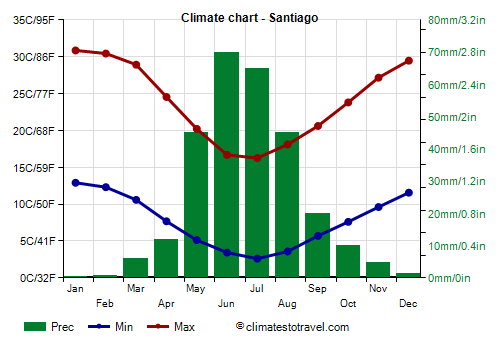
Santiago, 90 kilometers (55 miles) away from the sea and 500 meters (1,600 feet) above sea level, the daily average ranges from 9.5 °C (49 °F) in July to 22 °C (71.5 °F) in January.
The daily temperature range is higher, in particular, nights are cold in winter, with some slight frosts, and are usually cool even in summer.
The maximum temperatures, however, can sometimes be hot in summer, with peaks of 36/38 °C (97/100 °F). If in addition we consider both the poor air circulation and the pollution of the metropolis, the best times to visit Santiago are spring and autumn, ie
March-April and October-November.
Only 275 mm (11 in) of rain fall in a year, most of it from May to August.
In Santiago, the sun shines more often than on the coast, since fog is less frequent, especially in summer, when the sky is almost always clear.
At these latitude, the
Andean area receives moderate precipitation in the winter months, so there are eternal snows above 4,000 meters (13,000 ft). At 3,500 meters (11,500 ft) above sea level, the average temperature ranges from -6.5 °C (20.5 °F) in June and July to 4 °C (39 °F) in January. In this region, you can find ski resorts, such as Portillo and La Parva.
Continuing south along the coast, the rains become progressively more abundant. In
Concepción, precipitation reaches 1,100 mm (43 in) per year, with heavy rains from May to August; moreover, here some rainfalls, albeit generally not abundant, are possible even in summer.
The South
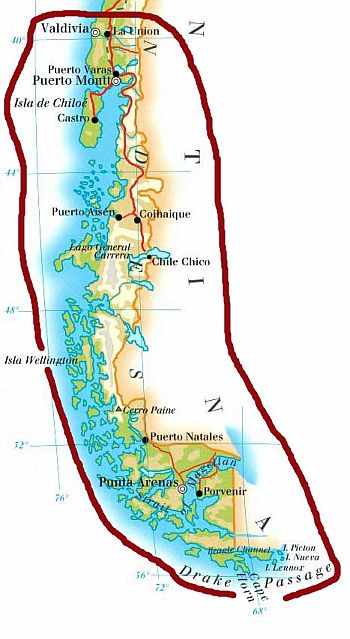
Southern Chile has a climate that ranges from cool to cold. Below the 40th parallel, we enter a region that has a strongly
oceanic climate, where not only the total amount of rainfall is high, from 2,000 to 4,000 mm (79 to 157 in) per year, but also summer is a rainy season, albeit less than winter.
In fact, here we are in the zone of the
westerly winds, which blow constantly and can be stormy, especially in the south. Obviously, the temperature tends to decrease as we proceed southwards.
At this latitude, the Andean areas are green as well, with forests at low altitudes, while perennial snows are found at altitudes not too high.
Valdivia
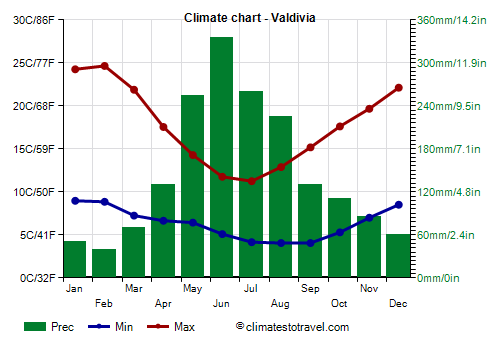
In
Valdivia, at a latitude of 39 degrees south, and therefore at the limit with the previous area, the average temperature ranges from 7.5 °C (45.5 °F) in July to 17 °C (62.5 °F) in February.
Rainfall amounts to 1,755 mm (69 in) per year, of which more than 200 mm (8 in) fall per month from May to August, while there's a minimum of around 40/50 mm (1.6/2 in) in January and February.
In Valdivia, the sun shines quite often in summer, while in winter it rarely shines.
At the latitude of Valdivia, the sea is cold, and reaches 16 °C (61 °F) in the summer months.
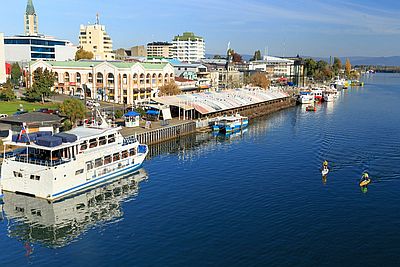
Starting from
Puerto Montt, at a latitude of 41 degrees south, the coastline begins to be indented, with islands, bays and fjords, a witness of the effects of glacial erosion occurred in the past millennia.
In
Puerto Aysén, at a latitude of 45 degrees south, the climate is cool and rainy throughout the year: the average temperature ranges from 4.5 °C (40 °F) in July to 14 °C (57 °F) in January, and there are no less than 2,250 millimeters (88.5 inches) of rain per year, with no month below 125 mm (5 in).
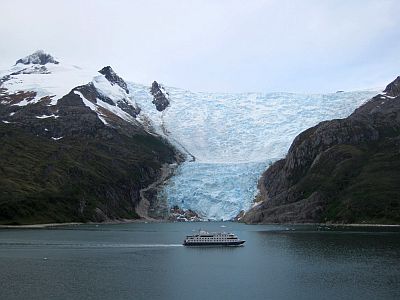
South of the 45th parallel, there are
vast glaciers, with the snowline that progressively decreases, and ice tongues that can even end in the sea (also because of gravity).
Within the fjords there are sheltered places, which receive a lower amount of rain, wind and snow compared with the western coast.
Punta Arenas
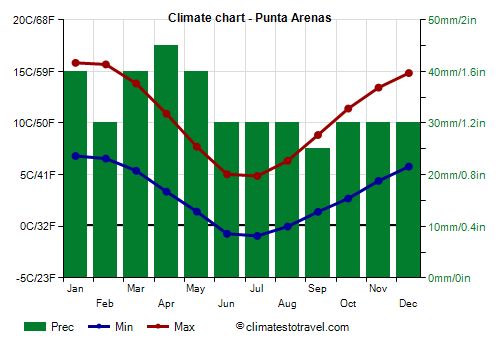
The city of
Punta Arenas is located at a latitude of 53 degrees south, in the Strait of Magellan, an area partially sheltered from the impetuous westerly winds by the last foothills of the Andes. Therefore, most of the rain falls on the western side, while in Punta Arenas annual precipitation amounts to just 410 mm (16 in), although it's quite frequent throughout the year.
Here, both the climate and the landscape are similar to those of Iceland, with colorful houses and glaciers starting at a few hundred meters above sea level.
In Punta Arenas, the sun does not shine very often; however, from November to January it shines for about 7 hours and a half a day.
In the southernmost part of the coast, the sea is always cold, and only reaches 10 °C (50 °F) in February.
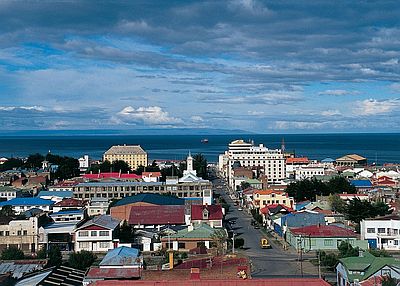
The southernmost tip of Chile,
Cape Horn, is also the southernmost tip of South America.
If you want to visit this southernmost area of Chile, the best time is the austral summer, from
December to February, when the days can be mild, but nights are often cold. The average temperature in January is around 10 °C (50 °F), while in June and July it's just above freezing (but it reaches the freezing point in the extreme south). Cold waves from Antarctica can lower the temperature by several degrees, especially from April to September, but they do not last long because after a while the westerlies start to blow again.
When to go
All in all, the best time to visit Chile as a whole is the austral summer, from
December to February. In fact, hot temperatures are rare, except in some areas of the north and the center, at a certain distance from the sea, like in Santiago, but at least you can avoid both the mists of the north coasts and the cold weather of the south, which both occur in winter, and sometimes also in spring and autumn.
What to pack
In
winter (June to August): in the north, Arica and Antofagasta, bring clothes for spring and autumn, including a sweatshirt or sweater and a jacket.
In the northern part of the Andes, bring clothes for spring and autumn during the day and warm in the evening, such as a warm jacket and a warm hat, and also walking shoes, sunglasses, sunscreen; for the high mountains, warm clothes, such as a down jacket, a wind jacket, a scarf, gloves.
In the center, Santiago and Valparaiso: bring warm clothes, such as a sweater and a jacket, and an umbrella.
In the south, warm clothes, a fleece, a down jacket, a warm hat, gloves, a scarf, a raincoat.
In the central and southern Andes, warm clothes, such as a down jacket, a wind jacket, a scarf, gloves, a warm hat, warm boots.
In
summer (December to February): in the north, Arica and Antofagasta, bring light clothes for the day, and a sweatshirt and a light jacket for the evening.
In the northern Andes, clothes for spring and autumn during the day and warm in the evening, such as a warm jacket and a hat; hiking shoes, sunglasses, sunscreen; for the highest peaks, a down jacket, a scarf, gloves.
In the center, Santiago and Valparaiso: light clothes for the day, a sweatshirt and a jacket for the evening.
In the south, warm clothes, such as a sweater, a raincoat, a jacket, hiking boots. In the southern Andes, a down jacket, a scarf, gloves, warm boots.
See also the climate of
Easter IslandClimate data - Chile
| Antofagasta |
|---|
|
| Jan | Feb | Mar | Apr | May | Jun | Jul | Aug | Sep | Oct | Nov | Dec |
|---|
| Min temp. | 17 | 17 | 16 | 15 | 13 | 12 | 12 | 12 | 13 | 14 | 15 | 16 |
|---|
| Max temp. | 24 | 24 | 23 | 21 | 19 | 18 | 17 | 17 | 18 | 19 | 20 | 22 |
|---|
| Precip. | 0 | 0 | 0 | 0 | 0 | 0 | 0 | 0 | 0 | 0 | 0 | 0 |
|---|
| Prec. days | 0 | 0 | 0 | 0 | 0 | 0 | 0 | 0 | 1 | 0 | 0 | 0 |
|---|
| Humidity | 73% | 74% | 76% | 76% | 76% | 76% | 75% | 75% | 74% | 73% | 73% | 72% |
|---|
| Day length | 13 | 13 | 12 | 12 | 11 | 11 | 11 | 11 | 12 | 13 | 13 | 14 |
|---|
| Sun hours | 10 | 10 | 9 | 8 | 7 | 7 | 7 | 7 | 7 | 8 | 9 | 10 |
|---|
| Sea temp | 22 | 22 | 22 | 20 | 18 | 17 | 16 | 16 | 16 | 17 | 18 | 20 |
|---|
| Arica |
|---|
|
| Jan | Feb | Mar | Apr | May | Jun | Jul | Aug | Sep | Oct | Nov | Dec |
|---|
| Min temp. | 20 | 20 | 19 | 17 | 16 | 15 | 15 | 15 | 15 | 16 | 17 | 18 |
|---|
| Max temp. | 26 | 26 | 26 | 24 | 22 | 20 | 18 | 18 | 19 | 20 | 22 | 24 |
|---|
| Precip. | 0 | 0 | 0 | 0 | 0 | 0 | 0 | 0 | 0 | 0 | 0 | 0 |
|---|
| Prec. days | 0 | 0 | 0 | 0 | 0 | 0 | 0 | 0 | 0 | 0 | 0 | 0 |
|---|
| Humidity | 66% | 66% | 67% | 69% | 70% | 72% | 72% | 73% | 72% | 70% | 68% | 66% |
|---|
| Day length | 13 | 13 | 12 | 12 | 11 | 11 | 11 | 12 | 12 | 12 | 13 | 13 |
|---|
| Sun hours | 8 | 9 | 8 | 7 | 6 | 4 | 4 | 4 | 5 | 6 | 7 | 8 |
|---|
| Sea temp | 24 | 24 | 23 | 22 | 20 | 19 | 18 | 17 | 18 | 19 | 20 | 22 |
|---|
| Balmaceda |
|---|
|
| Jan | Feb | Mar | Apr | May | Jun | Jul | Aug | Sep | Oct | Nov | Dec |
|---|
| Min temp. | 7 | 7 | 5 | 3 | 0 | -2 | -3 | -1 | 1 | 2 | 4 | 6 |
|---|
| Max temp. | 19 | 20 | 17 | 13 | 9 | 5 | 5 | 7 | 11 | 13 | 16 | 17 |
|---|
| Precip. | 25 | 20 | 40 | 50 | 65 | 85 | 65 | 55 | 40 | 40 | 30 | 30 |
|---|
| Prec. days | 8 | 6 | 9 | 11 | 14 | 15 | 13 | 13 | 10 | 10 | 8 | 8 |
|---|
| Humidity | 60% | 59% | 65% | 72% | 79% | 82% | 82% | 77% | 69% | 64% | 62% | 61% |
|---|
| Day length | 15 | 14 | 12 | 11 | 9 | 9 | 9 | 10 | 12 | 14 | 15 | 16 |
|---|
| Sun hours | 10 | 10 | 8 | 5 | 4 | 3 | 4 | 5 | 7 | 9 | 10 | 10 |
|---|
|
| Calama (2,250 meters) |
|---|
|
| Jan | Feb | Mar | Apr | May | Jun | Jul | Aug | Sep | Oct | Nov | Dec |
|---|
| Min temp. | 7 | 7 | 6 | 4 | 2 | 0 | 0 | 0 | 1 | 2 | 3 | 5 |
|---|
| Max temp. | 25 | 25 | 24 | 24 | 22 | 21 | 21 | 22 | 23 | 24 | 25 | 25 |
|---|
| Precip. | 0 | 0 | 0 | 0 | 0 | 0 | 0 | 0 | 0 | 0 | 0 | 0 |
|---|
| Prec. days | 0 | 0 | 0 | 0 | 0 | 0 | 0 | 0 | 0 | 0 | 0 | 0 |
|---|
|
| Day length | 13 | 13 | 12 | 12 | 11 | 11 | 11 | 11 | 12 | 13 | 13 | 14 |
|---|
| Sun hours | 11 | 11 | 10 | 10 | 10 | 10 | 10 | 10 | 11 | 12 | 12 | 12 |
|---|
|
| Chillan |
|---|
|
| Jan | Feb | Mar | Apr | May | Jun | Jul | Aug | Sep | Oct | Nov | Dec |
|---|
| Min temp. | 12 | 11 | 10 | 7 | 6 | 5 | 3 | 4 | 5 | 7 | 9 | 11 |
|---|
| Max temp. | 31 | 30 | 27 | 21 | 16 | 13 | 12 | 14 | 18 | 20 | 24 | 28 |
|---|
| Precip. | 15 | 25 | 25 | 70 | 205 | 230 | 175 | 125 | 80 | 65 | 30 | 15 |
|---|
| Prec. days | 2 | 2 | 3 | 7 | 12 | 14 | 13 | 12 | 9 | 7 | 4 | 2 |
|---|
| Humidity | 49% | 52% | 56% | 68% | 83% | 89% | 85% | 81% | 73% | 69% | 59% | 53% |
|---|
| Day length | 14 | 13 | 12 | 11 | 10 | 10 | 10 | 11 | 12 | 13 | 14 | 15 |
|---|
| Sun hours | 12 | 11 | 8 | 6 | 4 | 3 | 3 | 5 | 6 | 7 | 9 | 11 |
|---|
|
| Concepcion |
|---|
|
| Jan | Feb | Mar | Apr | May | Jun | Jul | Aug | Sep | Oct | Nov | Dec |
|---|
| Min temp. | 11 | 11 | 10 | 8 | 8 | 7 | 6 | 6 | 6 | 7 | 9 | 10 |
|---|
| Max temp. | 24 | 23 | 22 | 19 | 16 | 14 | 14 | 14 | 16 | 18 | 20 | 22 |
|---|
| Precip. | 15 | 15 | 25 | 70 | 185 | 230 | 200 | 155 | 85 | 55 | 35 | 20 |
|---|
| Prec. days | 3 | 3 | 4 | 8 | 14 | 16 | 15 | 14 | 10 | 8 | 5 | 4 |
|---|
| Humidity | 72% | 74% | 77% | 82% | 86% | 86% | 85% | 83% | 80% | 78% | 75% | 73% |
|---|
| Day length | 14 | 13 | 12 | 11 | 10 | 10 | 10 | 11 | 12 | 13 | 14 | 15 |
|---|
| Sun hours | 11 | 10 | 8 | 6 | 4 | 4 | 4 | 5 | 7 | 8 | 10 | 11 |
|---|
| Sea temp | 16 | 16 | 16 | 15 | 14 | 13 | 13 | 12 | 12 | 13 | 14 | 15 |
|---|
| Copiapo (390 meters) |
|---|
|
| Jan | Feb | Mar | Apr | May | Jun | Jul | Aug | Sep | Oct | Nov | Dec |
|---|
| Min temp. | 14 | 14 | 13 | 11 | 8 | 7 | 6 | 7 | 8 | 10 | 11 | 12 |
|---|
| Max temp. | 28 | 28 | 27 | 24 | 22 | 21 | 20 | 22 | 23 | 24 | 25 | 27 |
|---|
| Precip. | 0 | 0 | 0 | 0 | 0 | 5 | 5 | 5 | 0 | 0 | 0 | 0 |
|---|
| Prec. days | 0 | 0 | 0 | 0 | 0 | 1 | 1 | 0 | 0 | 0 | 0 | 0 |
|---|
| Humidity | 60% | 60% | 62% | 64% | 64% | 63% | 62% | 61% | 61% | 59% | 59% | 58% |
|---|
| Day length | 14 | 13 | 12 | 11 | 11 | 10 | 11 | 11 | 12 | 13 | 14 | 14 |
|---|
| Sun hours | 10 | 9 | 8 | 7 | 6 | 6 | 7 | 7 | 8 | 9 | 9 | 9 |
|---|
|
| Coyhaique (350 meters) |
|---|
|
| Jan | Feb | Mar | Apr | May | Jun | Jul | Aug | Sep | Oct | Nov | Dec |
|---|
| Min temp. | 9 | 8 | 7 | 4 | 3 | 0 | -1 | 1 | 2 | 4 | 6 | 8 |
|---|
| Max temp. | 20 | 21 | 18 | 14 | 11 | 7 | 7 | 9 | 12 | 15 | 17 | 19 |
|---|
| Precip. | 55 | 45 | 70 | 95 | 115 | 140 | 110 | 105 | 65 | 75 | 55 | 60 |
|---|
| Prec. days | 8 | 7 | 9 | 11 | 14 | 14 | 12 | 12 | 9 | 9 | 8 | 8 |
|---|
| Humidity | 57% | 58% | 64% | 70% | 80% | 83% | 81% | 75% | 68% | 62% | 60% | 58% |
|---|
| Day length | 15 | 14 | 12 | 11 | 9 | 9 | 9 | 10 | 12 | 14 | 15 | 16 |
|---|
| Sun hours | 8 | 8 | 6 | 5 | 3 | 2 | 3 | 4 | 5 | 7 | 8 | 8 |
|---|
|
| Curico (230 meters) |
|---|
|
| Jan | Feb | Mar | Apr | May | Jun | Jul | Aug | Sep | Oct | Nov | Dec |
|---|
| Min temp. | 13 | 12 | 10 | 7 | 6 | 5 | 4 | 4 | 6 | 8 | 10 | 12 |
|---|
| Max temp. | 31 | 30 | 27 | 22 | 17 | 13 | 13 | 16 | 19 | 22 | 26 | 29 |
|---|
| Precip. | 5 | 5 | 15 | 30 | 120 | 165 | 130 | 100 | 55 | 25 | 10 | 5 |
|---|
| Prec. days | 1 | 0 | 1 | 4 | 9 | 12 | 10 | 8 | 6 | 5 | 2 | 1 |
|---|
| Humidity | 50% | 52% | 58% | 71% | 82% | 86% | 85% | 79% | 74% | 67% | 57% | 53% |
|---|
| Day length | 14 | 13 | 12 | 11 | 10 | 10 | 10 | 11 | 12 | 13 | 14 | 14 |
|---|
| Sun hours | 11 | 11 | 8 | 6 | 3 | 2 | 3 | 4 | 5 | 7 | 9 | 10 |
|---|
|
| Iquique |
|---|
|
| Jan | Feb | Mar | Apr | May | Jun | Jul | Aug | Sep | Oct | Nov | Dec |
|---|
| Min temp. | 19 | 19 | 18 | 17 | 15 | 14 | 14 | 14 | 14 | 15 | 16 | 17 |
|---|
| Max temp. | 25 | 26 | 25 | 23 | 21 | 19 | 18 | 18 | 19 | 20 | 22 | 23 |
|---|
| Precip. | 0 | 0 | 0 | 0 | 0 | 0 | 0 | 0 | 0 | 0 | 0 | 0 |
|---|
| Prec. days | 0 | 0 | 0 | 0 | 0 | 0 | 0 | 0 | 0 | 0 | 0 | 0 |
|---|
| Humidity | 66% | 66% | 68% | 70% | 71% | 71% | 71% | 71% | 71% | 69% | 68% | 67% |
|---|
| Day length | 13 | 13 | 12 | 12 | 11 | 11 | 11 | 12 | 12 | 13 | 13 | 13 |
|---|
| Sun hours | 10 | 10 | 10 | 8 | 7 | 6 | 5 | 5 | 6 | 8 | 9 | 10 |
|---|
| Sea temp | 23 | 24 | 23 | 22 | 20 | 19 | 17 | 17 | 17 | 18 | 20 | 22 |
|---|
| La Serena |
|---|
|
| Jan | Feb | Mar | Apr | May | Jun | Jul | Aug | Sep | Oct | Nov | Dec |
|---|
| Min temp. | 14 | 14 | 13 | 11 | 10 | 8 | 7 | 8 | 9 | 10 | 11 | 13 |
|---|
| Max temp. | 22 | 22 | 21 | 19 | 17 | 16 | 16 | 16 | 17 | 18 | 19 | 20 |
|---|
| Precip. | 0 | 0 | 0 | 0 | 10 | 20 | 30 | 15 | 5 | 0 | 0 | 0 |
|---|
| Prec. days | 0 | 0 | 0 | 0 | 1 | 1 | 2 | 1 | 1 | 0 | 0 | 0 |
|---|
| Humidity | 79% | 79% | 81% | 82% | 82% | 82% | 81% | 81% | 81% | 80% | 79% | 79% |
|---|
| Day length | 14 | 13 | 12 | 11 | 11 | 10 | 10 | 11 | 12 | 13 | 14 | 14 |
|---|
| Sun hours | 8 | 8 | 6 | 5 | 5 | 5 | 5 | 6 | 6 | 6 | 7 | 8 |
|---|
| Sea temp | 18 | 19 | 18 | 17 | 16 | 15 | 14 | 14 | 14 | 14 | 15 | 17 |
|---|
| Puerto Montt |
|---|
|
| Jan | Feb | Mar | Apr | May | Jun | Jul | Aug | Sep | Oct | Nov | Dec |
|---|
| Min temp. | 9 | 9 | 8 | 6 | 5 | 4 | 3 | 4 | 4 | 5 | 7 | 8 |
|---|
| Max temp. | 21 | 21 | 19 | 16 | 14 | 11 | 11 | 12 | 13 | 15 | 17 | 19 |
|---|
| Precip. | 85 | 70 | 100 | 150 | 195 | 220 | 175 | 170 | 125 | 130 | 105 | 90 |
|---|
| Prec. days | 10 | 8 | 12 | 15 | 18 | 19 | 18 | 18 | 16 | 15 | 14 | 11 |
|---|
| Humidity | 77% | 79% | 83% | 88% | 90% | 91% | 90% | 87% | 84% | 82% | 79% | 78% |
|---|
| Day length | 15 | 14 | 12 | 11 | 10 | 9 | 10 | 11 | 12 | 13 | 14 | 15 |
|---|
| Sun hours | 7 | 7 | 5 | 4 | 2 | 2 | 2 | 3 | 4 | 5 | 6 | 6 |
|---|
| Sea temp | 15 | 15 | 14 | 13 | 12 | 11 | 11 | 11 | 11 | 12 | 13 | 14 |
|---|
| Punta Arenas |
|---|
|
| Jan | Feb | Mar | Apr | May | Jun | Jul | Aug | Sep | Oct | Nov | Dec |
|---|
| Min temp. | 7 | 7 | 5 | 3 | 1 | -1 | -1 | 0 | 1 | 3 | 4 | 6 |
|---|
| Max temp. | 16 | 16 | 14 | 11 | 8 | 5 | 5 | 6 | 9 | 11 | 13 | 15 |
|---|
| Precip. | 40 | 30 | 40 | 45 | 40 | 30 | 30 | 30 | 25 | 30 | 30 | 30 |
|---|
| Prec. days | 12 | 11 | 12 | 12 | 11 | 9 | 9 | 9 | 8 | 9 | 10 | 11 |
|---|
| Humidity | 68% | 70% | 75% | 80% | 84% | 86% | 85% | 82% | 76% | 70% | 68% | 67% |
|---|
| Day length | 16 | 14 | 12 | 10 | 8 | 8 | 8 | 10 | 12 | 14 | 16 | 17 |
|---|
| Sun hours | 7 | 6 | 5 | 4 | 3 | 2 | 2 | 4 | 5 | 6 | 7 | 7 |
|---|
| Sea temp | 10 | 10 | 10 | 9 | 8 | 7 | 6 | 6 | 6 | 6 | 7 | 8 |
|---|
| Santiago (550 meters) |
|---|
|
| Jan | Feb | Mar | Apr | May | Jun | Jul | Aug | Sep | Oct | Nov | Dec |
|---|
| Min temp. | 13 | 12 | 11 | 8 | 5 | 3 | 3 | 4 | 6 | 8 | 10 | 12 |
|---|
| Max temp. | 31 | 30 | 29 | 25 | 20 | 17 | 16 | 18 | 21 | 24 | 27 | 29 |
|---|
| Precip. | 0 | 0 | 5 | 10 | 45 | 70 | 65 | 45 | 20 | 10 | 5 | 0 |
|---|
| Prec. days | 0 | 0 | 1 | 1 | 4 | 5 | 5 | 4 | 3 | 1 | 0 | 0 |
|---|
| Humidity | 48% | 51% | 54% | 62% | 71% | 77% | 77% | 73% | 68% | 60% | 52% | 49% |
|---|
| Day length | 14 | 13 | 12 | 11 | 10 | 10 | 10 | 11 | 12 | 13 | 14 | 14 |
|---|
| Sun hours | 12 | 11 | 9 | 7 | 5 | 4 | 4 | 5 | 6 | 7 | 10 | 11 |
|---|
|
| Temuco |
|---|
|
| Jan | Feb | Mar | Apr | May | Jun | Jul | Aug | Sep | Oct | Nov | Dec |
|---|
| Min temp. | 9 | 9 | 8 | 6 | 6 | 5 | 4 | 4 | 4 | 6 | 7 | 8 |
|---|
| Max temp. | 25 | 26 | 24 | 19 | 15 | 13 | 12 | 14 | 16 | 18 | 20 | 23 |
|---|
| Precip. | 25 | 30 | 30 | 100 | 135 | 180 | 160 | 130 | 70 | 70 | 55 | 45 |
|---|
| Prec. days | 4 | 4 | 6 | 9 | 14 | 16 | 15 | 14 | 11 | 10 | 7 | 6 |
|---|
| Humidity | 69% | 69% | 74% | 81% | 86% | 87% | 86% | 82% | 79% | 78% | 76% | 73% |
|---|
| Day length | 14 | 14 | 12 | 11 | 10 | 10 | 10 | 11 | 12 | 13 | 14 | 15 |
|---|
| Sun hours | 10 | 9 | 7 | 5 | 4 | 2 | 3 | 4 | 6 | 6 | 7 | 9 |
|---|
|
| Valdivia |
|---|
|
| Jan | Feb | Mar | Apr | May | Jun | Jul | Aug | Sep | Oct | Nov | Dec |
|---|
| Min temp. | 9 | 9 | 7 | 7 | 6 | 5 | 4 | 4 | 4 | 5 | 7 | 9 |
|---|
| Max temp. | 24 | 25 | 22 | 18 | 14 | 12 | 11 | 13 | 15 | 18 | 20 | 22 |
|---|
| Precip. | 50 | 40 | 70 | 130 | 255 | 335 | 260 | 225 | 130 | 110 | 85 | 60 |
|---|
| Prec. days | 5 | 4 | 7 | 11 | 16 | 18 | 17 | 16 | 12 | 12 | 9 | 7 |
|---|
| Humidity | 63% | 64% | 74% | 83% | 90% | 92% | 90% | 85% | 79% | 75% | 71% | 68% |
|---|
| Day length | 15 | 14 | 12 | 11 | 10 | 9 | 10 | 11 | 12 | 13 | 14 | 15 |
|---|
| Sun hours | 9 | 9 | 7 | 4 | 3 | 2 | 2 | 4 | 5 | 6 | 7 | 8 |
|---|
| Sea temp | 16 | 16 | 15 | 14 | 13 | 12 | 12 | 11 | 12 | 12 | 13 | 15 |
|---|
| Valparaiso |
|---|
|
| Jan | Feb | Mar | Apr | May | Jun | Jul | Aug | Sep | Oct | Nov | Dec |
|---|
| Min temp. | 13 | 13 | 12 | 11 | 10 | 8 | 8 | 8 | 8 | 10 | 11 | 12 |
|---|
| Max temp. | 22 | 22 | 21 | 19 | 17 | 15 | 15 | 16 | 16 | 18 | 20 | 21 |
|---|
| Precip. | 0 | 0 | 5 | 15 | 55 | 85 | 110 | 60 | 25 | 10 | 10 | 0 |
|---|
| Prec. days | 0 | 0 | 1 | 2 | 9 | 9 | 8 | 8 | 5 | 2 | 1 | 0 |
|---|
|
| Day length | 14 | 13 | 12 | 11 | 10 | 10 | 10 | 11 | 12 | 13 | 14 | 14 |
|---|
| Sun hours | 9 | 9 | 7 | 6 | 4 | 3 | 3 | 4 | 5 | 6 | 7 | 8 |
|---|
| Sea temp | 17 | 18 | 17 | 16 | 15 | 14 | 14 | 13 | 13 | 14 | 15 | 16 |
|---|
See also the
temperatures month by month