Select units of measurement for the temperature and rainfall tables (metric or imperial).
Average weather, temperature, rainfall, sunshine
Australia, a huge country of more than 7.5 million square kilometers (3 million square miles), crossed by the Tropic of Capricorn, has an
arid climate, desert or semi-desert, in the vast central and western area, which is sparsely populated. In the far north (see Darwin), the climate is
tropical with a dry and a rainy season.
The most populated areas have a more
temperate climate, of the Mediterranean type on the coasts facing south-west (see Perth, Adelaide), humid subtropical on the east coast (see Brisbane, Sydney), and oceanic in the extreme southeast (see Melbourne) and in Tasmania.
In the southeast there is also a mountainous area, crossed by the Australian Alps, where it can snow in winter.
Being in the Southern Hemisphere, Australia has, of course, reversed seasons in comparison with Europe or North America.
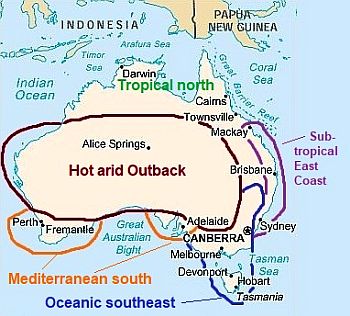 Climate zones in Australia
Precipitation
Climate zones in Australia
Precipitation is scarce in the vast arid zone, where it ranges from 150 to 350 millimeters (6 to 13.5 inches) per year, it is at an intermediate level in the south (see Perth, Adelaide, Melbourne, Canberra), where it fluctuates between 400 and 700 mm (15.5 and 27.5 in) per year, while it is quite abundant on the east coast, where it ranges from 1,000 mm (40 in) in Sydney and Brisbane to 1,500 mm (60 in) on the Sunshine Coast. In the tropical north, 1,200 to 2,000 mm (47 to 80 in) of rain usually fall per year, but in the northeast there is also an area where rainfall exceeds 3,000 mm (120 in).
Australia is generally a
sunny country. On average, there are 3,500/3,600 hours of sunshine per year in the desert area, 3,200 hours on the southwest coast (see Perth), 3,000/3,100 hours in the tropical north, and 3,000 hours on the east coast (see Brisbane). Only in the southeast, it goes below 2,700 hours in Sydney and below 2,400 in Melbourne and Tasmania (which is still an acceptable level).
Index
The seasons
Winter is warm in the north, very mild in the desert areas, but with cold nights, mild in the main cities of the central-south, and cold in the mountains. In July, the coldest month, the average temperature is around 25 °C (77 °F) in Darwin, 15 °C (59 °F) in Brisbane, 12/13 °C (54/55 °F) in the desert area, but also in Perth and Sydney, 10 °C (50 °F) in Melbourne, 8.5 °C (47 °F) in Hobart (Tasmania), and 6 °C (43 °F) in Canberra (at 600 meters or 2,000 feet above sea level).
Although the winter is mild, the center-south, where almost all the main cities are located, can be affected by
cold winds of Antarctic origin, and since some houses have no heating or are poorly insulated, the feeling of cold can be greater than you might expect. In any case, on the coldest nights, the temperature can drop to around 0 °C (32 °F) in the southern coastal cities and even in the desert.
Summer is hot and muggy in the north and on the east coast, and torrid in the desert areas, while it is milder in the extreme south-east and in Tasmania.
The average temperature of January, the warmest month, is around 28 °C (82.5 °F) in the tropical north (see Darwin), while it exceeds 30 °C (86 °F) in the central and western desert area. In south-central cities (see Brisbane, Sydney, Perth) it is around 24/25 °C (75/77 °F), while in the south, it is around 21.5 °C (70.5 °F) in Canberra, 20 °C (68 °F) in Melbourne and 18 °C (64.5 °F) in Hobart.
In summer, the coasts can be affected by
heat waves caused by torrid winds blowing from the desert, sometimes accompanied by sand, with temperatures of 40 °C (104 °F) and more. The wind, associated with drought, can cause more or less widespread
fires.
In the warm season, central and northern Australia, especially the coasts, can be affected by
tropical cyclones.
Hot arid Outback
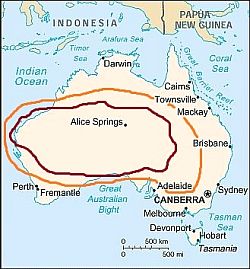 Australia, area with an arid climate
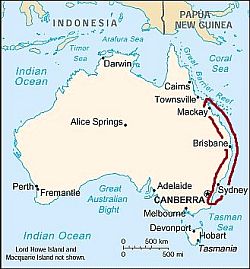
In the vast area, generically called "
Outback", the climate is arid: it is considered desert where precipitation is between 150 and 250 millimeters (6 and 10 inches) per year (see the area inside the burgundy line) and semi-desert in the area where annual precipitation is between 250 and 400 mm (10 and 16 in) per year (the area within the orange line).
In Australia, there are several
deserts, such as the Great Sandy Desert, the Gibson Desert, the Great Victoria Desert, and the Simpson Desert. In this area, there are no large cities and population density is low.
Rainfall usually occurs in the form of thunderstorms during the warm period, except in the southernmost area, facing the coast (Great Australian Bight), where it falls in winter.
Temperatures vary depending on areas: winter is milder in the northern part and on the west coast, while summer is very hot almost everywhere, except in the southernmost part. Heat records are close to 50 °C (122 °F).
In winter, it can get cold at night, especially in inland areas.
On the
north-west coast of Western Australia (see Eighty Mile Beach, Port Hedland, Onslow), the heat is intense even along the coast.
For example, in
Port Hedland, the average daily temperature in January, the hottest month, is 31 °C (88 °F). During the day, the temperature can exceed 40 °C (104 °F) from September to April, and the highest record is 49 °C (120 °F).
Moving
inland, in the central-western part of the desert, the summer heat, although very intense, is slightly tempered by the altitude, which often exceeds 400 metres (1,300 feet).

For example, in
Alice Springs, located in the state of the Northern Territory, just south of the Tropic of Capricorn and practically at the center of Australia, in the summer months the heat records are around 45 °C (113 °F). On the other hand, on winter nights the temperature can drop to a few degrees below freezing, although during the day, with the sun shining, the temperature rises a lot and the air becomes pleasantly mild.
In the
Uluru-Kata Tjuta National Park (see
Yulara), where the famous sandstone monolith
Uluru (or Ayers Rock) is located, but also the rock formation called
Kata Tjuta, the average altitude exceeds 500 meters (1,600 ft).
")
Further southeast, the
Oodnadatta Track (which crosses the towns of Marla,
Oodnadatta, William Creek and Marree), mostly located below 200 meters (650 ft) above sea level, is particularly hot and dry. In fact, the heat record is around 48 °C or 118.5 °F (although, according to some sources, it would exceed 50 °C or 122 °C), and less then 200 mm (8 in) of rain fall per year.
About 100 km (60 mi) northeast od Oodnadatta is the
Simpson Desert. About 150 km (100 mi) to the southeast, on the other hand, is
Lake Kati Thanda (or Lake Eyre), a large, often dry, endorheic salt lake located in a depression that reaches up to 15 meters (50 ft) below sea level. Once every few years it can be partially filled, and sometimes in a century, following particularly abundant rains, generally in the years of La Niña strong, it can be completely filled. In March 2019, it hit its highest level in 50 years.
Mediterranean south
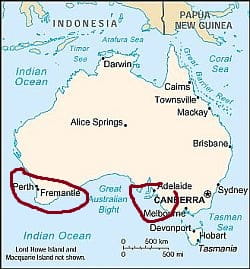 Australia, areas with a Mediterranean climate
In the south-western part of the states of Western Australia and South Australia (see Perth, Adelaide), the climate can be defined as
Mediterranean, in fact, the winters are mild and rainy and the summers are hot and sunny. However, compared to the areas located in the Mediterranean Sea, the climate here is more
unstable and windy, due to the proximity of both the ocean and the desert.
In
Perth, Western Australia, the daily average temperature ranges from 13.5 °C (56.5 °F) in July to 25 °C (77 °F) in January and February.
The temperature never drops below freezing, although in the metropolitan area there may be slight frosts at night in the winter months. From November to March, the hot wind from the desert can raise the temperature to around 40 °C (104 °F) for a few days, with peaks of 45 °C (113 °F), but highs are normally around 30/32 °C (86/90 °F) and lively sea breezes blow from the ocean in the afternoon.
In a typical year, 700 mm (27.5 in) of rain fall, most of which occur from May to August.
The ocean temperature in Perth is cool all year round, but all in all, it becomes acceptable for swimming from January to May, when it reaches 22/23 °C (72/73 °F).

South of Perth, in the south-western tip of Australia, in towns such as Denmark and Pemberton, the rains reach 1,000/1,200 mm (39/47 in) per year, but still with a Mediterranean pattern (ie with rainy winters and dry summers); summers are a bit cooler, but short waves of intense heat are possible here as well.
In
Adelaide, South Australia, the climate is similar to that of Perth, although summer is slightly cooler and winter less rainy. The average temperature ranges from 22.7 °C (74 °F) in February to 11.3 °C (52.3 °F) in July. Here, too, the summer heat is cooled by sea breezes, and here too, from November to March, short heat waves are possible, with peaks around 40 °C (104 °F).
Tropical north
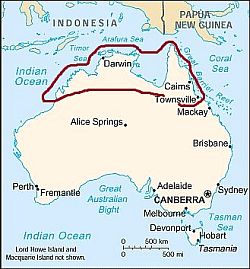 Australia, area with a tropical climate
The vast northern area of Australia has a
tropical climate, with a dry, sunny season ("the dry", usually from May to October) and a rainy and muggy season ("the wet", usually from November to April). Annual rainfall exceeds 400 mm (15.5 in), and it's more abundant along the northernmost and the eastern coasts, where it generally ranges from 1,200 to 2,000 mm (47 to 80 in). The tropical rains mainly occur in the form of downpours or thunderstorms.
In the driest areas, we find savanna-type vegetation, while in the wettest areas of the north-eastern coast, we find rainforests.
The
sea is warm all year round, but especially in summer, when the energy from the sea can cause the formation of
tropical cyclones.
In the
far north, in Arnhem Land and the Cape York Peninsula, the weather is hot and summer-like all year round, while the more you go to the south, the greater the difference is between the seasons.
In
Darwin, the capital of the Northern Territory, there is intense heat throughout the year, but it's muggy and sweltering in the rainy season, while it's more bearable in the dry season, especially from June to August, when the maximum temperatures are around 31 °C (88 °F).
In Darwin, 1,830 millimeters (72 inches) of rain fall per year, the majority of which occur from November to early April. The rainiest month is January, with 470 mm (18.5 in) of rain. On the contrary, from May to September it almost never rains.

Along the north-eastern coast, in cities like
Cairns (Queensland), the rains are abundant, in fact, almost 2,000 mm (80 in) of rain fall annually, including more than 100 mm (4 in) from December to April. In any case, the sun shines quite often throughout the year, since the rains, however intense, generally do not last long. Here, too, summer is hot and humid, while winter is the driest season. Since it sits more to the south, the city is also more temperate in winter, with a daily average of around 22 °C (72 °F) in July.
South of Cairns we find Australia's wettest area, where the winds from the ocean meet a mountain range. Mount
Bellenden Ker is rain-soaked, so much so that at the top, at 1,593 meters (5,226 feet) above sea level, up to 8 meters (315 inches or 26.2 feet) of rain fall every year! Nearby we find some very rainy small towns, where there is no dry season because it rains enough even in winter: in
Innisfail, an average of 3,500 millimeters (138 in) of rain falls per year, while in
Babinda, it reaches as much as 4,200 mm (165 in), with a maximum of 800 mm (31.5 in) in March and a minimum of 115 mm (4.5 in) in August.
At some distance from the east coast of Queensland, in the Coral Sea (belonging to the Pacific Ocean) we find the
Great Barrier Reef, the world's largest coral reef, up to 2,300 km (1,400 miles) long.
Subtropical East Coast
 Australia, area with a humid subtropical climate
Proceeding towards the south-east, on the east coast, in Queensland (see
Mackay,
Sunshine Coast, Brisbane, Gold Coast) and New South Wales (see
Byron Bay,
Port Macquarie, Sydney), the temperature gradually decreases, so the climate is more enjoyable, and can be defined as
humid subtropical.
The winds usually blow from the east, from the ocean, also bringing a good amount of rain, especially in summer, when thunderstorms are quite frequent. Rainfall ranges from 1,000 to 1,500 millimeters (40 to 60 in) per year.
Winter, from June to August, is very mild, with many sunny days, sometimes, however it can get cold at night, to the point that the temperature can approach freezing.
Waves of scorching heat from the desert are rarer than in other zones of Australia, but they are still possible from October to March.

In
Brisbane, the capital of Queensland, the average temperature ranges from 15 °C (59 °F) in July to 25 °C (77 °F) in January.
In the Brisbane area (e.g. in
Gold Coast), the sea is warm in the summer months: it exceeds 24 °C (75 °F) from December to April, so it's good for swimming, while in winter, from June to September, the sea is cool, around 21 °C (70 °F), but all in all, it's not impossible to enjoy the water.
 Sydney
 is located further south, and therefore has a slightly cooler climate: here, the average temperature ranges from 24 °C (75 °F) in January to 13 °C (55.5 °F) in July.
Rainfall amounts to 1,000 millimeters (40 in) per year, and it is well distributed over the seasons, even though the rainiest season is autumn. In summer, the rains can occur in the form of downpours or thunderstorms.
Waves of scorching heat are not so rare, and are possible from November to March, often accompanied by strong gusts of dry wind that can spread fires in the hills surrounding the city.
Oceanic southeast
 Australia, area with an oceanic climate
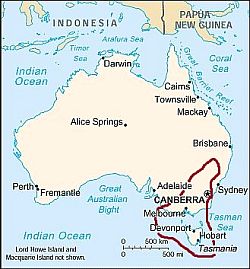
In the south-east, in the states of New South Wales and Victoria, there is an
oceanic climate, with rainfall generally not abundant, but well distributed over the seasons. The weather is cooler in Tasmania and along the southernmost coast, as well as in hilly and mountainous areas.
The sea temperature is significantly lower than in the other parts of Australia, and remains fairly cool even in the summer months.
 Canberra
, the Australian Capital, is located at 600 meters (2,000 feet) above sea level, and because of the altitude it has a cool climate, in fact the average temperature ranges from 21.5 °C (70.5 °F) in January to 6 °C (43 °F) in July. Summer is therefore not so warm, while winter is quite cold, at least by Australian standards, and sometimes it can be foggy.
In winter, frosts and even some light snowfalls are possible, but sometimes it can be a bit cold at night even in summer.
During summer, from November to February, there can be heatwaves here as well, during which the temperatures can rise to around 40 °C (104 °F).
Rainfall is not abundant, since it amounts to 580 mm (22.8 in) per year, but the rains are distributed fairly evenly throughout the year; in late spring and summer, the rains are mainly due to thunderstorms that form in the surrounding mountainous area.
 Melbourne
 is located further south, in the state of Victoria, and overlooks a bay (Port Phillip Bay) which opens into the strait that separates Australia from Tasmania (Bass Strait). The climate is quite
cool, windy and unstable. The average temperature ranges from 20.5 °C (68.5 °F) in January and February to 10 °C (49 °F) in July.
Here too, sometimes there may be heat waves (which are more intense from November to March), though usually short-lived. Summer is usually pleasantly warm, in fact, the Australian Open tennis tournament is held in January, but there'a rule called Heat Policy, whereby matches are suspended with extremely high temperatures.
In summer, the sun frequently shines (though not always), while from May to August there are 4/5 hours of sunshine per day. The rains are not abundant, reaching only 600 mm (23.5 in) per year, but they are well distributed, with a relative minimum in summer.
Australian Alps
In south-eastern Australia, between Melbourne and Canberra, there is a mountain range, called
Australian Alps; the highest mountain in the chain and across Australia is Mount Kosciuszko, which reaches 2,228 meters (7,310 feet). This area is humid and rainy, cold in winter, even snowy above 1,500 meters (5,000 feet), and cool in summer.
In the part called
Snowy Mountains, there are resorts equipped for winter sports.

In
Perisher, ski resort located at 1,700 meters (5,575 feet) above sea level, the average temperature ranges from -0.5 °C (31 °F) in July to 13.5 °C (56.5 °F) in January.
Tasmania
Further south we find
Tasmania, the southernmost island, which is exposed to the westerly winds all year round. However, every now and then, during winter, a cold air mass can reach the island, and snowfall can occur in inland hills and mountains. On the other hand, in summer, even Tasmania can sometimes be reached by the hot wind from the desert, although it arrives generally weakened.
Rainfall is more abundant in the wester part, where it exceeds 1,200 mm (47 in) per year.
The capital,
Hobart, is located in the eastern part and receives only 565 mm (22.2 in) of rain, which, however, is well distributed throughout the year, and occurs in the form of frequent showers or drizzles. Summer is quite cool, in fact the average of the warmest month, January, is 18 °C (64 °F).
The temperature of the sea in Tasmania is cold all year round, and it reaches at most 17 °C (63 °F) in February and March in the southern part (see Hobart) and 18 °C (64 °F) in the north.
Cyclones
Australia can be affected by
tropical cyclones, intense low-pressure areas that are formed when the sea is very warm, and is therefore able to provide enough energy. Cyclones bring strong winds and torrential rains and affect mainly the northern coasts, although they can sometimes penetrate the interior (especially in Western Australia), weakening along the way but still bringing heavy rains.
Cyclones are generally formed between mid-November and mid-May, but the phenomenon is more likely from January to mid-April.
In the following image, we can see the areas that have been affected by cyclones in the period 1950-2005 (the points refer to the eye of the cyclone, so the affected area is larger).
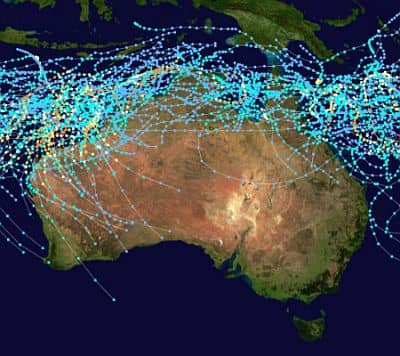 Area affected by cyclones in Australia
El Niño and La Niña
Australia's climate is also affected by the phenomenon known as
El Niño, which is associated with
drought more or less severe throughout the country, particularly along the north and east coast, where it reduces the summer rains, and in the south, where droughts are accompanied by
hot winds from the desert, which can cause fires.
The opposite phenomenon,
La Niña, brings
rainfall more abundant than usual in the north and east, especially in spring and summer, and also an increase in the number of cyclones.
When to go
If you plan to visit
all of Australia, not just the south but also the vast arid Outback and the tropical north, you may prefer
winter, from June to August, which allows you to avoid the heat, which can be intense in the other seasons, especially in the north-central, and in summer in the south. Going in winter would also permit you to avoid the rains (and sometimes the cyclones) that can affect the north in summer. Of course, winter in the south is quite cold, it can be very rainy in Perth and in western Tasmania, but if you don't like the heat this is the best solution.
If you intend to visit mainly the
southern areas, where the major cities are located, and maybe you want to make a quick tour to the central and northern regions, trying to avoid the heat as much as possible, you can choose
spring and autumn, and in particular April-May or September-October.
You can visit the southern areas also in late spring and summer, especially in November-December in Sydney, and from November to February in Melbourne, taking into account that sometimes there may be some scorching days.
What to pack
Winter (June to August).
In the tropical north and Darwin, bring lightweight clothing of natural fibers, a hat for the sun, sunscreen, a scarf for the breeze, and a light sweatshirt for the evening and air-conditioned places.
In the desert, bring spring/autumn clothes (light for the day), a sweater, a wind jacket, a warm jacket for the night, and a scarf for the sand. Sun hat, sunscreen.
In the north-east (see Cairns, Innisfail), pack light clothes for the day, a sweatshirt for the evening, and possibly a raincoat for the rain showers. When going to the reef, you can bring snorkeling equipment, including water shoes or rubber-soled shoes.
In the center-south and the major cities, pack spring/autumn clothes, a sweater, a warm jacket for the evening and for windy days, and a raincoat or umbrella. In the southern mountains, bring warm clothes, such as a fleece, a down jacket, and gloves.
In Canberra and Tasmania, warm clothes, such as a sweater, a down jacket, and a hat.
Summer (December to February).
In the tropical north and Darwin, and in the north-east down to Brisbane, bring lightweight clothing of natural fibers, sunscreen, a scarf for the breeze, a light sweatshirt for the evening and for air-conditioned places, and a light raincoat for thunderstorms. When going to the reef, you can bring snorkeling equipment, including water shoes or rubber-soled shoes.
For the desert, bring lightweight, loose-fitting clothing made of natural fabric (cotton or linen), a desert turban, sunscreen, sunglasses, a light sweatshirt for the evening, a sweatshirt for the night, a sleeping bag for outdoor overnight stays, and desert boots.
In the center-south and the major cities, pack light clothing, a sweatshirt for the breeze and for cool days, a scarf for the wind-borne sand and dust, possibly a light jacket and an umbrella, especially in Canberra, Sydney and Melbourne.
For Tasmania, spring/autumn clothes, a sweater, and a jacket.
Climate data - Australia
| Adelaide |
|---|
Adelaide, location on the map |
|---|
| Jan | Feb | Mar | Apr | May | Jun | Jul | Aug | Sep | Oct | Nov | Dec |
|---|
| Min temp. | 17 | 17 | 15 | 12 | 10 | 8 | 7 | 8 | 9 | 11 | 14 | 15 |
|---|
| Max temp. | 29 | 28 | 26 | 22 | 19 | 16 | 15 | 16 | 19 | 22 | 24 | 26 |
|---|
| Precip. | 20 | 20 | 20 | 30 | 45 | 60 | 50 | 50 | 45 | 35 | 25 | 25 |
|---|
| Prec. days | 3 | 2 | 3 | 5 | 8 | 10 | 10 | 10 | 8 | 6 | 4 | 4 |
|---|
| Humidity | 50% | 51% | 55% | 59% | 69% | 75% | 74% | 70% | 64% | 57% | 53% | 51% |
|---|
| Day length | 14 | 13 | 12 | 11 | 10 | 10 | 10 | 11 | 12 | 13 | 14 | 14 |
|---|
| Sun hours | 10 | 10 | 9 | 7 | 5 | 5 | 5 | 6 | 7 | 8 | 9 | 10 |
|---|
| Sea temp | 20 | 21 | 20 | 19 | 18 | 16 | 15 | 14 | 14 | 16 | 17 | 19 |
|---|
| Alice Springs (575 meters) |
|---|
Alice Springs, location on the map |
|---|
| Jan | Feb | Mar | Apr | May | Jun | Jul | Aug | Sep | Oct | Nov | Dec |
|---|
| Min temp. | 22 | 21 | 18 | 13 | 8 | 5 | 4 | 6 | 11 | 15 | 18 | 21 |
|---|
| Max temp. | 37 | 36 | 34 | 29 | 24 | 20 | 21 | 24 | 29 | 32 | 34 | 36 |
|---|
| Precip. | 50 | 40 | 20 | 20 | 20 | 10 | 15 | 5 | 10 | 20 | 35 | 40 |
|---|
| Prec. days | 4 | 3 | 2 | 1 | 2 | 2 | 1 | 1 | 1 | 2 | 4 | 5 |
|---|
| Humidity | 32% | 35% | 33% | 35% | 46% | 52% | 46% | 34% | 27% | 27% | 29% | 32% |
|---|
| Day length | 13 | 13 | 12 | 12 | 11 | 11 | 11 | 11 | 12 | 13 | 13 | 14 |
|---|
| Sun hours | 10 | 10 | 10 | 10 | 8 | 8 | 9 | 10 | 10 | 10 | 10 | 10 |
|---|
|
| Brisbane |
|---|
Brisbane, location on the map |
|---|
| Jan | Feb | Mar | Apr | May | Jun | Jul | Aug | Sep | Oct | Nov | Dec |
|---|
| Min temp. | 21 | 21 | 19 | 16 | 13 | 10 | 9 | 9 | 12 | 15 | 18 | 19 |
|---|
| Max temp. | 29 | 29 | 28 | 26 | 24 | 21 | 21 | 22 | 24 | 26 | 27 | 28 |
|---|
| Precip. | 140 | 150 | 115 | 60 | 60 | 65 | 25 | 35 | 30 | 80 | 90 | 130 |
|---|
| Prec. days | 8 | 10 | 10 | 7 | 6 | 7 | 4 | 4 | 4 | 7 | 8 | 9 |
|---|
| Humidity | 72% | 73% | 73% | 72% | 71% | 71% | 67% | 64% | 66% | 68% | 69% | 71% |
|---|
| Day length | 14 | 13 | 12 | 11 | 11 | 10 | 11 | 11 | 12 | 13 | 14 | 14 |
|---|
| Sun hours | 9 | 8 | 8 | 8 | 8 | 7 | 8 | 9 | 9 | 9 | 9 | 9 |
|---|
| Sea temp | 26 | 27 | 26 | 25 | 24 | 23 | 22 | 21 | 22 | 23 | 24 | 25 |
|---|
| Cairns |
|---|
Cairns, location on the map |
|---|
| Jan | Feb | Mar | Apr | May | Jun | Jul | Aug | Sep | Oct | Nov | Dec |
|---|
| Min temp. | 24 | 24 | 23 | 22 | 20 | 18 | 17 | 17 | 19 | 21 | 22 | 24 |
|---|
| Max temp. | 32 | 31 | 31 | 30 | 28 | 26 | 26 | 27 | 29 | 30 | 31 | 32 |
|---|
| Precip. | 385 | 480 | 375 | 180 | 80 | 45 | 35 | 25 | 30 | 65 | 85 | 185 |
|---|
| Prec. days | 16 | 15 | 15 | 14 | 10 | 7 | 6 | 4 | 4 | 6 | 8 | 11 |
|---|
| Humidity | 77% | 79% | 77% | 76% | 74% | 72% | 70% | 69% | 68% | 70% | 71% | 74% |
|---|
| Day length | 13 | 13 | 12 | 12 | 11 | 11 | 11 | 12 | 12 | 12 | 13 | 13 |
|---|
| Sun hours | 7 | 6 | 6 | 7 | 7 | 7 | 7 | 8 | 9 | 9 | 8 | 8 |
|---|
| Sea temp | 29 | 29 | 29 | 28 | 26 | 25 | 24 | 24 | 25 | 26 | 27 | 28 |
|---|
| Canberra (570 meters) |
|---|
Canberra, location on the map |
|---|
| Jan | Feb | Mar | Apr | May | Jun | Jul | Aug | Sep | Oct | Nov | Dec |
|---|
| Min temp. | 14 | 13 | 11 | 6 | 2 | 1 | 0 | 1 | 3 | 6 | 9 | 12 |
|---|
| Max temp. | 29 | 28 | 25 | 21 | 17 | 13 | 12 | 14 | 17 | 21 | 24 | 27 |
|---|
| Precip. | 60 | 55 | 40 | 25 | 30 | 50 | 45 | 45 | 55 | 50 | 70 | 55 |
|---|
| Prec. days | 5 | 5 | 4 | 4 | 4 | 6 | 6 | 6 | 7 | 7 | 8 | 5 |
|---|
| Humidity | 55% | 59% | 62% | 66% | 72% | 78% | 76% | 70% | 65% | 61% | 58% | 55% |
|---|
| Day length | 14 | 13 | 12 | 11 | 10 | 10 | 10 | 11 | 12 | 13 | 14 | 14 |
|---|
| Sun hours | 10 | 9 | 8 | 7 | 6 | 5 | 6 | 7 | 8 | 9 | 9 | 9 |
|---|
|
| Darwin |
|---|
Darwin, location on the map |
|---|
| Jan | Feb | Mar | Apr | May | Jun | Jul | Aug | Sep | Oct | Nov | Dec |
|---|
| Min temp. | 25 | 25 | 25 | 24 | 22 | 20 | 19 | 20 | 23 | 25 | 25 | 26 |
|---|
| Max temp. | 32 | 32 | 32 | 33 | 32 | 31 | 31 | 32 | 33 | 34 | 34 | 33 |
|---|
| Precip. | 470 | 410 | 315 | 105 | 20 | 0 | 0 | 0 | 15 | 70 | 145 | 280 |
|---|
| Prec. days | 20 | 18 | 17 | 8 | 2 | 0 | 0 | 0 | 2 | 6 | 10 | 15 |
|---|
| Humidity | 80% | 81% | 79% | 70% | 60% | 55% | 55% | 57% | 63% | 66% | 71% | 76% |
|---|
| Day length | 13 | 12 | 12 | 12 | 12 | 11 | 12 | 12 | 12 | 12 | 13 | 13 |
|---|
| Sun hours | 6 | 6 | 7 | 9 | 10 | 10 | 10 | 10 | 10 | 10 | 8 | 6 |
|---|
| Sea temp | 30 | 30 | 30 | 30 | 29 | 27 | 26 | 26 | 28 | 29 | 30 | 31 |
|---|
| Gold Coast |
|---|
Gold Coast, location on the map |
|---|
| Jan | Feb | Mar | Apr | May | Jun | Jul | Aug | Sep | Oct | Nov | Dec |
|---|
| Min temp. | 22 | 22 | 21 | 18 | 15 | 13 | 12 | 12 | 15 | 17 | 19 | 20 |
|---|
| Max temp. | 29 | 29 | 28 | 26 | 24 | 21 | 21 | 22 | 24 | 25 | 27 | 28 |
|---|
| Precip. | 135 | 185 | 135 | 120 | 100 | 115 | 50 | 55 | 40 | 85 | 105 | 130 |
|---|
| Prec. days | 9 | 10 | 11 | 9 | 8 | 7 | 5 | 4 | 5 | 6 | 8 | 9 |
|---|
| Humidity | 70% | 71% | 70% | 66% | 65% | 64% | 60% | 58% | 62% | 64% | 66% | 68% |
|---|
| Day length | 14 | 13 | 12 | 11 | 11 | 10 | 11 | 11 | 12 | 13 | 14 | 14 |
|---|
|
| Sea temp | 26 | 26 | 26 | 25 | 24 | 23 | 22 | 21 | 22 | 22 | 24 | 25 |
|---|
| Hobart |
|---|
Hobart, location on the map |
|---|
| Jan | Feb | Mar | Apr | May | Jun | Jul | Aug | Sep | Oct | Nov | Dec |
|---|
| Min temp. | 13 | 12 | 11 | 9 | 7 | 5 | 4 | 5 | 6 | 8 | 10 | 11 |
|---|
| Max temp. | 23 | 22 | 21 | 18 | 16 | 13 | 13 | 14 | 16 | 18 | 20 | 21 |
|---|
| Precip. | 45 | 40 | 35 | 45 | 40 | 45 | 45 | 65 | 55 | 55 | 50 | 55 |
|---|
| Prec. days | 6 | 5 | 7 | 7 | 6 | 7 | 8 | 10 | 10 | 9 | 8 | 7 |
|---|
| Humidity | 58% | 62% | 63% | 66% | 69% | 73% | 71% | 67% | 63% | 61% | 60% | 58% |
|---|
| Day length | 15 | 14 | 12 | 11 | 10 | 9 | 9 | 10 | 12 | 13 | 15 | 15 |
|---|
| Sun hours | 8 | 8 | 7 | 6 | 5 | 4 | 5 | 6 | 6 | 8 | 8 | 8 |
|---|
| Sea temp | 16 | 17 | 17 | 16 | 15 | 14 | 13 | 12 | 12 | 13 | 14 | 15 |
|---|
| Melbourne |
|---|
Melbourne, location on the map |
|---|
| Jan | Feb | Mar | Apr | May | Jun | Jul | Aug | Sep | Oct | Nov | Dec |
|---|
| Min temp. | 15 | 15 | 13 | 10 | 8 | 6 | 6 | 6 | 7 | 9 | 11 | 12 |
|---|
| Max temp. | 26 | 26 | 24 | 20 | 17 | 14 | 14 | 15 | 17 | 20 | 22 | 24 |
|---|
| Precip. | 45 | 50 | 40 | 55 | 45 | 50 | 40 | 45 | 55 | 55 | 65 | 60 |
|---|
| Prec. days | 6 | 5 | 6 | 7 | 8 | 9 | 8 | 9 | 10 | 9 | 8 | 6 |
|---|
| Humidity | 63% | 65% | 65% | 69% | 75% | 79% | 77% | 73% | 70% | 66% | 65% | 63% |
|---|
| Day length | 14 | 14 | 12 | 11 | 10 | 10 | 10 | 11 | 12 | 13 | 14 | 15 |
|---|
| Sun hours | 9 | 8 | 7 | 6 | 5 | 4 | 4 | 5 | 6 | 7 | 8 | 8 |
|---|
| Sea temp | 18 | 19 | 19 | 18 | 16 | 15 | 14 | 13 | 13 | 14 | 15 | 17 |
|---|
| Perisher (1,740 meters) |
|---|
Perisher, location on the map |
|---|
| Jan | Feb | Mar | Apr | May | Jun | Jul | Aug | Sep | Oct | Nov | Dec |
|---|
| Min temp. | 7 | 6 | 5 | 1 | -1 | -3 | -4 | -3 | -1 | 1 | 4 | 5 |
|---|
| Max temp. | 20 | 18 | 15 | 12 | 7 | 4 | 3 | 4 | 7 | 11 | 14 | 17 |
|---|
| Precip. | 115 | 90 | 90 | 70 | 105 | 175 | 155 | 245 | 245 | 160 | 155 | 90 |
|---|
| Prec. days | 8 | 8 | 9 | 9 | 10 | 12 | 12 | 13 | 14 | 13 | 11 | 6 |
|---|
| Humidity | 61% | 65% | 62% | 65% | 73% | 85% | 88% | 84% | 79% | 68% | 61% | 56% |
|---|
| Day length | 14 | 13 | 12 | 11 | 10 | 10 | 10 | 11 | 12 | 13 | 14 | 15 |
|---|
|
|
| Perth |
|---|
Perth, location on the map |
|---|
| Jan | Feb | Mar | Apr | May | Jun | Jul | Aug | Sep | Oct | Nov | Dec |
|---|
| Min temp. | 18 | 18 | 16 | 14 | 11 | 9 | 8 | 8 | 9 | 11 | 13 | 16 |
|---|
| Max temp. | 32 | 32 | 30 | 26 | 22 | 20 | 18 | 19 | 21 | 24 | 27 | 30 |
|---|
| Precip. | 15 | 15 | 20 | 30 | 80 | 125 | 140 | 120 | 80 | 35 | 30 | 10 |
|---|
| Prec. days | 1 | 1 | 2 | 4 | 9 | 12 | 14 | 13 | 11 | 5 | 4 | 2 |
|---|
| Humidity | 47% | 48% | 51% | 59% | 66% | 72% | 74% | 71% | 68% | 60% | 54% | 48% |
|---|
| Day length | 14 | 13 | 12 | 11 | 10 | 10 | 10 | 11 | 12 | 13 | 14 | 14 |
|---|
| Sun hours | 12 | 11 | 10 | 8 | 7 | 6 | 6 | 7 | 8 | 10 | 11 | 12 |
|---|
| Sea temp | 22 | 22 | 23 | 22 | 22 | 21 | 20 | 19 | 19 | 19 | 20 | 21 |
|---|
| Port Hedland |
|---|
Port Hedland, location on the map |
|---|
| Jan | Feb | Mar | Apr | May | Jun | Jul | Aug | Sep | Oct | Nov | Dec |
|---|
| Min temp. | 26 | 26 | 25 | 22 | 18 | 15 | 13 | 14 | 16 | 20 | 22 | 25 |
|---|
| Max temp. | 36 | 36 | 37 | 36 | 31 | 28 | 28 | 30 | 33 | 36 | 36 | 37 |
|---|
| Precip. | 75 | 80 | 70 | 20 | 20 | 30 | 10 | 5 | 0 | 0 | 0 | 20 |
|---|
| Prec. days | 4 | 5 | 3 | 1 | 2 | 2 | 1 | 0 | 0 | 0 | 0 | 2 |
|---|
| Humidity | 67% | 67% | 60% | 52% | 48% | 48% | 45% | 43% | 48% | 49% | 53% | 60% |
|---|
| Day length | 13 | 13 | 12 | 12 | 11 | 11 | 11 | 11 | 12 | 13 | 13 | 13 |
|---|
| Sun hours | 10 | 9 | 9 | 10 | 9 | 8 | 9 | 10 | 10 | 11 | 11 | 11 |
|---|
| Sea temp | 29 | 30 | 30 | 29 | 27 | 25 | 24 | 23 | 24 | 25 | 27 | 28 |
|---|
| Sydney |
|---|
Sydney, location on the map |
|---|
| Jan | Feb | Mar | Apr | May | Jun | Jul | Aug | Sep | Oct | Nov | Dec |
|---|
| Min temp. | 20 | 20 | 18 | 15 | 12 | 10 | 9 | 9 | 12 | 14 | 16 | 18 |
|---|
| Max temp. | 28 | 27 | 26 | 23 | 21 | 18 | 18 | 19 | 22 | 24 | 25 | 26 |
|---|
| Precip. | 80 | 120 | 95 | 95 | 90 | 125 | 70 | 65 | 60 | 55 | 70 | 65 |
|---|
| Prec. days | 8 | 9 | 9 | 8 | 8 | 9 | 7 | 5 | 6 | 8 | 9 | 8 |
|---|
| Humidity | 70% | 71% | 70% | 69% | 67% | 69% | 64% | 59% | 59% | 62% | 66% | 67% |
|---|
| Day length | 14 | 13 | 12 | 11 | 10 | 10 | 10 | 11 | 12 | 13 | 14 | 14 |
|---|
| Sun hours | 8 | 7 | 7 | 7 | 7 | 6 | 7 | 8 | 8 | 8 | 7 | 8 |
|---|
| Sea temp | 24 | 24 | 24 | 23 | 22 | 20 | 19 | 19 | 19 | 20 | 21 | 22 |
|---|
| Yulara (500 meters) |
|---|
Yulara, location on the map |
|---|
| Jan | Feb | Mar | Apr | May | Jun | Jul | Aug | Sep | Oct | Nov | Dec |
|---|
| Min temp. | 23 | 22 | 20 | 15 | 9 | 6 | 4 | 6 | 11 | 15 | 18 | 21 |
|---|
| Max temp. | 38 | 37 | 34 | 30 | 24 | 20 | 21 | 24 | 29 | 32 | 35 | 36 |
|---|
| Precip. | 30 | 40 | 30 | 15 | 10 | 15 | 15 | 5 | 10 | 25 | 35 | 45 |
|---|
| Prec. days | 4 | 3 | 2 | 2 | 1 | 2 | 2 | 1 | 1 | 3 | 4 | 5 |
|---|
| Humidity | 28% | 33% | 33% | 36% | 46% | 53% | 49% | 38% | 30% | 29% | 30% | 33% |
|---|
| Day length | 14 | 13 | 12 | 12 | 11 | 11 | 11 | 11 | 12 | 13 | 13 | 14 |
|---|
|
|
See also the
temperatures month by month