Select units of measurement for the temperature and rainfall tables (metric or imperial).
Average weather, temperature, rainfall, sunshine
The climate in Papua New Guinea is
hot and humid throughout the year along the coasts and in the plains, while it is progressively cooler, and then colder, as you go up in altitude. In much of the country, covered with dense rainforests, there is no dry season, so we can speak of
equatorial climate, while in some inland valleys and along the south coast, there is a relatively dry season from July to September, and therefore the climate is
tropical.
Papua New Guinea is an island state, located south of the equator and formed by the eastern part of New Guinea (the western part belonging to Indonesia) plus some smaller islands (including New Britain, New Ireland, Manus and Bougainville).
The climate in detail
Monsoons, temperatures, rains
The climate is influenced by the
monsoon circulation: the northwest monsoon prevails from December to April, and the southeast monsoon from May to October. Usually, each monsoon brings rainfall on the exposed slope, but in many areas, it rains during both the monsoons, so it rains all year round.
On the coasts, the
temperatures are high and stable throughout the year in the north, around 30/32 °C (86/90 °F) during the day, while in the south, located farther from the Equator, they decrease a bit (around 2 degrees Celsius) in the southern hemisphere winter, from June to September.
Rainfall typically ranges from 2,000 to 4,000 millimeters (80 to 160 inches) per year, with some higher peaks on the most exposed slopes, where it reaches as high as 7/8 meters (23/26 feet) per year, while it drops to 1,000/1,500 mm (40/60 in) on the southern coast, overlooking the Gulf of Papua and the Coral Sea.

Equatorial climate
Madang
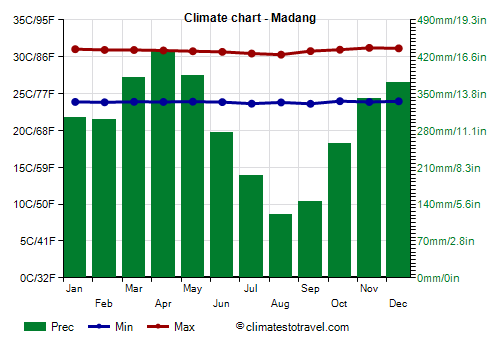
As mentioned, temperatures along the coasts are high throughout the year, and in particular, they are very stable in the areas with an equatorial climate. In
Madang, located at 5 degrees south latitude, on the north-eastern coast of New Guinea, the average temperature ranges from 27 °C (80.5 °F) in July and August to 27.5 °C (81.5 °F) from October to January.
In Madang, 3,500 mm (138 in) of rain fall per year, with a maximum of 430 mm (17 in) in April and a minimum of 120 mm (4.7 in) in August, in fact, as mentioned, we are in the area that has an equatorial climate.
The amount of sunshine in Madang is generally decent, but not exceptional; however, it is a little higher in the least rainy period, from June to October.
The sea is always warm enough for swimming throughout the country, and in the north, near the equator, the sea temperature is more stable, and reaches its minimum in August with 28 °C (82.5 °F).
To the east of the eastern part of New Guinea, which constitutes the largest portion of the country, the islands (including New Ireland, New Britain and Bougainville) are very rainy throughout the year as well. In general, the rains are most abundant from December to April, but not everywhere: in
Lae, facing south-east in the Huon Gulf, the rains are most abundant in July and August, when more than 500 mm (20 in) fall per month.
Tropical climate
Port Moresby
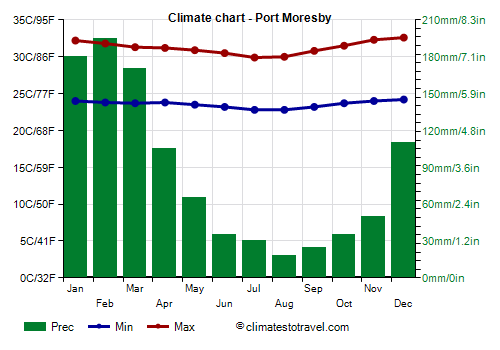
As mentioned, in the
south the temperature decreases more evidently from June to September.
The capital,
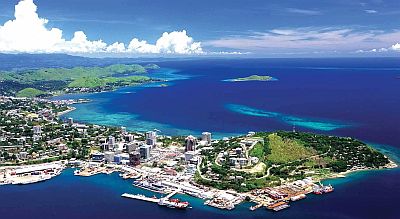
Port Moresby, is located at 9 degrees south latitude, on the coast.
At night it never gets cold, however, the temperature can sometimes drop to 19/20 °C (66/68 °F) from June to September.
At the end of the dry season, in October and November, there can be
very hot periods, but some very hot days can also occur in the rainy season, from December to March. As a result, on the hottest days, the temperature can reach 35/36 °C (95/97 °F) from October to March.
Port Moresby is located in the southern area, which, as mentioned, is
less rainy and more sheltered, so much so that it receives only 1,000 mm (40 in) of rain per year, with a relatively dry period from May to November, when rainfall drops below 70 mm (2.8 in) per month; in particular, the rains are scarce from June to October.
Being that the rains are less frequent, the amount of sunshine in Port Moresby is higher than in other areas of the country.
In the southernmost part, where the capital is located, the sea becomes a bit less warm from July to October, and reaches its minimum in August and September with 25.5 °C (78 °F).
Mountains
The interior of the mainland (eastern New Guinea) is crossed by
mountains: in the north, we find the Victor Emanuel Range and the Bismarck Mountains, the latter culminating in Mount Wilhelm, 4,509 meters (14,793 feet) high, while in the south, we find the Owen Stanley Mountains, whose highest peak is Mount Victoria, 4,038 meters (13,248 feet) high.
At 1,500 meters (5,000 feet) of altitude, the temperature is pleasant: cool at night and warm during the day.
Goroka
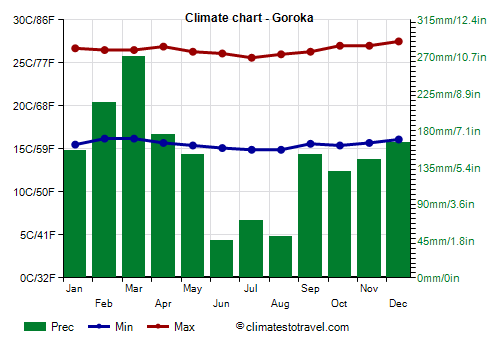
In
Goroka, located at 1,600 meters (5,2520 feet) above sea level, in the Eastern Highlands province, the average temperature fluctuates between 20 °C (68 °F) and 21.5 °C (70.5 °F) throughout the year.
In Goroka, 1,700 mm (68 in) of rain fall per year; there is a relatively dry season from June to August, when, however, some showers can still occur.
The sun in the mountainous areas shines less often than on the coasts, and the sky is often cloudy.
Above 3,500 meters (11,500 ft), the forest is replaced by a sparse mountain vegetation: here, the cold is constant and sometimes it can even snow.
From the mountains, numerous
rivers flow, such as the Sepik and the Fly, which in lowland areas, often at great distance from the mouth, give rise to marshes and swamps, where mangroves and gallery forests grow.
Tropical cyclones
Papua New Guinea can be affected by
tropical cyclones of the South Pacific. Typically, cyclones are formed from November to mid-May, although they are more likely from late November to mid-April.
The part of the country that is directly affected is the center-south. The map below is an indication of the areas that have been affected in the past. The northern areas, however, may be partly affected, with an increase in wind, clouds, and waves.
The climate of Papua New Guinea is also influenced by the so-called ENSO cycle. In
El Niño years, the rainy season is warmer and drier than normal, and the monsoon arrives often late, while the dry season is cooler than normal in the south.
On the other hand, in
La Niña years, the rainy season from December to April is more intense than normal and can lead to flooding, while the dry season is warmer than normal in the south. During neutral phases (neither El Niño nor La Niña), however, it's more likely for cyclones to form.
When to go
The best time to visit the
southern coast of Papua New Guinea, which includes Port Moresby, runs from June to August or September, since it is the driest and the least hot period of the year. Along this coast, in the months of May, October, and November, the rains are rare as well, but they are a bit hotter.
On the contrary, as we have seen above, the
other parts of the country do not experience a real dry season, in fact, they are rainy all year round, and some areas, such as the coast where Lae is located, receive the greatest amount of rainfall right in this period.
However, the best period to visit the country as a whole is still
from June to August, remembering that there can be showers and thunderstorms, more or less intense, in many areas.
What to pack
All year round, bring
tropics-friendly, loose-fitting clothing, a sun hat, a scarf for the breeze, a light sweatshirt for the evening, and a light raincoat or umbrella. When going to the reef, you can bring snorkeling equipment, including water shoes or rubber-soled shoes.
In inland areas, around 2,000 meters (6,500 feet), bring spring/autumn clothes, a sweater and a jacket for the evening, and an umbrella. For the highest peaks, warm clothes, such as a down jacket, gloves, a hat, and hiking boots.
Climate data - Papua New Guinea
| Daru |
|---|
|
| Jan | Feb | Mar | Apr | May | Jun | Jul | Aug | Sep | Oct | Nov | Dec |
|---|
| Min temp. | 24 | 24 | 24 | 24 | 25 | 24 | 23 | 23 | 24 | 24 | 25 | 25 |
|---|
| Max temp. | 31 | 31 | 31 | 30 | 29 | 29 | 28 | 28 | 29 | 30 | 31 | 32 |
|---|
| Precip. | 225 | 260 | 295 | 410 | 185 | 65 | 45 | 30 | 20 | 20 | 50 | 200 |
|---|
| Prec. days | 20 | 20 | 19 | 21 | 20 | 21 | 18 | 16 | 10 | 8 | 8 | 17 |
|---|
|
|
|
|
| Goroka (1,600 meters) |
|---|
|
| Jan | Feb | Mar | Apr | May | Jun | Jul | Aug | Sep | Oct | Nov | Dec |
|---|
| Min temp. | 16 | 16 | 16 | 16 | 15 | 15 | 15 | 15 | 16 | 15 | 16 | 16 |
|---|
| Max temp. | 27 | 26 | 26 | 27 | 26 | 26 | 26 | 26 | 26 | 27 | 27 | 28 |
|---|
| Precip. | 155 | 215 | 270 | 175 | 150 | 45 | 70 | 50 | 150 | 130 | 145 | 165 |
|---|
| Prec. days | 13 | 13 | 13 | 12 | 12 | 12 | 12 | 12 | 12 | 13 | 13 | 13 |
|---|
|
|
| Sun hours | 5 | 5 | 4 | 5 | 4 | 5 | 4 | 5 | 5 | 5 | 5 | 5 |
|---|
|
| Kavieng |
|---|
|
| Jan | Feb | Mar | Apr | May | Jun | Jul | Aug | Sep | Oct | Nov | Dec |
|---|
| Min temp. | 24 | 24 | 24 | 24 | 24 | 23 | 23 | 23 | 23 | 23 | 24 | 24 |
|---|
| Max temp. | 31 | 31 | 31 | 31 | 31 | 31 | 30 | 30 | 31 | 31 | 31 | 31 |
|---|
| Precip. | 315 | 295 | 325 | 280 | 255 | 210 | 245 | 200 | 170 | 215 | 210 | 265 |
|---|
| Prec. days | 23 | 21 | 23 | 21 | 21 | 21 | 22 | 19 | 17 | 19 | 19 | 22 |
|---|
|
|
|
|
| Lae |
|---|
|
| Jan | Feb | Mar | Apr | May | Jun | Jul | Aug | Sep | Oct | Nov | Dec |
|---|
| Min temp. | 24 | 24 | 24 | 24 | 24 | 23 | 22 | 22 | 23 | 23 | 24 | 24 |
|---|
| Max temp. | 32 | 32 | 31 | 30 | 30 | 29 | 28 | 28 | 29 | 30 | 30 | 31 |
|---|
| Precip. | 240 | 240 | 280 | 345 | 350 | 505 | 480 | 515 | 360 | 440 | 335 | 340 |
|---|
| Prec. days | 16 | 17 | 18 | 21 | 21 | 21 | 24 | 24 | 22 | 22 | 21 | 19 |
|---|
|
|
|
|
| Madang |
|---|
|
| Jan | Feb | Mar | Apr | May | Jun | Jul | Aug | Sep | Oct | Nov | Dec |
|---|
| Min temp. | 24 | 24 | 24 | 24 | 24 | 24 | 24 | 24 | 24 | 24 | 24 | 24 |
|---|
| Max temp. | 31 | 31 | 31 | 31 | 31 | 31 | 30 | 30 | 31 | 31 | 31 | 31 |
|---|
| Precip. | 305 | 300 | 380 | 430 | 385 | 275 | 195 | 120 | 145 | 255 | 340 | 370 |
|---|
| Prec. days | 17 | 16 | 19 | 18 | 17 | 11 | 11 | 9 | 10 | 11 | 13 | 18 |
|---|
|
|
| Sun hours | 5 | 5 | 5 | 5 | 6 | 6 | 6 | 7 | 8 | 7 | 6 | 5 |
|---|
| Sea temp | 29 | 29 | 29 | 29 | 29 | 29 | 28 | 28 | 28 | 29 | 30 | 30 |
|---|
| Port Moresby |
|---|
|
| Jan | Feb | Mar | Apr | May | Jun | Jul | Aug | Sep | Oct | Nov | Dec |
|---|
| Min temp. | 24 | 24 | 24 | 24 | 24 | 23 | 23 | 23 | 23 | 24 | 24 | 24 |
|---|
| Max temp. | 32 | 32 | 31 | 31 | 31 | 30 | 30 | 30 | 31 | 32 | 32 | 33 |
|---|
| Precip. | 180 | 195 | 170 | 105 | 65 | 35 | 30 | 20 | 25 | 35 | 50 | 110 |
|---|
| Prec. days | 9 | 8 | 10 | 6 | 3 | 4 | 3 | 2 | 2 | 3 | 4 | 7 |
|---|
|
|
| Sun hours | 6 | 6 | 6 | 7 | 7 | 7 | 7 | 7 | 7 | 7 | 8 | 7 |
|---|
| Sea temp | 29 | 29 | 29 | 29 | 28 | 27 | 26 | 25 | 26 | 26 | 28 | 29 |
|---|
| Rabaul |
|---|
|
| Jan | Feb | Mar | Apr | May | Jun | Jul | Aug | Sep | Oct | Nov | Dec |
|---|
| Min temp. | 24 | 24 | 24 | 24 | 24 | 24 | 24 | 24 | 24 | 24 | 24 | 24 |
|---|
| Max temp. | 31 | 30 | 30 | 31 | 31 | 31 | 30 | 30 | 31 | 31 | 31 | 31 |
|---|
| Precip. | 240 | 195 | 225 | 200 | 160 | 105 | 85 | 120 | 75 | 125 | 155 | 270 |
|---|
| Prec. days | 19 | 18 | 19 | 17 | 13 | 12 | 13 | 12 | 9 | 14 | 14 | 21 |
|---|
|
|
|
|
| Vanimo |
|---|
|
| Jan | Feb | Mar | Apr | May | Jun | Jul | Aug | Sep | Oct | Nov | Dec |
|---|
| Min temp. | 24 | 24 | 24 | 24 | 25 | 24 | 24 | 24 | 24 | 24 | 24 | 24 |
|---|
| Max temp. | 31 | 30 | 31 | 31 | 31 | 31 | 31 | 31 | 31 | 31 | 31 | 31 |
|---|
| Precip. | 320 | 205 | 265 | 280 | 240 | 215 | 215 | 185 | 130 | 135 | 200 | 215 |
|---|
| Prec. days | 19 | 21 | 20 | 18 | 21 | 16 | 18 | 15 | 19 | 17 | 16 | 20 |
|---|
|
|
|
|
| Wewak |
|---|
|
| Jan | Feb | Mar | Apr | May | Jun | Jul | Aug | Sep | Oct | Nov | Dec |
|---|
| Min temp. | 25 | 25 | 25 | 24 | 25 | 24 | 24 | 24 | 24 | 24 | 25 | 25 |
|---|
| Max temp. | 31 | 30 | 30 | 30 | 30 | 30 | 30 | 30 | 30 | 30 | 30 | 30 |
|---|
| Precip. | 130 | 125 | 170 | 185 | 220 | 190 | 180 | 140 | 165 | 225 | 190 | 160 |
|---|
| Prec. days | 16 | 17 | 18 | 19 | 19 | 19 | 17 | 15 | 15 | 18 | 17 | 16 |
|---|
|
|
|
|
See also the
temperatures month by month