Select units of measurement for the temperature and rainfall tables (metric or imperial).
Average weather, temperature, rainfall, sunshine hours
Index
Introduction
The climate of Tasmania is
oceanic on the coasts, with mild, rainy winters and cool summers, while it is colder in the interior. Being that it's in the Southern Hemisphere, the seasons are naturally reversed compared to North America or Europe, so, in July and August, it is winter.
Tasmania is the southernmost state of Australia. At these latitudes (the island is located between 40 and 43 degrees south latitude), the westerlies prevail throughout the year, so the weather is variable, with a series of disturbances that lead to rainfall especially on the western side of the island. The wind blows frequently as well.
Cold air masses from Antarctica can reach the state most of the year, but they have to cover a great distance above the ocean, so they come a bit mitigated, and are felt mainly in inland elevations, where they can bring snowfalls and frosts.
On the other hand,
short heat waves from the Australian desert can affect the island in the summer (December to February).
Rainfall is frequent throughout the year, with a maximum in winter and a minimum in summer. However, it varies greatly in quantity, since the bulk of the rain falls on the western side. In fact, annual precipitaton is equal to or higher than 1,500 millimeters (60 inches) on the west coast, around 2,000 mm (80 in) and more on the western slopes of the inland hills, around 850/950 mm (33.5/37.5 in) on the north coast, and down to 550/650 mm (21.5/25.5 in) in the east coast.
On average, the amount of
sunshine in Tasmania is never excellent, since cloudy days can occur throughout the year, however, between one disturbance and another, the sun can come out: on the coasts, there are on average about 8 hours of sunshine per day in January, and 4 hours in June. In Hobart, there are 2,400 hours of sunshine per year.
Tasmania is an island of 64,400 km² (24,900 sq mi); together with the smaller islands, the surface of the state reaches 68,400 km² (26,400 sq mi). Among the
smaller islands, we can mention King, Flinders and Cape Barren, which are not only the largest ones, but they are also located apart and to the north, in the Bass Strait, which separates Tasmania from Australia.
Other islands (like Bruny, Maria and Robbins) are instead a short distance from the main island.
Coasts and plains
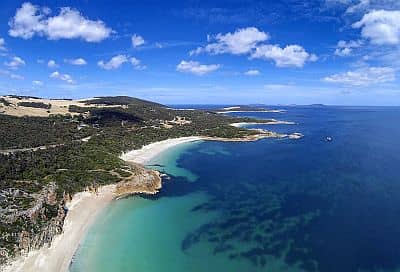
The northernmost islands (King, Flinders, Deal, and Cape Barren) are the ones with the mildest climate, especially in winter.
King Island
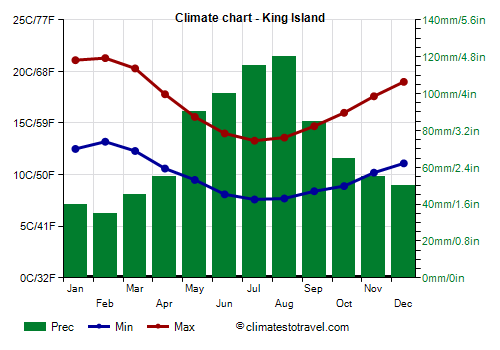
If the most northwestern island,
King Island, the average temperature ranges from 10.5 °C (51 °F) in July and August, to 17 °C (62.5 °F) in January and February. Here are the average temperatures.
King Island - Average temperatures (1991-2020) |
| Month | Min | Max | Mean |
|---|
| January | 12.5 | 21.1 | 16.8 |
|---|
| February | 13.2 | 21.3 | 17.2 |
|---|
| March | 12.3 | 20.3 | 16.3 |
|---|
| April | 10.6 | 17.8 | 14.2 |
|---|
| May | 9.5 | 15.6 | 12.6 |
|---|
| June | 8.1 | 14 | 11 |
|---|
| July | 7.6 | 13.3 | 10.4 |
|---|
| August | 7.7 | 13.6 | 10.6 |
|---|
| September | 8.4 | 14.7 | 11.6 |
|---|
| October | 8.9 | 16 | 12.4 |
|---|
| November | 10.2 | 17.6 | 13.9 |
|---|
| December | 11.1 | 19 | 15 |
|---|
| Year | 10 | 17 | 13.45 |
|---|
In King Island, about 850 millimeters (33.5 inches) of rain fall per year. Owing to the northern location, there is a marked decrease in the summer rains, which are relatively rare (they occur on average 5/6 days per month in January and February).
King Island - Average precipitation| Month | Days |
|---|
| January | 40 | 6 |
|---|
| February | 35 | 5 |
|---|
| March | 45 | 8 |
|---|
| April | 55 | 10 |
|---|
| May | 90 | 15 |
|---|
| June | 100 | 15 |
|---|
| July | 115 | 18 |
|---|
| August | 120 | 19 |
|---|
| September | 85 | 15 |
|---|
| October | 65 | 11 |
|---|
| November | 55 | 9 |
|---|
| December | 50 | 8 |
|---|
| Year | 855 | 139 |
|---|
Strahan
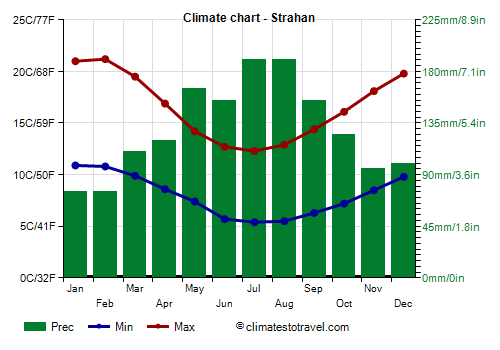
On the west coast of Tasmania, we find
Strahan, where winter is a little cooler because of the more southern latitude, in fact, the average from June to August is around 9 °C (48 °F). The lowest recorded temperatures are about -2/-3 °C (27/28 °F) in the winter months (June to August), while the highest are about 37/39 °C (99/102 °F), and are obviously measured in summer (December to February), during the brief and rare heat waves from the Australian desert.
Strahan - Average temperatures (1991-2020) |
| Month | Min | Max | Mean |
|---|
| January | 10.9 | 21 | 16 |
|---|
| February | 10.8 | 21.2 | 16 |
|---|
| March | 9.9 | 19.5 | 14.7 |
|---|
| April | 8.6 | 16.9 | 12.8 |
|---|
| May | 7.4 | 14.2 | 10.8 |
|---|
| June | 5.7 | 12.7 | 9.2 |
|---|
| July | 5.4 | 12.3 | 8.9 |
|---|
| August | 5.5 | 12.9 | 9.2 |
|---|
| September | 6.3 | 14.4 | 10.4 |
|---|
| October | 7.2 | 16.1 | 11.6 |
|---|
| November | 8.5 | 18.1 | 13.3 |
|---|
| December | 9.8 | 19.8 | 14.8 |
|---|
| Year | 8 | 16.6 | 12.25 |
|---|
The west coast, directly exposed to the west wind, is particularly rainy. The rains are very frequent, but they often occur in the form of brief showers, in a context of variable or unstable weather.
Strahan - Average precipitation| Month | Days |
|---|
| January | 75 | 10 |
|---|
| February | 75 | 9 |
|---|
| March | 110 | 13 |
|---|
| April | 120 | 14 |
|---|
| May | 165 | 18 |
|---|
| June | 155 | 17 |
|---|
| July | 190 | 20 |
|---|
| August | 190 | 21 |
|---|
| September | 155 | 20 |
|---|
| October | 125 | 16 |
|---|
| November | 95 | 13 |
|---|
| December | 100 | 14 |
|---|
| Year | 1560 | 185 |
|---|
Approximately 40 km (25 mi) east of Strahan, we find
Queenstown, where, owing to the proximity to the hills and mountains of the interior, rainfall even reaches 2,400 mm (94.5 in) per year, with a maximum of 270 mm (10.6 in) in July and a minimum of 100 mm (4 in) in February.
Hobart
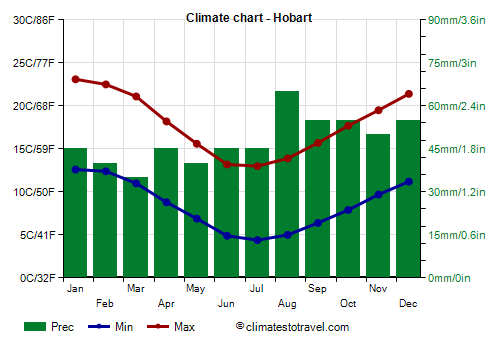
On the east coast, we find the capital,
Hobart, where the temperatures are similar to those of the west coast, but the rains are much less abundant, 565 mm (22 in) per year.
Hobart - Average precipitation| Month | Days |
|---|
| January | 45 | 6 |
|---|
| February | 40 | 5 |
|---|
| March | 35 | 7 |
|---|
| April | 45 | 7 |
|---|
| May | 40 | 6 |
|---|
| June | 45 | 7 |
|---|
| July | 45 | 8 |
|---|
| August | 65 | 10 |
|---|
| September | 55 | 10 |
|---|
| October | 55 | 9 |
|---|
| November | 50 | 8 |
|---|
| December | 55 | 7 |
|---|
| Year | 565 | 91 |
|---|
The
sea in Tasmania is cold throughout the year, however, it reaches 17 °C (63 °F) in February and March in the southern part (see Hobart) and 18 °C (64 °F) in the north. Here are the sea temperatures in Hobart.
Hobart - Sea temperature| Month |
|---|
| January | 16 |
|---|
| February | 17 |
|---|
| March | 17 |
|---|
| April | 16 |
|---|
| May | 15 |
|---|
| June | 14 |
|---|
| July | 13 |
|---|
| August | 12.5 |
|---|
| September | 12.5 |
|---|
| October | 13 |
|---|
| November | 13.5"> |
|---|
| December | 15 |
|---|
| Year | 14.5 |
|---|
In the rare lowland towns that are located at some distance from the sea (as is the case of the aforementioned Queenstown), the climate is slightly more continental. In
Launceston, which is located about 50 km (30 mi) away from the north-east coast, the average in July is 7 °C (44.5 °F), while that in January is 18 °C, with highs of 25 °C (77 °F).
Launceston - Average temperatures (2004-2021) |
| Month | Min | Max | Mean |
|---|
| January | 10.9 | 25.2 | 18 |
|---|
| February | 10.9 | 24.4 | 17.6 |
|---|
| March | 9.4 | 22.4 | 15.9 |
|---|
| April | 6.6 | 18.1 | 12.4 |
|---|
| May | 4.3 | 14.7 | 9.5 |
|---|
| June | 2.5 | 12.2 | 7.4 |
|---|
| July | 2.1 | 11.8 | 7 |
|---|
| August | 2.7 | 12.9 | 7.8 |
|---|
| September | 4 | 15.1 | 9.6 |
|---|
| October | 5.5 | 17.6 | 11.6 |
|---|
| November | 7.7 | 20.3 | 14 |
|---|
| December | 9.1 | 22.6 | 15.8 |
|---|
| Year | 6.3 | 18.1 | 12.15 |
|---|
Launceston receives an average of 685 mm (27 in) of rain per year, in fact, we are in the least rainy area of the state, the eastern one.
Inland areas
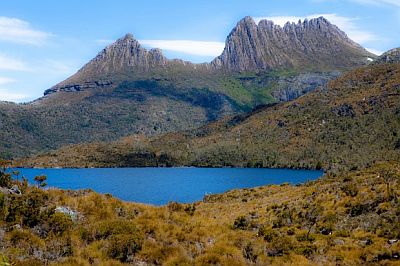
As we have just seen, the temperatures are fairly uniform on the coast, although they tend to be a bit milder in the north than in the south. In inland areas, they are generally colder, both because of the altitude and of the distance from the sea.
In fact, in the interior of the island, we find an hilly landscape, and even some
mountains exceeding 1,000 meters (3,300 feet), the highest of which are Legges Tor, 1,573 meters (5,161 feet) high, and Ossa, 1,617 meters (5,305 feet) high. This is a pristine area, protected in national parks (such as the Cradle Mountain-Lake St Clair National Park) and UNESCO sites, which includes forests, glacial lakes (such as the Gordon and Pedder lakes), rivers (such as the South Esk River, and the Derwent River, whose estuary is located near Hobart), and waterfalls.
The Highlands are particularly windy, in addition, they are more exposed to cold air outbreaks of Antarctic origin, accompanied by snowfall and frost, which may occasionally occur even in summer.
In the Central Highlands, at hill elevations, the winter is cold enough, and during cold spells, the temperature can drop to -10 °C (14 °F) or even below.
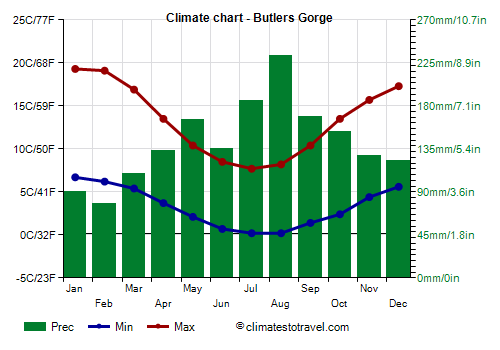
For example, in
Butlers Gorge, situated at 665 meters (2,200 feet) above sea level, the average temperature ranges from 13 °C (55.5 °F) in January to 4 °C (39 °F) in July and August.
Butlers Gorge - Average temperatures (1991-2020) |
| Month | Min | Max | Mean |
|---|
| January | 6.7 | 19.3 | 13 |
|---|
| February | 6.2 | 19.1 | 12.6 |
|---|
| March | 5.4 | 16.9 | 11.1 |
|---|
| April | 3.7 | 13.5 | 8.6 |
|---|
| May | 2.1 | 10.4 | 6.2 |
|---|
| June | 0.7 | 8.5 | 4.6 |
|---|
| July | 0.2 | 7.7 | 4 |
|---|
| August | 0.2 | 8.2 | 4.2 |
|---|
| September | 1.4 | 10.4 | 5.9 |
|---|
| October | 2.4 | 13.5 | 8 |
|---|
| November | 4.4 | 15.7 | 10 |
|---|
| December | 5.6 | 17.3 | 11.4 |
|---|
| Year | 3.2 | 13.3 | 8.25 |
|---|
Precipitation in Butlers Gorge amounts to 1,700 mm (67 in) per year, with a minimum between summer and early autumn (from January to March), of 80/110 mm (3.1/4.3 in) per month, and a maximum of 235 mm (9.2 in) in winter, in July.
Butlers Gorge - Average precipitation| Month | Days |
|---|
| January | 90 | 11 |
|---|
| February | 78 | 9 |
|---|
| March | 110 | 12 |
|---|
| April | 133 | 15 |
|---|
| May | 165 | 15 |
|---|
| June | 136 | 15 |
|---|
| July | 186 | 18 |
|---|
| August | 233 | 20 |
|---|
| September | 169 | 17 |
|---|
| October | 153 | 17 |
|---|
| November | 128 | 15 |
|---|
| December | 123 | 14 |
|---|
| Year | 1705 | 179 |
|---|
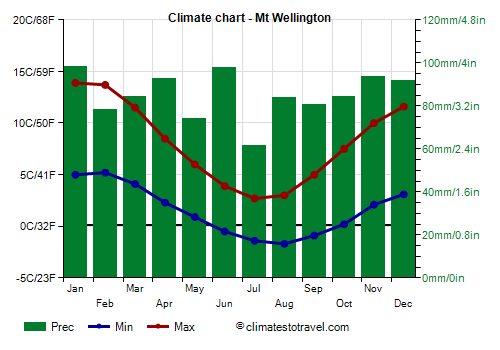
Above a thousand meters (3,300 feet), the climate is very cool or cold all year round. For example, in
Mount Wellington, 1,271 meters (4,170 feet) high and located near Hobart, the average temperature in July and August approaches the freezing point. Cold records are around -7/-9 °C (16/19 °F) from June to September and around -3/-4 °C (25/27 °F) in January and February. However, the temperature rarely remains below freezing even during the day.
Mt Wellington - Average temperatures (1991-2020) |
| Month | Min | Max | Mean |
|---|
| January | 5 | 13.9 | 9.4 |
|---|
| February | 5.2 | 13.7 | 9.4 |
|---|
| March | 4.1 | 11.5 | 7.8 |
|---|
| April | 2.3 | 8.5 | 5.4 |
|---|
| May | 0.9 | 6 | 3.4 |
|---|
| June | -0.5 | 3.9 | 1.7 |
|---|
| July | -1.4 | 2.7 | 0.7 |
|---|
| August | -1.7 | 3 | 0.6 |
|---|
| September | -0.9 | 5 | 2 |
|---|
| October | 0.2 | 7.5 | 3.8 |
|---|
| November | 2.1 | 10 | 6 |
|---|
| December | 3.1 | 11.6 | 7.4 |
|---|
| Year | 1.5 | 8.1 | 4.8 |
|---|
Precipitation in Mt Wellington amounts to 1,030 mm (40.5 in) per year and is well distributed over the seasons.
Mt Wellington - Average precipitation| Month | Days |
|---|
| January | 98 | 18 |
|---|
| February | 78 | 17 |
|---|
| March | 84 | 19 |
|---|
| April | 93 | 19 |
|---|
| May | 74 | 20 |
|---|
| June | 98 | 19 |
|---|
| July | 62 | 21 |
|---|
| August | 84 | 19 |
|---|
| September | 81 | 20 |
|---|
| October | 84 | 20 |
|---|
| November | 94 | 18 |
|---|
| December | 92 | 20 |
|---|
| Year | 1020 | 230 |
|---|
Best Time
The
best period to visit Tasmania is the summer, from December to February, since it is the warmest season, in addition, the days are longer and the rains are less frequent, which is an advantage especially in inland and mountainous areas. It is true that you may sometimes experience very hot weather, which is felt more at low altitude, but in these cases, the heat is quite bearable because of wind and low humidity.
Considering that it can be a bit cold at night even in the height of summer, and lows can drop below 10 °C (50 °F) even on the coasts, it's better to bring a light jacket and a sweater also in this period, and a heavier jacket if you plan to visit the inland and mountainous areas, where the wind blows more easily during the day and the temperature can drop to around freezing at night. In addition, a raincoat may be helpful for the rain showers.
Back to topSee also the
temperatures by month.