Select units of measurement for the temperature and rainfall tables (metric or imperial).
Average weather, temperature, rainfall, sunshine
The climate of the Cocos (or Keeling) Islands, a territory of Australia in the Indian Ocean located 12 degrees south of the Equator, is
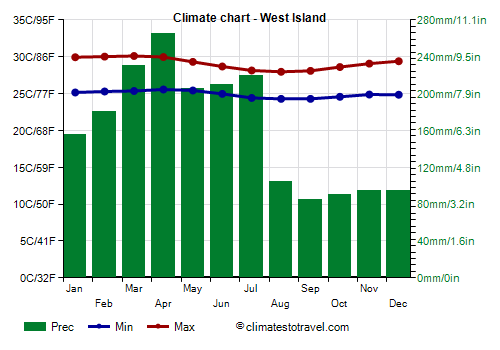
tropical, with a hotter period from January to April, during which the maximum temperature hovers around 30 °C (86 °F), and a relatively cool period from July to September, during which it drops to around 28 °C (82 °F).
Relative humidity is always high, but the heat is tempered by the
southeast trade winds, which blow throughout the year, with greater intensity in the coolest period, from July to September, when the average speed is 27 kph (17 mph), and a minimum in the hottest period, from January to March, when it drops to 18 kph (11 mph). In the latter period, the wind can sometimes change direction during periods of bad weather, which are due to the formation of tropical depressions or cyclones (see below).
The main islands (Home Island and West Island, the only inhabited ones, in addition to South Island) are part of the semicircular structure of the same atoll, called
South Keeling. About 30 km (18 mi) further north is another semi-circular atoll,
North Keeling.

The climate in detail
Temperature and rain
West Island

The
temperature is very stable, and it practically never gets either cold or very hot. In the past, temperatures occasionally dropped below 20 °C (68 °F). In West Island, the coldest record is 18.3 (64.9 °F), set in August 1979, while from 1991 to 2020, the temperature only dropped to 20.4 °C (68.7 °F) in December 2018.
On warmer days, temperatures typically reach 31 °C (88 °F) from January to April, and 29 °C (84 °F) in August and September. The highest record is 32.8 °C (91 °F), set in February 2017 and in April 2015.
Rainfall is abundant, around 2,000 millimeters (79 inches) per year. There is no dry season, even though the rains are more frequent and abundant from February to July, when they hover between 180 and 260 mm (7 and 10 in in) per month, and less from September to December, when they are lower than 100 mm (4 in) per month. The rainfall records, however, are high even in the months that are generally less rainy, which means that the rains do not follow the same pattern in all years.
There is a fair amount of
sunshine hours even in the wettest months, since the tropical rains mainly occur in the form of downpours or thundestorms, so they usually do not last long. However, the sun shines more often in the driest season.
Sea temperature
The
sea is warm enough to swim in all year round, in fact the water temperature ranges from 26.5 °C (79.5 °F) in September and October, to 28/28.5 °C (82.5/83.5 °F) from January to June.
Tropical cyclones
The Cocos Islands can be affected by
tropical cyclones of the southern Indian Ocean, whose season runs from November 1 to May 15, although they are more frequent from December to March. However, in this area of the Indian Ocean, some tropical depressions (though not intense) have also been formed in other periods, namely, in June-July and September-October.
When to go
The best time to visit the Cocos Islands corresponds to the months of
September and October, since they are, on average, the least rainy of the year. However, some showers should be taken into account also in this period.
August is typically an acceptable month as well, although it's a bit more rainy.
What to pack
All year round, bring light clothes, a scarf for the breeze, a light sweatshirt for the evening, and a light raincoat or umbrella, especially in the rainiest season.
Climate data - Cocos Islands
| West Island |
|---|
|
| Jan | Feb | Mar | Apr | May | Jun | Jul | Aug | Sep | Oct | Nov | Dec |
|---|
| Min temp. | 25 | 25 | 25 | 26 | 25 | 25 | 24 | 24 | 24 | 25 | 25 | 25 |
|---|
| Max temp. | 30 | 30 | 30 | 30 | 29 | 29 | 28 | 28 | 28 | 29 | 29 | 29 |
|---|
| Precip. | 155 | 180 | 230 | 265 | 205 | 210 | 220 | 105 | 85 | 90 | 95 | 95 |
|---|
| Prec. days | 10 | 12 | 15 | 14 | 14 | 14 | 15 | 11 | 8 | 6 | 6 | 9 |
|---|
| Humidity | 75% | 77% | 79% | 80% | 79% | 79% | 78% | 76% | 75% | 75% | 75% | 75% |
|---|
| Day length | 13 | 12 | 12 | 12 | 12 | 11 | 12 | 12 | 12 | 12 | 13 | 13 |
|---|
|
| Sea temp | 28 | 28 | 29 | 29 | 28 | 28 | 27 | 27 | 27 | 27 | 27 | 27 |
|---|