Select units of measurement for the temperature and rainfall tables (metric or imperial).
Average weather, temperature, rainfall, sunshine
In New Zealand, the climate is
oceanic, mild in the north and cool in the south, and also
windy and rainy, especially in the southern and western regions. In the
mountains the climate is colder, with frequent and abundant snowfalls, so much so that there are also glaciers.
New Zealand is a country located in Oceania, about 2,000 km (1,200 mi) south-east of Australia. Being in the Southern Hemisphere, the seasons in New Zealand are reversed as compared with Europe or North America.
The climate in detail
Introduction
The country is made up of two main islands, the
North Island and the
South Island, plus several smaller islands.
The weather is often
variable, and there can be sunshine and rain alternating in a few hours, as is typical of oceanic climates.
Rainfall is quite frequent throughout the year, but it is usually more frequent in winter than in summer, except in the extreme south (see Invercargill), where it is frequent even in summer. In the South Island, crossed by high mountains, the rains are much more abundant on the western side than on the eastern one.
The amount of
sunshine is not exceptional, but it's acceptable in summer, at least in the north, where there is a good number of sunny days. On average, there are about 2,000/2,200 hours of sunshine per year in the center-north and 1,700 in the far south.
In summer, it rarely gets
hot, however, occasionally the temperature can reach or exceed 35 °C (95 °F) in January and February in the eastern part of both islands, while on the west coasts the records are about 30 °C (86 °F).
From May to October,
cold air masses from Antarctica can reach New Zealand, bringing greater effects to the South Island, with snow and frost in winter, especially in inland areas. Cold records range from 0 °C (32 °F) in the far north, to -2/-3 °C (27/28 °F) on the west coast of the South Island, to -5/-6 °C (21/23 °F) on the east coast, to -8/-9 °C (16/18 °F) in the extreme south, while they are below -15 °C (5 °F) in the inland areas of the south.
In the southern part of the South Island, a bit of cold air can arrive even in summer. However, cold spells typically last a few days.
North Island
In the North Island, winters are mild everywhere, while summers are very mild in the south and west (see Wellington, New Plymouth) and pleasantly warm in the north and east coast (see Auckland,
Tauranga,
Gisborne, Napier). The average temperature in January and February ranges from 18 to 20 °C (64/68 °F), while that of July ranges from 9 to 11 °C (48 to 52 °F). Precipitation reaches 1,400 mm (55 in) per year on the west coast, while it ranges from 800 to 1,200 mm (31 to 47 in) per year on the eastern and southern coasts.
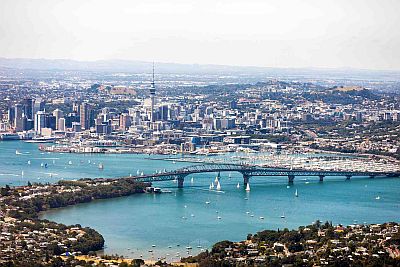
Auckland
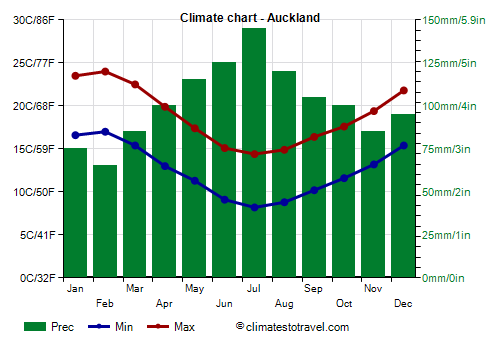
In
Auckland, in the northern part of the island, at 37 degrees south latitude, the average temperature ranges from 11.3 °C (52.3 °F) in July to 20.5 °C (69 °F) in February.
Rainfall is fairly abundant, since it amounts to 1,200 millimeters (47 inches) per year, and it's well distributed over the months. However, the rainiest season is winter, from June to August.
Near Auckland, the temperature of the
sea is very cool, however, it reaches 20/21 °C (68/70 °F) from January to March, when those who do not suffer from the cold can try to swim.
Wellington
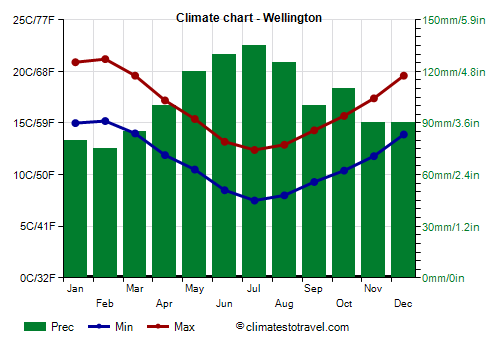
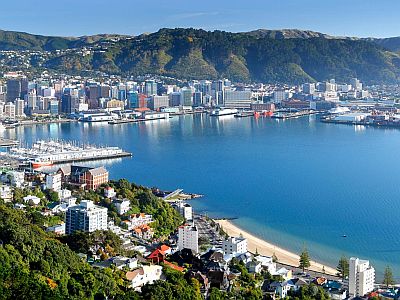
The capital,
Wellington, is located in the southern part of the island, in the Cook Strait, which separates the two islands and is very windy. The climate is similar to that of Auckland, although the temperatures are slightly lower.
Winter is mild, the average temperature in July being 10 °C (50 °F). Summer is cool: the average in February is 18 °C (64 °F). On the warmest days, the temperature usually reaches 25/26 °C (77/79 °F).
Annual precipitation in Wellington is similar to that of Auckland and amounts to 1,250 mm (49 in). The rainiest period is from May to August.
The sea in Wellington is always cold, however, it reaches 17/18 °C (63/64 °F) from January to March.
In the interior of the North Island, there are hills and also a mountain,
Ruapehu, where you can go skiing in winter, and on top of which, above 2,500 meters (8,200 feet), eternal snows are found.
South Island
The South Island is cooler and is exposed to the
westerly winds, which sweep the southern seas around Antarctica and blow for most of the year. In winter, however,
snow and frost may occur, due to cold air masses of polar origin, especially in the southern part.
Southern Alps
This island is crossed by the
Southern Alps, which culminate in Mount Cook/Aoraki, 3,754 meters (12,316 feet) high. In the mountain range, there are
eternal snows above 1,600 meters (6,500 ft). In the area of Mount Cook there are several
glaciers (Tasman, Fox, Franz Josef etc.), while further south we find the Volta glacier, in the area of Mount Aspiring/Tititea, 3,033 meters (9,951 ft) high. Glaciers are retreating due to global warming.
In the central and southern areas of the South Island, there are
ice tongues that descend from the mountains almost to sea level, and after turning into rivers, flow into the sea or feed lakes.
West coast
The
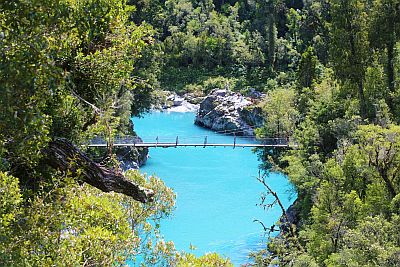
western side is definitely wet, in fact, precipitation is between 2,000 and 3,500 mm (80 and 140 in) per year along the coast, where only towns and villages are found (see Karamea, Westport, Greymouth, Hokitika, Haast), and it's even higher on the western slopes, where it reaches as high as 6 meters (19.5 feet) per year.
The wind is frequent and intense, especially in the south-west, the area of the fjords.
Hokitika
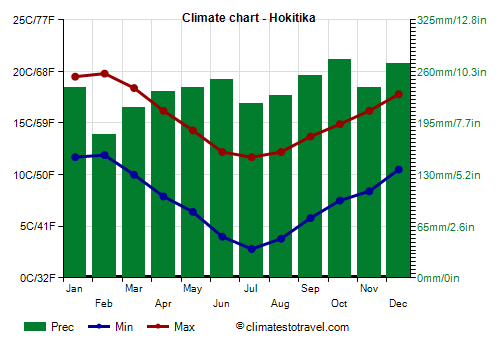
In
Hokitika, located on the west coast, the average temperature ranges from 11 °C (52 °F) in July to 17 °C (62.5 °F) in January.
Here, 2,850 mm (112 in) of rain fall per year.
East coast
On the other hand, the side to the
east of the mountains, where the main cities of the island are located, is definitely less rainy, in fact, precipitation decreases below 1,000 mm (40 in) per year, and some inland areas are even arid: in Alexandra, only 360 mm (14 in) of rain fall per year.
In this area, there can sometimes be sudden rises in temperature due to
downslope, foehn-type winds that descend from the mountains. From December to March, with this wind the temperature can reach 35/36 °C (95/97 °F).
Christchurch
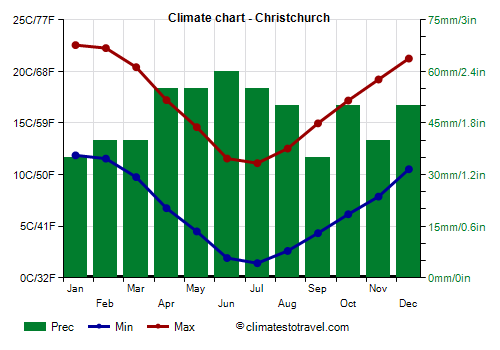
In
Christchurch, located on the east coast, at 41 degrees south latitude, the average temperature ranges from 6 °C (43 °F) in July to 17 °C (63 °F) in January and February.
Christchurch receives 575 mm (23 in) of rain per year and is the driest between the major cities of New Zealand, even though the rains are still quite frequent.
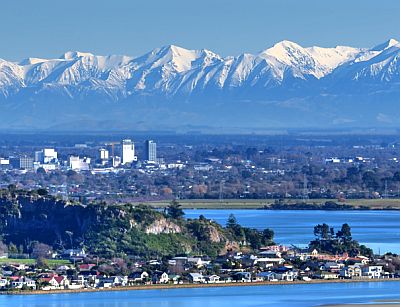
The temperature of the sea on the South Island is always cold; near Christchurch, it ranges from 10 °C (50 °F) in the winter months to 15 °C (59 °F) in January and February.
Central Otago
During the winter, the lowest temperatures are reached in the southern inland areas, particularly in
Central Otago, where there are a few towns, such as the aforementioned
Alexandra, which, in addition to being dry, is also cold, with an average in July of only 3 °C (37.5 °F). Here, during cold waves, there may be intense frosts at night.
As mentioned, precipitation in Alexandra is quite scarce.
In particular, in the plain of
Maniototo, from May to September the temperature can drop to -10 °C (14 °F) or even below. In the village of Ranfurly, a temperature of -25.6 °C (-14.1 °F) would have been reached in 1903, and if this value is correct, it is the absolute cold record in New Zealand. In more recent times, the record is -21.6 ºC (-6.9 °F), set in Ophir in July 1995.
In summer, in this area daytime temperatures are around 25 °C (77 °F) in January and February, while nights are very cool, around 10 °C (50 °F).
Far South
In the
far south, exposed to the winds from the south and less protected by the mountains to the west (which are lower in this area), the climate is very cool, if not cold.
Invercargill
In
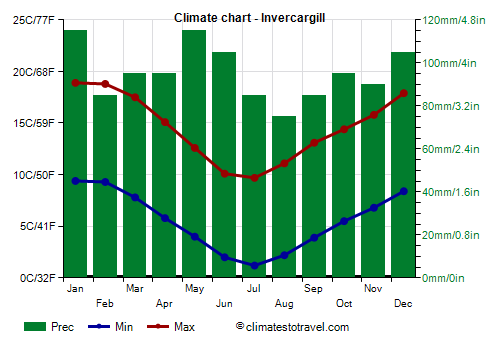
Invercargill, near the south coast, the average temperature ranges from 5.5 °C (42 °F) in July to 14 °C (57 °F) in January and February. The city is very windy, and is the second windiest city in New Zealand after Wellington. Furthermore, the rains are frequent even in summer, and amount to 1,150 mm (45 in) per year.
Cold air masses from Antarctica can arrive all year round, and in all months the cold records are below freezing. In winter, from June to August, the temperature can drop to -7/-8 °C (18/19 °F), owing to the presence of the sea and the wind, during the day the temperature goes above freezing even on these occasions.
In summer, the temperature generally reaches 27/28 °C (81/82 °F) on the hottest days, but in recent years, it has occasionally exceeded 30 °C (86 °F).
In the south, in Invercargill, the sea only reaches 13 °C (55.5 °F) in January and February, although during the winter the sea temperature is still around 10 °C (50 °F).
The city of
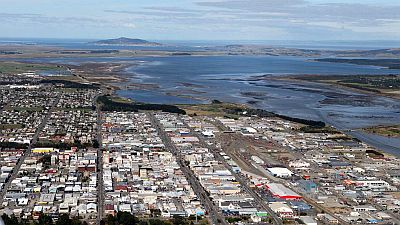
Dunedin, which is located in the south-east, is a little more sheltered from rain and wind, but all in all, it has a similar climate.
Small islands
There are also some
islands belonging to New Zealand, but far away from the main territory.
The
Kermadec islands, located more than 950 kilometers (600 miles) north-east of the North Island, between 29 and 31 degrees south latitude, have a humid subtropical climate, mild and rainy.
The
Chatham Islands, 850 km (530 mi) east of the South Island and at 44 degrees south latitude, have an oceanic climate, similar to certain areas of the South Island itself.
Campbell Island, 600 km (370 mi) south of the South Island and at 52 degrees south latitude, is an uninhabited island, definitely cold and windy all year round.
Tropical cyclones
New Zealand is not located in the path of
cyclones, but once in a while, a tropical cyclone, usually weakened, may reach these latitudes, usually affecting the North Island and the northernmost part of the South Island, bringing rain, wind, and storm surges. In the last few decades, tropical cyclones or their remains have affected New Zealand from mid-December to April 20, with a higher frequency from January to March.
Here are some cyclones that have affected New Zealand:
In early April 1968, Cyclone
Giselle, formed by the collision of a tropical cyclone with cold air from the south, brought record gusts of wind to Wellington.
In early March 1988, Cyclone
Bola brought high winds and record rainfall to the North Island.
Around mid-February 2022, Cyclone
Dovi hit the North Island and the northern part of the South Island.
Around mid-February 2023, Cyclone
Gabrielle hit the North Island hard, causing widespread flooding.
When to go
The best time to visit New Zealand is the austral summer, from
December to March. It is a pleasantly warm season in the North Island, and cool in the South Island.
It should be remembered that even in this season it can rain, in the North Island it can get cool at night, and in the South Island it can get cold.
Furthermore, it must be said that every now and then a tropical cyclone can arrive, or its remnants, which can affect the North Island and the northernmost part of the South Island.
If you want to visit the country in
winter, for example in August, you can choose the North Island, which is milder and more sheltered from cold waves, and maybe you can combine the exploration of the cities with a bit of skiing in the mountains.
What to pack
In
winter (June to August): for the North Island, Auckland, and Wellington, bring spring/autumn clothes, a sweater, a jacket, and a raincoat or umbrella. For the South Island, bring warm clothes, such as a down jacket, a scarf, a hat, and a raincoat. For high mountains, mountain clothing.
In
summer (December to February): for the North Island, Auckland, and Wellington, and the South Island down to Christchurch, bring light clothes for the day, a sweatshirt and a light jacket for the evening, and a raincoat or umbrella. For the south, spring/autumn clothes, a sweater, and a raincoat or umbrella. For the Southern Alps, warm mountain clothing.
Climate data - New Zealand
| Alexandra |
|---|
|
| Jan | Feb | Mar | Apr | May | Jun | Jul | Aug | Sep | Oct | Nov | Dec |
|---|
| Min temp. | 11 | 10 | 7 | 4 | 2 | -2 | -2 | 0 | 2 | 4 | 7 | 9 |
|---|
| Max temp. | 25 | 25 | 22 | 18 | 14 | 9 | 8 | 12 | 16 | 19 | 21 | 23 |
|---|
| Precip. | 50 | 35 | 30 | 20 | 25 | 30 | 25 | 20 | 20 | 30 | 30 | 45 |
|---|
| Prec. days | 7 | 5 | 5 | 4 | 7 | 6 | 4 | 4 | 5 | 6 | 5 | 8 |
|---|
|
|
| Sun hours | 7 | 7 | 6 | 5 | 4 | 3 | 3 | 4 | 5 | 6 | 7 | 7 |
|---|
|
| Auckland |
|---|
|
| Jan | Feb | Mar | Apr | May | Jun | Jul | Aug | Sep | Oct | Nov | Dec |
|---|
| Min temp. | 17 | 17 | 16 | 13 | 11 | 9 | 8 | 9 | 10 | 12 | 13 | 15 |
|---|
| Max temp. | 24 | 24 | 23 | 20 | 18 | 15 | 14 | 15 | 16 | 18 | 19 | 22 |
|---|
| Precip. | 75 | 65 | 85 | 100 | 115 | 125 | 145 | 120 | 105 | 100 | 85 | 95 |
|---|
| Prec. days | 8 | 7 | 8 | 11 | 12 | 15 | 16 | 15 | 13 | 12 | 10 | 9 |
|---|
| Humidity | 74% | 75% | 76% | 79% | 83% | 84% | 84% | 82% | 80% | 78% | 76% | 76% |
|---|
| Day length | 14 | 13 | 12 | 11 | 10 | 10 | 10 | 11 | 12 | 13 | 14 | 15 |
|---|
| Sun hours | 7 | 7 | 6 | 5 | 5 | 4 | 4 | 5 | 5 | 6 | 6 | 6 |
|---|
| Sea temp | 20 | 21 | 20 | 19 | 18 | 17 | 16 | 15 | 15 | 16 | 17 | 18 |
|---|
| Christchurch |
|---|
|
| Jan | Feb | Mar | Apr | May | Jun | Jul | Aug | Sep | Oct | Nov | Dec |
|---|
| Min temp. | 12 | 12 | 10 | 7 | 5 | 2 | 1 | 3 | 4 | 6 | 8 | 11 |
|---|
| Max temp. | 23 | 22 | 20 | 17 | 15 | 12 | 11 | 13 | 15 | 17 | 19 | 21 |
|---|
| Precip. | 35 | 40 | 40 | 55 | 55 | 60 | 55 | 50 | 35 | 50 | 40 | 50 |
|---|
| Prec. days | 6 | 5 | 6 | 7 | 8 | 8 | 8 | 7 | 6 | 7 | 7 | 7 |
|---|
| Humidity | 70% | 72% | 74% | 78% | 80% | 82% | 81% | 79% | 74% | 72% | 69% | 70% |
|---|
| Day length | 15 | 14 | 12 | 11 | 10 | 9 | 9 | 10 | 12 | 13 | 15 | 15 |
|---|
| Sun hours | 8 | 7 | 6 | 5 | 5 | 4 | 4 | 5 | 6 | 7 | 7 | 7 |
|---|
| Sea temp | 15 | 15 | 14 | 13 | 12 | 10 | 10 | 10 | 10 | 11 | 12 | 14 |
|---|
| Hokitika |
|---|
|
| Jan | Feb | Mar | Apr | May | Jun | Jul | Aug | Sep | Oct | Nov | Dec |
|---|
| Min temp. | 12 | 12 | 10 | 8 | 6 | 4 | 3 | 4 | 6 | 8 | 8 | 10 |
|---|
| Max temp. | 20 | 20 | 18 | 16 | 14 | 12 | 12 | 12 | 14 | 15 | 16 | 18 |
|---|
| Precip. | 240 | 180 | 215 | 235 | 240 | 250 | 220 | 230 | 255 | 275 | 240 | 270 |
|---|
| Prec. days | 12 | 10 | 13 | 13 | 15 | 14 | 14 | 15 | 17 | 17 | 15 | 16 |
|---|
|
|
| Sun hours | 7 | 7 | 6 | 5 | 4 | 3 | 4 | 4 | 5 | 5 | 6 | 6 |
|---|
| Sea temp | 18 | 18 | 18 | 16 | 15 | 14 | 13 | 13 | 13 | 13 | 14 | 16 |
|---|
| Invercargill |
|---|
|
| Jan | Feb | Mar | Apr | May | Jun | Jul | Aug | Sep | Oct | Nov | Dec |
|---|
| Min temp. | 9 | 9 | 8 | 6 | 4 | 2 | 1 | 2 | 4 | 6 | 7 | 8 |
|---|
| Max temp. | 19 | 19 | 18 | 15 | 13 | 10 | 10 | 11 | 13 | 14 | 16 | 18 |
|---|
| Precip. | 115 | 85 | 95 | 95 | 115 | 105 | 85 | 75 | 85 | 95 | 90 | 105 |
|---|
| Prec. days | 13 | 10 | 12 | 12 | 15 | 16 | 14 | 13 | 13 | 14 | 13 | 14 |
|---|
| Humidity | 75% | 78% | 79% | 81% | 82% | 84% | 84% | 80% | 78% | 76% | 75% | 75% |
|---|
| Day length | 15 | 14 | 12 | 11 | 9 | 9 | 9 | 10 | 12 | 13 | 15 | 16 |
|---|
| Sun hours | 6 | 6 | 5 | 4 | 3 | 3 | 3 | 4 | 5 | 6 | 6 | 6 |
|---|
| Sea temp | 13 | 13 | 13 | 12 | 11 | 11 | 10 | 10 | 10 | 10 | 11 | 12 |
|---|
| Wellington |
|---|
|
| Jan | Feb | Mar | Apr | May | Jun | Jul | Aug | Sep | Oct | Nov | Dec |
|---|
| Min temp. | 15 | 15 | 14 | 12 | 10 | 8 | 8 | 8 | 9 | 10 | 12 | 14 |
|---|
| Max temp. | 21 | 21 | 20 | 17 | 15 | 13 | 12 | 13 | 14 | 16 | 17 | 20 |
|---|
| Precip. | 80 | 75 | 85 | 100 | 120 | 130 | 135 | 125 | 100 | 110 | 90 | 90 |
|---|
| Prec. days | 7 | 7 | 8 | 9 | 12 | 13 | 13 | 13 | 11 | 11 | 10 | 9 |
|---|
| Humidity | 74% | 74% | 75% | 77% | 77% | 78% | 78% | 77% | 75% | 75% | 73% | 74% |
|---|
| Day length | 15 | 14 | 12 | 11 | 10 | 9 | 10 | 10 | 12 | 13 | 14 | 15 |
|---|
| Sun hours | 8 | 7 | 6 | 5 | 4 | 3 | 4 | 4 | 5 | 6 | 7 | 7 |
|---|
| Sea temp | 17 | 18 | 17 | 16 | 15 | 14 | 13 | 12 | 12 | 13 | 14 | 16 |
|---|
See also the
temperatures month by month