Select units of measurement for the temperature and rainfall tables (metric or imperial).
Average weather, temperature, rainfall, sunshine
Christmas Islands is a territory of Australia located in the Southern Indian Ocean, at 10 degrees south latitude and 375 km (235 mi) southwest of Java, and has a
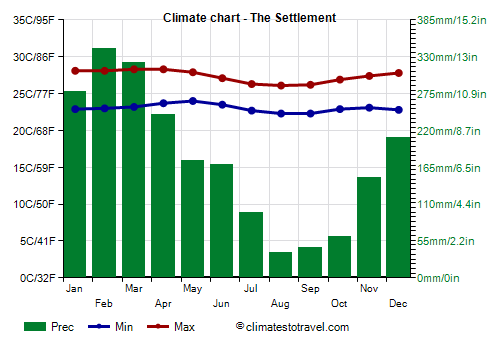
tropical climate, with a rainy period from November to June and a quite dry period from July to October.
As for the
wind, from May to November the
south-east trade winds prevail, which blow steadily and reach their maximum in the driest period, from July to October, when the average speed exceeds 20 kph (12.5 mph) even at 9 am.
In the rainy period, especially from January to March, the wind is weaker and more variable, and sometimes tropical depressions can form, linked to the
north-west monsoon that affects the island of Java. These depressions can cause periods of bad weather, which can last a few days, and even strong winds, which hit in particular the northern coast. Sometimes, cyclones can also pass (see below).
Most of the island is occupied by hills, which reach up to 320 meters (1,050 feet) of altitude, and is covered by forests.
The climate in detail
Temperature and rain

The capital and largest city is
Flying Fish Cove (or The Settlement). There is a part on the coast and a part on the hills, at 220 meters (720 feet) above sea level.
The airport, from which the meteorological data are taken, is located in the upper part of the island, at 280 meters (920 ft) above sea level, so the
temperatures are a little lower (nearly two degrees Celsius) than on the coast.
So, given that highs are around 26/27 °C (79/81 °F) from June to November and around 28 °C (82 °F) from December to May, it can be estimated that at sea level they vary from 28 to 30 °C (82 to 86 °F).
Furthermore, the
records vary slightly compared to the average. At night, the temperature rarely drops below 20 °C (68 °F), however, in December 2018, it dropped to 17 °C (62.5 °F). During the day, on the hottest days the temperature typically reaches 29 °C (84 °F) from December to May, although in January 2019 it reached 31.4 °C (88.5 °F). In 1983, year of El Niño, the same temperature was reached in February, March and April.
The main difference in the climate is found in the
rainfall, which amounts to 2,100 millimeters (83 inches) per year, and it's much more abundant in the rainy season, from November to June, while the rains are rarer and shorter from July to October. The rainiest months are February and March, when about 320/340 mm (12.6/13.8 in) of rain fall per month, while the driest months are August and September, when precipitation amounts to less than 50 mm (2 in) per month. The rainy period is accompanied by high humidity, which brings low clouds and mists on the inland hills.
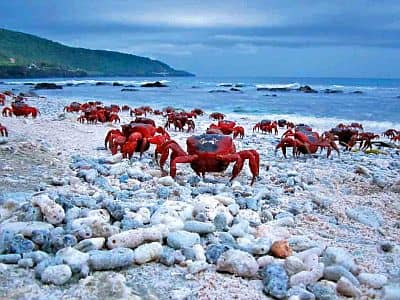
Between October and November, at the beginning of the rainy season, the famous
red crab migration occurs on the island: millions of crabs come out from the forest, where they had been hiding in the dry season, and migrate to the beach, to mate and lay their eggs.

Sea temperature
The
sea in Christmas Island is warm enough to swim in all year round, in fact the water temperature only drops to 26/27 °C (79/81 °F) from July to October.
Tropical cyclones
Christmas Island is on the edge of the area where tropical cyclones of the Southern Indian Ocean can form, so it is not directly affected by them in the acme of their intensity, but it's brushed by tropical storms or cyclones in the early stages of their formation. In theory, this can happen from November to mid-May, even though, in the last thirty years, it only happened from November to April, with a peak in December.
The island was hit, without very serious damage, by Cyclone Rosie in April 2008 and by Cyclone Gillian in March 2014.
When to go
The best time to visit Christmas Island is from
July to October, since it is the least rainy and the sunniest period of the year; in particular, the months of August and September stand out as the driest.
What to pack
All year round, bring light clothes, a scarf for the breeze, a light sweatshirt for the evening, and a light raincoat or umbrella.
Climate data - Christmas Island
| The Settlement |
|---|
|
| Jan | Feb | Mar | Apr | May | Jun | Jul | Aug | Sep | Oct | Nov | Dec |
|---|
| Min temp. | 23 | 23 | 23 | 24 | 24 | 24 | 23 | 22 | 22 | 23 | 23 | 23 |
|---|
| Max temp. | 28 | 28 | 28 | 28 | 28 | 27 | 26 | 26 | 26 | 27 | 27 | 28 |
|---|
| Precip. | 280 | 345 | 320 | 245 | 175 | 170 | 95 | 40 | 45 | 60 | 150 | 210 |
|---|
| Prec. days | 16 | 17 | 19 | 15 | 11 | 10 | 8 | 6 | 4 | 4 | 8 | 12 |
|---|
| Humidity | 86% | 88% | 88% | 86% | 85% | 84% | 83% | 82% | 82% | 83% | 84% | 85% |
|---|
| Day length | 13 | 12 | 12 | 12 | 12 | 12 | 12 | 12 | 12 | 12 | 13 | 13 |
|---|
|
| Sea temp | 28 | 29 | 29 | 29 | 29 | 28 | 27 | 27 | 26 | 27 | 28 | 28 |
|---|